Abstract
Objective. The aim of this study was to assess the frequency of mycobacteria and Escherichia coli reactive T cells in intestinal biopsies from patients with Crohn's disease (CD) and ulcerative colitis (UC). Materials and methods. The biopsies were obtained by colonoscopy from adult patients with active CD (n = 5) and active UC (n = 4). The number of CD4+ T cell clones expanded and screened from each patient varied from 383 to 3972 giving a total of 16639 individual clones. The T cell clones were tested for responses to Mycobacterium avium subspecies paratuberculosis (MAP) and E. coli. The cytokine profile of 42 individual T cell clones from four CD patients was assessed. Results. The frequency of mycobacteria reactive T cell clones in CD patients ranged from 0.17 to 1.63% and was higher (p = 0.038) than the frequency of E. coli reactive T cells ranging from 0 to 0.18%. No or very low numbers of mycobacteria reactive clones were detected in three UC patients while the fourth UC patient had a frequency similar to what was observed in CD patients. The frequencies of E. coli reactive T cell clones in UC patients ranged from 0 to 0.52%. T cell clones (n = 42) from CD patients all produced IL-17 and/or IFN-γ. Several clones were also able to produce IL-10. Conclusions. The high frequency of intestinal tissue resident T cells reactive to mycobacteria suggests that an adaptive immune response have taken place and argues that these bacteria may contribute to the chronic inflammation in CD.
Key Words::
Introduction
Crohn's disease (CD) and ulcerative colitis (UC) are two types of inflammatory bowel disease (IBD). Both CD and UC are polygenic diseases, and a recent meta-analysis of genome-wide association studies (GWAS), including more than 75,000 patients and controls, demonstrated extensive sharing of susceptibility genes between the two conditions [Citation1]. Interestingly, there is considerable overlap between susceptibility loci for IBD and mycobacterial infection [Citation1,2]. The notion that intestinal bacteria play a key role in IBD is supported by mouse models of colitis where disease is contingent of microbiota exposure [Citation3] and observations in humans where antibiotic treatment [Citation4] and diverting the fecal stream away from sites of disease [Citation5] can reduce activity of IBD. Many of the IBD susceptibility genes relate to innate recognition of bacteria, autophagy and inflammation, and in particular NOD2 and ATG16L, which are prominent genetic factors in CD [Citation6–8], hint to host defense against infections as key part of the pathogenesis.
As to which intestinal bacteria are involved in the pathogenesis of CD and UC, much uncertainty remains. Characterization of the microbiota in affected individuals and control subjects has demonstrated a relative increase in numbers of Proteobacteria and Actinobacteria and a decrease in Firmicutes in IBD patients [Citation9]. Enterobacteriaceae seem to be increased particularly in CD while less dysbiosis were often observed in UC [Citation10–12]. However, there is no general bacterial signature for IBD patients, and it is not clear whether the observed bacterial dysbiosis is the cause or the result of the disease.
An alternative way to search for relevant microbiota is to look at T cell responses to bacterial antigens. We previously screened for recall responses of intestinal CD4+ T cells to various bacteria in IBD patients and demonstrated higher responses to Mycobacterium avium subspecies paratuberculosis (MAP) in CD patients [Citation13]. Of the other bacterial antigens responses to Escherichia coli was most frequently detected. Responses were mainly detected in patients with chronic, active disease and in another study, a similar cohort of patients appeared to harbor mycobacteria in intestinal biopsies [Citation14]. In this study, we aimed to investigate the relative numbers of mycobacteria and E. coli reactive CD4+ T cells in biopsies to address whether clonal expansion of T cells directed against these bacteria had taken place. Increased frequencies of T cells suggest that these bacteria contribute to the inflammation. Moreover, we wanted to characterize in further detail the phenotype of T cell clones from CD patients.
Methods
Study subjects
Intestinal biopsies were obtained by colonoscopy from adult patients with CD (n = 5) and UC (n = 4) coming in for a clinically indicated investigation. Patients with chronic and endoscopically active IBD were recruited and biopsies were taken from the outskirts of the lesions. The average age of the CD patients (1 man, 4 women) was 44 years (range 25–59), and the average age of the UC patients (3 men, 1 women), was 40 years (range 25–52). Information about disease localization, current activity and medication is given in . All patients gave written informed consent before the colonoscopy. The study was approved by the Regional Committee for Medical Research Ethics, South Norway, and approval for storing of biological materials was obtained by the Norwegian Directorate for Health and Social Affairs.
Table I. Patient characteristics.
HLA-typing
The patients were genomically HLA typed using the Olerup SSP HLA kits for DQB1*, DRB1*, DPB1* (GenoVision/Qiagen) or serologically typed by a complement dependent cytotoxicity test with immunomagnetically separated cells (Dynabeads® HLA class II, Invitrogen).
Strains and antigens
The antigens were prepared from the following strains as described previously [Citation13]: E. coli ATCC 43893 (enteroinvasive), Mycobacterium avium subsp. paratuberculosis 2E.
Establishment of T cell clones
The biopsies were incubated with complete medium (RPMI 1640 (Gibco) containing 10% human serum, β-mercaptoethanol, penicillin, streptomycin and fungizone) overnight. Epithelial cells and intraepithelial lymphocytes were removed by incubation of biopsies in 2 mM EDTA/2% FCS/PBS for 1 h at 37°C. The remaining material was digested with collagenase (Sigma-Aldrich C-8051; 1 mg/ml) in 3% FCS/PBS for 1 h at 37°C. CD4+ T cells were isolated using Dynabeads® CD4 Positive Isolation Kit (Invitrogen), and the beads were removed using DETACHaBEAD® (Invitrogen). The cells were dissolved in complete medium and stimulated with 1 × 10⁶ allogeneic, irradiated (50 Gy) PBMC, 10 U/mL human IL-2 (R&D Systems, Abingdon, UK), and 1 ng/mL human IL-15 (R&D Systems) and seeded in Terisaki plates at a concentration of 0.1, 1 and 10 cells per well, and in 96 well plates (100 cells/well). Cells with a probability of clonality (Poisson analysis) higher than 85% were regarded as clonal and were subsequently expanded and screened as such. T cells from other plates were expanded and screened in pools ranging from 4 to 25 cells/well. On day 10–11, the T cells were restimulated as described above with the addition of 1 μg/mL phytohemagglutinin (Remel, Lenexa) and expanded for 8 days. The cells were split and fresh medium were added when needed. Before testing the medium was removed and fresh medium without cytokines was added.
T cell proliferation assay
Testing of reactivity against MAP (10 μg/ml) and E. coli (10 μg/ml) was done by assessing proliferation in restimulation assays as described previously [Citation13]. Autologous adherent cells from frozen PBMC were used for APC in all initial screenings while HLA-II matched donors or autologous APC were used for later testing. The HLA restriction of the T cells was determined by testing inhibition of T cell proliferation in the presence of mAb B8.11 (pan-DR), SPV-L3 (pan-DQ) or B7/21 (pan-DP) at a concentration of 20 µg/ml.
T cell clones for phenotypic characterization
From four CD patients individual T cell clones reactive with MAP, E. coli or with unknown specificity were expanded and subjected to further studies; IBD18 (n = 10, three MAP reactive, one E. coli reactive, six unknown), IBD55 (n = 10, two MAP reactive, one E. coli reactive, seven unknown), IBD56 (n = 12, all unknown) and IBD58 (n = 10, two MAP reactive, eight unknown).
Staining for surface markers
T cell clones were stained with anti-CD4 (PerCp/Cy5.5, Okt4, Biolegend) for 20 min, washed and mixed with unstained PBMC (internal control). The mix was subsequently stained with anti-β7 (FITC, FIB504, Biolegend), anti-CD161 (Alexa 647, HP-3616, Biolegend), anti-CCR6 (PE, BD Pharmingen) or isotype controls. The intensity of labeling for the different surface markers in the CD4 stained T cell clones were compared to the negative population of the PBMC.
Cytokine assays
The amount of cytokines was measured in supernatant using the Bio-Plex™ Cytokine Assay, (Bio-Rad) after stimulation with Dynabeads® Human T-Activator CD3/CD28 (Life technologies) and PMA and Ionomycin (both from SigmaAldrich) in duplicate wells for 24 h.
Statistical analyses
The response to the two bacterial antigens within each patient group were analyzed using a paired t-test. The response in each patient was analyzed using a binominal test with the hypothesis, H0: Response to E. coli ≥ response to MAP. The GraphPad Prism software was used for the analyses.
Results
Isolation, growth and testing of CD4+ T cells
The yield of CD4+ T cells from each patient varied from 20 000 to 130 000, the purity estimated by flow cytometry was >98% and the percentage of growing T cells ranged from 13% to 25%. The number of T cell clones tested from each patient varied from 408 to 3972, and the percentage tested as single clones ranged from 0% to 7% in the CD group and 3% to 38% in the UC group. The frequency of mycobacteria responsive T cell clones were highest in plates were the T cells were expanded as single clones and somewhat lower when 4–25 T cell clones were expanded and tested together (Supplementary Figure 1). These results suggested that some of the responsive T cells were outgrown by other T cells when expanded together. Furthermore, some of the clones grew very slowly on re-stimulation, suggesting that they might be effector cells at the end their life-cycle. Based on the multi-well format of the assay, together with the fact that the T cells were screened in single wells, we wanted to use a strict cut-off for a positive response. Some low responding T cells with a stimulation index (SI) around 5–10 were expanded and retested, and the response was usually, but not always, maintained. Based on these results, a cut-off of SI >10 was considered positive. However, we also calculated the number of positive wells by using the cut-off described by Geiger et al. [Citation15] who looked at specific responses in CD4+ T cell libraries. Their cultures were scored positive when the SI was >5 and the cpm in response to antigen-pulsed wells – cpm in response to unpulsed wells exceeded 3 × 10³ cpm.
Frequencies of mycobacteria and E. coli reactive T cell clones in biopsies
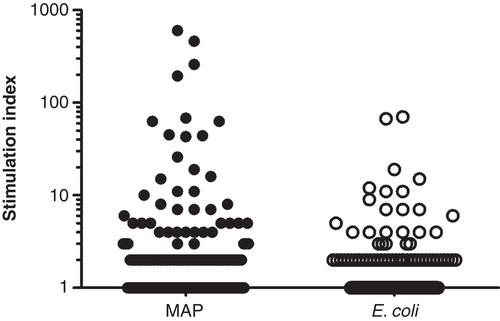
The frequency of mycobacteria reactive T cell clones in CD patients when using the stricter cut-off of SI >10, ranged from 0.17% to 1.63% and was higher (p = 0.038) than the frequency of E. coli reactive T cells ranging from 0% to 0.18% () The variation in response between the individual clones are demonstrated in . All the CD patients had more T cell clones reactive to MAP compared to E. coli and the difference was significant for IBD55 (p = 0.002) and IBD56 (p = 0.032). In comparison, no or very low numbers of MAP reactive clones were detected in three UC patients while the fourth UC patient had a frequency similar to what was observed in CD patients. This patient also had a high E. coli response. The frequencies of E. coli reactive T cell clones in UC patients ranged from 0.00% to 0.52%. By using the cut-off described by Geiger et al. [Citation15], the estimates of reactive clones were generally somewhat higher (). In one CD patient, the estimate of MAP reactive clones by the two methods differed substantially; (1.63% vs 4.76%). The HLA restriction was determined for two MAP reactive and one E. coli clones from two different CD patients (IBD18 and IBD55). All the clones were HLA-DR restricted except the E. coli reactive clone from patient IBD18 which was HLA-DP restricted (data not shown).
Table II. Frequency of reactive CD4 T cells after direct cloning from biopsies using two different cut-offs.
Figure 1. Screening of 3972 clones from one CD patient (IBD55). CD4 T cells were isolated from intestinal biopsies and expanded in vitro. The responses to MAP and E. coli was tested in a 3H thymidine incorporation assay using autologous adherent cells as APC. Each symbol represents one tested well. The line indicates the cut-off of a stimulation index >10 (response in antigen stimulated well/response in unstimulated wells). The response to the two bacterial antigens was compared using a binominal test (p = 0.032).
Cytokine profile and surface markers
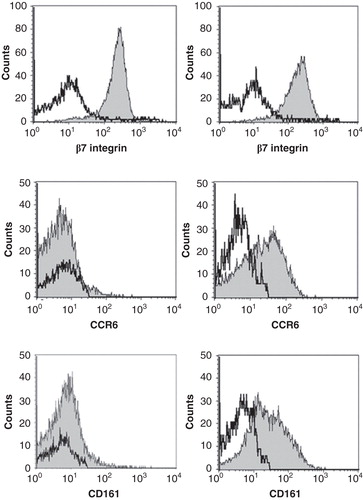
The amount IFN-γ, IL-17, IL-4 and IL-10 was measured in the supernatant after stimulation with PMA/Ionomycin and/or anti-CD3/CD28 (Supplementary Table). All the clones produced IFN-γ, and most clones also produced detectable amounts of the other cytokines. The amount of cytokines produced by the different clones varied considerably. There was also a tendency that clones from the same patient had a similar cytokine profile. Clones derived from patients IBD18 and IBD58 produced relatively more IL-17 and less IL-10 and IL-4 compared to clones derived from IBD55 and IBD56. We have previously demonstrated that the production of IFN-γ, IL-17 and particularly IL-10 can be significantly altered depending on the stimulation method [Citation16]. To assess the ability of T cell clones to produce the various cytokines, PMA/Ionomycin should be used for induction of IL-17 and IFN-γ while anti-CD3/CD28 stimulation should be used for IL-10. By applying this principle, we noted that most of the clones produced large amounts of either IL-10 or IL-17 together with IFN-γ (, Supplementary Table). IL-4 production was generally low. The clones were also were tested for expression of the Th17 markers CD161 and CCR6 together with the gut-homing marker integrin β7 (, Supplementary Table). All the clones that produced more than 500 pg/ml of IL-17 expressed CCR6, and all but one expressed CD161. Different combinations of combination of CD161 and CCR6 expression were noted in the low to intermediate IL-17 producers. All the clones expressed β7.
Figure 2. Cytokine secretion in CD4 T cell clones. Production of IFN-γ, IL-10, IL-17 and IL-4 by CD4 T cell clones (n = 20) from two different patients after stimulation with and anti-CD3/anti CD28 beads for IL-10 and IL-4, and PMA/Ionomycin for IL-17 and IFN-γ. The cells were stimulated in duplicates for 24 h. The cytokine production in the supernatant was measured in the Bio-Plex™ assay.
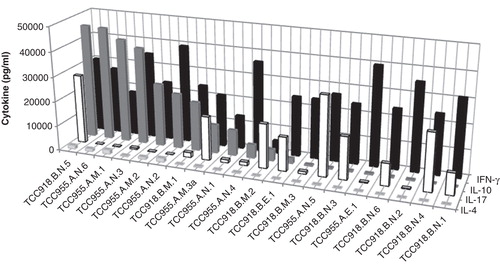
Figure 3. Expression of surface markers in a Th1 clone (left panel) and a Th17/Th1 clone (right panel). The clones were stained with anti-CD4 and then mixed with unstained PBMC to be used as an internal control. The mix was subsequently stained with antibodies against the surface markers β7 integrin, CCR6 and CD161 and analysed by flow cytometry. The negative population of the PBMC for the respective markers were used as an internal control (open histograms) while gating on the CD4+ T cells gave the expression of the various surface markers on the tested clone (grey histograms). Left panels depicts TCC955.M.1 and the right panel TCC958.B.M.1.
Discussion
Accumulating evidence suggest that bacteria are implicated in the pathogenesis of CD and UC. Particularly the results obtained from non-assumption driven GWAS indicate that the host's mucosal immune response to microbes is involved in disease development [Citation1,17], and the genetic data has further raised increased suspicion that mycobacteria might be implicated [Citation1]. The CD lesions are characterized by increased numbers of T cells producing the pro-inflammatory cytokines IL-17 and IFN-γ, but the specificities of these T cells are largely unknown. In this study, we demonstrated that clonal expansion of mycobacteria reactive T cells had likely occurred in vivo in that a high frequency of CD4+ T cells were present in intestinal biopsies from CD patients. Furthermore these T cells produced IL-17 and/or IFN-γ.
The frequencies of mycobacteria reactive T cells in CD patients ranged from 0.17% to 1.63%, while the responses to E. coli were lower. Previous studies have reported similar results at the active site for other diseases where the etiologic agent is known. In bronchio-alveolar lavage from individuals with active tuberculosis a mean frequency of reactive CD4+ T cells to the immunogenic RD1 antigens of 1.49% were found [Citation18], and a study on Lyme arthritis demonstrated a frequency of 0–3.1% of T cells specific for a sequence of Borrelia burgdorferi in synovial fluid [Citation19]. Moreover, data from our laboratory found comparable numbers (0.52–1.82%) of gluten responsive CD4+ T cells in celiac disease patients using the same methodology as in this study [Citation20]. In comparison, the numbers of naïve T cells reacting to any complex antigen preparation, including M. tuberculosis, was shown to be within the range of 0.0005–0.017% [Citation15]. Our data thus suggest that clonal expansion of mycobacteria reactive T cells and to lesser extent E. coli reactive T cells had occurred in vivo.
The high numbers of mycobacteria reactive T cells particularly in CD patients suggest that an adaptive immune response to mycobacteria were present. This may be surprising since mycobacteria, although increased in CD, is not present in large numbers [Citation21,22]. An abundance of bacteria is, however, not a pre-requisite for induction of inflammatory responses. This is exemplified in Mycobacterium leprae infections which are classified as paucibacillary or multibacillary [Citation23]. According to the WHO definition, patients with paucibacillary leprosy are smear-negative at all sites (http://www.who.int/lep/classification/en/index.html), and the diagnosis is based on histopathology and clinical signs. Common complications during infection are leprosy reactions characterized by excessive inflammation, which is treated with long-term prednisolone [Citation24]. Leprosy is thus an infection that can present itself as an excessive inflammatory condition together with minimal numbers of bacteria. This is relevant when addressing the question of the role of the microbiome in CD. We noted an increased frequency of T cells reactive to mycobacteria compared to E. coli in CD patients, despite the higher number of E. coli present in the gut.
Most of the genes associated with IBD are considered to be part of the inflammatory or innate immune responses. Nevertheless an increased numbers of T cells in CD lesions suggest a role for these cells, and a recent study identified Th17 and Th1 cells as the pathogenic cell-type in CD [Citation25]. All the T cell clones in this study produced IFN-γ, and several clones also produced IL-17, which is in accordance with previous studies [Citation26]. Interestingly, many of these clones were also able to produce the anti-inflammatory cytokine IL-10. IL-10 production by conventional Th1 cells has been described in several chronic infections like leishmaniasis, tuberculosis and toxoplasmosis [Citation27–29], and such cells were also present in synovial tissue of patients with rheumatoid arthritis [Citation30]. It has been suggested that the ability of Th1 cells to regulate their own production of pro-inflammatory cytokines is important to limit immunopathology [Citation28,29]. The role of these cells in inflammatory disorders is unclear, but GWAS studies and network analyses have demonstrated that pathways regulating IL-17 and IL-10 production are associated with CD [Citation1].
Altogether, the genetic data suggest that our finding of high frequencies of mycobacteria reactive T cells present particularly in CD patients, is relevant for disease development. If one regards mycobacteria as one of several bacteria able to induce inflammation in susceptible individuals, these results fit well with the hypothesis of a dysregulated immune response to intestinal bacteria in IBD. The relative importance of mycobacteria in cohorts of patients is unknown, and more studies on the T cell specificity can address the relevance of various bacteria in this disease. Finally, patients with a strong T cell response to mycobacteria may benefit from a treatment strategy similar to what is used for leprosy reactions; anti-mycobacterial therapy together with immunosuppressive drugs.
Supplementary Figure 1
Download MS Word (335.5 KB)Acknowledgement
We thank the patients donating biological material, and Tore Jensen and Anne Kari Tveter for the HLA-typing. Funding: The Broad Medical Research Program of The Broad Foundation [grant number IBD-0263R]. The Research Council of Norway (to L.M.S.) South-Eastern Norway Regional Health Authority (to K.E.L). The funders had no role in study design, data collection and analysis, decision to publish, or preparation of the manuscript.
Declaration of interest: The authors report no conflicts of interest. The authors alone are responsible for the content and writing of the paper.
References
- Jostins L, Ripke S, Weersma RK, Duerr RH, McGovern DP, Hui KY, et al. Host-microbe interactions have shaped the genetic architecture of inflammatory bowel disease. Nature 2012;491:119–24.
- Zhang F, Liu H, Chen S, Low H, Sun L, Cui Y, et al. Identification of two new loci at IL23R and RAB32 that influence susceptibility to leprosy. Nat Genet 2011;43:1247–51.
- Saleh M, Elson CO. Experimental inflammatory bowel disease: insights into the host-microbiota dialog. Immunity 2011;34:293–302.
- Khan KJ, Ullman TA, Ford AC, Abreu MT, Abadir A, Marshall JK, et al. Antibiotic therapy in inflammatory bowel disease: a systematic review and meta-analysis. Am J Gastroenterol 2011;106:661–73.
- Janowitz HD, Croen EC, Sachar DB. The role of the fecal stream in Crohn's disease: an historical and analytic review. Inflamm Bowel Dis 1998;4:29–39.
- Ogura Y, Bonen DK, Inohara N, Nicolae DL, Chen FF, Ramos R, et al. A frameshift mutation in NOD2 associated with susceptibility to Crohn's disease. Nature 2001;411:603–6.
- Hugot JP, Chamaillard M, Zouali H, Lesage S, Cezard JP, Belaiche J, et al. Association of NOD2 leucine-rich repeat variants with susceptibility to Crohn's disease. Nature 2001;411:599–603.
- Hampe J, Franke A, Rosenstiel P, Till A, Teuber M, Huse K, et al. A genome-wide association scan of nonsynonymous SNPs identifies a susceptibility variant for Crohn disease in ATG16L1. Nat Genet 2007;39:207–11.
- Frank DN, St Amand AL, Feldman RA, Boedeker EC, Harpaz N, Pace NR. Molecular-phylogenetic characterization of microbial community imbalances in human inflammatory bowel diseases. Proc Natl Acad Sci U S A 2007;104:13780–5.
- Willing BP, Dicksved J, Halfvarson J, Andersson AF, Lucio M, Zheng Z, et al. A pyrosequencing study in twins shows that gastrointestinal microbial profiles vary with inflammatory bowel disease phenotypes. Gastroenterology 2010;139:1844–54.
- Gophna U, Sommerfeld K, Gophna S, Doolittle WF, Veldhuyzen van Zanten SJ. Differences between tissue-associated intestinal microfloras of patients with Crohn's disease and ulcerative colitis. J Clin Microbiol 2006;44:4136–41.
- Walker AW, Sanderson JD, Churcher C, Parkes GC, Hudspith BN, Rayment N, et al. High-throughput clone library analysis of the mucosa-associated microbiota reveals dysbiosis and differences between inflamed and non-inflamed regions of the intestine in inflammatory bowel disease. BMC Microbiol 2011;11:7.
- Olsen I, Tollefsen S, Aagaard C, Reitan LJ, Bannantine JP, Andersen P, et al. Isolation of Mycobacterium avium subspecies paratuberculosis reactive CD4 T cells from intestinal biopsies of Crohn's disease patients. PLoS One 2009;4:e5641.
- Ricanek P, Lothe SM, Szpinda I, Jorde AT, Brackmann S, Perminow G, et al. Paucity of mycobacteria in mucosal bowel biopsies from adults and children with early inflammatory bowel disease. J Crohns Colitis 2010;4:561–6.
- Geiger R, Duhen T, Lanzavecchia A, Sallusto F. Human naive and memory CD4+ T cell repertoires specific for naturally processed antigens analyzed using libraries of amplified T cells. J Exp Med 2009;206:1525–34.
- Olsen I, Sollid LM. Pitfalls in determining the cytokine profile of human T cells. J Immunol Methods 2013;390:106–12.
- Barrett JC, Hansoul S, Nicolae DL, Cho JH, Duerr RH, Rioux JD, et al. Genome-wide association defines more than 30 distinct susceptibility loci for Crohn's disease. Nat Genet 2008;40:955–62.
- Chiacchio T, Petruccioli E, Vanini V, Butera O, Cuzzi G, Petrone L, et al. Higher frequency of T-cell response to M. tuberculosis latency antigen Rv2628 at the site of active tuberculosis disease than in peripheral blood. PLoS One 2011;6:e27539.
- Meyer AL, Trollmo C, Crawford F, Marrack P, Steere AC, Huber BT, et al. Direct enumeration of Borrelia-reactive CD4 T cells ex vivo by using MHC class II tetramers. Proc Natl Acad Sci U S A 2000;97:11433–8.
- Bodd M, Raki M, Bergseng E, Jahnsen J, Lundin KE, Sollid LM. Direct cloning and tetramer staining to measure the frequency of intestinal gluten-reactive T cells in celiac disease. Eur J Immunol 2013. doi: 10.1002/eji.201343382.
- Abubakar I, Myhill D, Aliyu SH, Hunter PR. Detection of Mycobacterium avium subspecies paratuberculosis from patients with Crohn's disease using nucleic acid-based techniques: a systematic review and meta-analysis. Inflamm Bowel Dis 2008;14:401–10.
- Jeyanathan M, Boutros-Tadros O, Radhi J, Semret M, Bitton A, Behr MA. Visualization of Mycobacterium avium in Crohn's tissue by oil-immersion microscopy. Microbes Infect 2007;9:1567–73.
- Ridley DS, Jopling WH. Classification of leprosy according to immunity. A five-group system. Int J Lepr Other Mycobact Dis 1966;34:255–73.
- Scollard DM, Adams LB, Gillis TP, Krahenbuhl JL, Truman RW, Williams DL. The continuing challenges of leprosy. Clin Microbiol Rev 2006;19:338–81.
- Maurano MT, Humbert R, Rynes E, Thurman RE, Haugen E, Wang H, et al. Systematic localization of common disease-associated variation in regulatory DNA. Science 2012;337:1190–5.
- Annunziato F, Cosmi L, Santarlasci V, Maggi L, Liotta F, Mazzinghi B, et al. Phenotypic and functional features of human Th17 cells. J Exp Med 2007;204:1849–61.
- Gerosa F, Nisii C, Righetti S, Micciolo R, Marchesini M, Cazzadori A, et al. CD4(+) T cell clones producing both interferon-gamma and interleukin-10 predominate in bronchoalveolar lavages of active pulmonary tuberculosis patients. Clin Immunol 1999;92:224–34.
- Jankovic D, Kullberg MC, Feng CG, Goldszmid RS, Collazo CM, Wilson M, et al. Conventional T-bet(+)Foxp3(-) Th1 cells are the major source of host-protective regulatory IL-10 during intracellular protozoan infection. J Exp Med 2007;204:273–83.
- Anderson CF, Oukka M, Kuchroo VJ, Sacks D. CD4(+)CD25(-)Foxp3(-) Th1 cells are the source of IL-10-mediated immune suppression in chronic cutaneous leishmaniasis. J Exp Med 2007;204:285–97.
- Morita Y, Yamamura M, Kawashima M, Harada S, Tsuji K, Shibuya K, et al. Flow cytometric single-cell analysis of cytokine production by CD4+ T cells in synovial tissue and peripheral blood from patients with rheumatoid arthritis. Arthritis Rheum 1998;41:1669–76.