
Abstract
Disrupted synchronized oscillatory firing of pyramidal neuronal networks in the cerebral cortex in the gamma frequency band (i.e., 30–100 Hz) mediates many of the cognitive deficits and symptoms of schizophrenia. In fact, the density of dendritic spines and the average somal area of pyramidal neurons in layer 3 of the cerebral cortex, which mediate both long-range (associational) and local (intrinsic) corticocortical connections, are decreased in subjects with this illness. To explore the molecular pathophysiology of pyramidal neuronal dysfunction, we extracted ribonucleic acid (RNA) from laser-captured pyramidal neurons from layer 3 of Brodmann's area 42 of the superior temporal gyrus (STG) from postmortem brains from schizophrenia and normal control subjects. We then profiled the messenger RNA (mRNA) expression of these neurons, using microarray technology. We identified 1331 mRNAs that were differentially expressed in schizophrenia, including genes that belong to the transforming growth factor beta (TGF-β) and the bone morphogenetic proteins (BMPs) signaling pathways. Disturbances of these signaling mechanisms may in part contribute to the altered expression of other genes found to be differentially expressed in this study, such as those that regulate extracellular matrix (ECM), apoptosis, and cytoskeletal and synaptic plasticity. In addition, we identified 10 microRNAs (miRNAs) that were differentially expressed in schizophrenia; enrichment analysis of their predicted gene targets revealed signaling pathways and gene networks that were found by microarray to be dysregulated, raising an interesting possibility that dysfunction of pyramidal neurons in schizophrenia may in part be mediated by a concerted dysregulation of gene network functions as a result of the altered expression of a relatively small number of miRNAs. Taken together, findings of this study provide a neurobiological framework within which specific hypotheses about the molecular mechanisms of pyramidal cell dysfunction in schizophrenia can be formulated.
INTRODUCTION
Gray matter volume in the cerebral cortex has been consistently found to be decreased in patients with schizophrenia (CitationAnanth et al., 2002; CitationWilke et al., 2001). The superior temporal gyrus (STG) is one of the cortical regions that exhibit the most pronounced volumetric reduction (CitationMcCarley et al., 1999; CitationYamasue et al., 2004). This reduction is thought to reflect a decrease in the number of synapses (CitationSelemon & Goldman-Rakic, 1999), the majority of which appear to be located on the dendritic spines of pyramidal neurons (CitationGlantz & Lewis, 2000; CitationSweet et al., 2009).
Pyramidal neurons in the cerebral cortex exhibit layer-specific connectional properties, providing neural circuit architectures that support distinct aspects of higher cortical functions. For instance, dendritic spines on pyramidal neurons in layer 3 are targeted by both local and long-range glutamatergic projections in a highly reciprocal fashion. Synchronized activities of pyramidal neuronal networks through these connections, especially in the gamma frequency band (i.e., 30–100 Hz), are critical for the integrity of higher cortical functions (CitationBuzsaki & Draguhn, 2004). Disturbances of these networks may contribute to the pathophysiology of schizophrenia by compromising gamma oscillation (CitationArnsten et al., 2010; CitationLewis & Gonzalez-Burgos, 2008; CitationUhlhaas & Singer, 2010). This concept is supported by the following postmortem and clinical observations. First, the density of dendritic spines on pyramidal neurons in layer 3 of the cerebral cortex, including the STG, have been shown to be decreased by 23–66% in subjects with schizophrenia (CitationCosta et al., 2001; CitationGarey et al., 1998; CitationGlantz & Lewis, 2000; CitationSweet et al., 2009). Second, consistent with these findings, the average somal area of these pyramidal cells is significantly smaller (CitationSweet et al., 2003, Citation2004). Third, in the prefrontal cortex, the density of glutamatergic axonal boutons, of which dendritic spines are their major targets, was significantly decreased by as much as 79% in layer 3 (but not in layer 5) in subjects with schizophrenia (CitationBitanihirwe et al., 2009). Finally, an increasing number of clinical studies have consistently demonstrated that gamma oscillatory synchrony is impaired in patients with schizophrenia (CitationCho et al., 2006; CitationKwon et al., 1999; CitationSpencer et al., 2004; CitationUhlhaas & Singer, 2010). Furthermore, gamma impairment has been linked to the symptoms and cognitive deficits of the illness, and their severity has in turn been associated with the magnitude of cortical gray matter reduction (CitationCascella et al., 2010; CitationGur et al., 1999, Citation2000; CitationMitelman et al., 2003; CitationSuga et al., 2010). Taken together, understanding the molecular underpinnings of pyramidal cell functional impairment will shed important light onto the pathophysiology and thereby the conceptualization of novel and rational treatment of cortical dysfunction in schizophrenia.
In order to identify the molecular correlates of pyramidal cell dysfunction in schizophrenia, we combined laser-capture microdissection (LCM) with Affymetrix microarray and high-throughput TaqMan-based MegaPlex quantitative reverse transcriptase–polymerase chain reaction (qRT-PCR), respectively, to elucidate the alterations in messenger RNA (mRNA) and microRNA (miRNA) expression profiles of these neurons in layer 3 of the STG. We found that transforming growth factor beta (TGF-β) and bone morphogenetic protein (BMP) signaling pathways and many genes that regulate extracellular matrix (ECM), apoptosis and cytoskeleton were dysregulated in schizophrenia. In addition, we identified 10 differentially expressed miRNAs; the predicted targets of which included the dysregulated pathways and gene networks identified by microarray analysis. Together these findings provide a conceptual framework within which we can begin to formulate and test specific hypotheses of the neurobiological mechanisms that underlie pyramidal cell dysfunction in schizophrenia.
MATERIALS AND METHODS
Postmortem Human Brain Tissue
Liquid nitrogen vapor fresh-frozen blocks, approximately 3 mm thick and containing the STG (Brodmann's area 42), matched for age, sex, pH, and postmortem interval (PMI) (), were obtained from the Harvard Brain Tissue Resource Center (HBTRC) at McLean Hospital, Belmont, Massachusetts. Postmortem human brain collection procedures of the HBTRC, including the informed consent process, have been approved by the Partners Human Research Committee. Written informed consent for use of each of the brains for research has been obtained by the legal next of kin. All of the brains included in this study were examined by a Board-certified neuropathologist to rule out any neurological disorders. In addition, the fact that none of the subjects had any active history of substance abuse or dependence was confirmed by toxicological analysis. A detailed methodology for tissue preparation, LCM and RNA processing has been described in detail elsewhere (CitationPietersen et al., 2009, Citation2011).
Table 1. Subjects included in this study.
LCM
Sections of 8 μm were cut on a cryostat, mounted on slides and stored at − 80°C until use. Pyramidal neurons were stained with the Histogene quick staining kit (Applied Biosystems, Foster City, CA) and identified based on the pyramidal morphology and the clearly identifiable proximal apical and basal dendrites (). In addition, pyramidal neurons that were in close proximity to any nonpyramidal cells were excluded in order to avoid cellular contamination. Pyramidal neurons were removed using the Arcturus XT system (Applied Biosystems). Approximately 500 neurons per subject were captured onto a CapSure HS LCM cap (Applied Biosystems) for the microarray experiment whereas approximately 100 cells were captured for miRNA profiling. To avoid systematic biases, samples from schizophrenia and normal control subjects were processed for LCM in a random order.
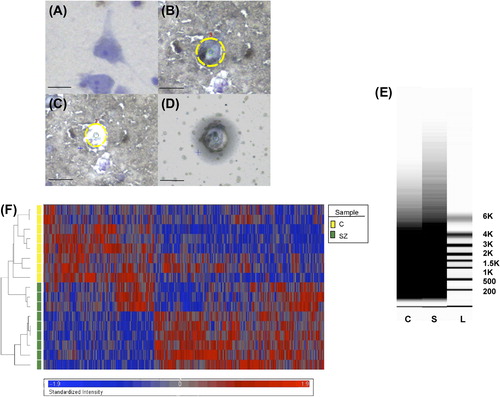
Figure 1. Identification of pyramidal neurons and LCM procedure. Photomicrograph of a pyramidal neuron in the STG visualized with Histogene stain (A). After identification (B), pyramidal neurons are captured (C) onto the LCM cap (D). (E) Representative virtual gels showing the distribution of sizes of amplified products after two rounds of linear amplification of RNA extracted from ˜500 pyramidal neurons from a normal control (C) and a schizophrenia (S) subject. L = ladder. (F) Heatmap of 1331 differentially expressed genes identified based on the stringency criteria of fold-change > 1.1 and FDR-corrected p < 0.05. Scale bars = 25 μm.
Affymetrix Platform–Based Microarray Gene Expression Profiling
RNA Processing
RNA isolation was performed using the Picopure RNA isolation kit (Life Technologies, Grand Island, NY), with a DNase step (Qiagen, Valencia, CA). This typically resulted in approximately 1–25 ng of total RNA () (CitationPietersen et al., 2009, Citation2011). Total RNA integrity was evaluated by RNA Quality Indicator (RQI) generated by the Experion HighSens LabChip (Bio-Rad, Hercules, CA), although in a minority of cases the amount of total RNA was too small for this analysis ().
Table 2. RNA quantity and quality.
RNA extracted from laser-captured neurons underwent two rounds of linear amplification using the RiboAmp kit (Life Technologies) to obtain amplified (a)RNA. A dilution of the resulting products (approximately 250 ng/μL) was used to determine the distribution of transcript lengths with the Experion StdSens Labchip (Bio-Rad; ). The concentration and purity of these samples were determined by absorbance measurements at the optical density of A260 and A280, using a NanoDrop spectrophotometer (Thermo Scientific, Tewksbury, MA) ().
Microarray and qRT-PCR Validation
The TURBO Biotin labeling kit (end-labeling; Life Technologies) was used to label the aRNA obtained from amplified samples (˜15 μg). Gene expression profiling was performed using the Affymetrix Human X3P GeneChip®, which possesses an extreme 3’ bias in its probe design and hence is particularly suitable for samples that are prone to RNA degradation, such as postmortem human brain tissue. This chip has also been shown to be superior to the more commonly used Affymetrix human U133 plus 2.0 chip in terms of data reproducibility (CitationCaretti et al., 2008). The hybridization and scanning procedures were performed at the Partners HealthCare Center for Personalized Genetic Medicine, Cambridge, Massachusetts. Briefly, target labeling was performed using the Message-AMP Biotin Enhanced Kit (Life Technologies). Fifteen micrograms of biotinylated RNA was fragmented, hybridized to GeneChips, stained with two rounds of streptavidinphycoerythrin (Molecular Probes, Eugene, OR) and one round of biotinylated antistreptavidin antibody (Vector Laboratories, Burlingame, CA), scanned twice, and inspected for hybridization artifacts before proceeding to data normalization and analysis.
For validation of microarray data, cDNA was reverse transcribed from aRNA (200 ng input) using the High Capacity RNA-to-cDNA kit (Applied Biosystems). TaqMan®-based qRT-PCR (Applied Biosystems) was subsequently performed on selected differentially expressed genes within signaling pathways identified by pathway analysis as dysregulated in schizophrenia and several randomly chosen genes (Supplementary Table 1; available online at http://informahealthcare.com/doi/abs/10.3109/01677063.2014.882918). Samples were normalized with respect to the housekeeping gene, hypoxanthine guanine phosphoribosyltransferase (HPRT), which has been shown to produce reliable results in human brain tissue as its expression does not appear to differ in disease states (CitationRadonic et al., 2004). Normalization was performed against only one gene because of the limited quantity of RNA available from laser-captured samples. Negative controls (negative reverse transcription and no template controls) were performed to detect any contamination of the samples, such as genomic (g)DNA. Where necessary, samples were treated with Turbo DNA-free kit (Applied Biosystems) and the negative controls repeated to confirm gDNA removal before qRT-PCR was performed. Samples were run in duplicate. If the difference between the duplicates exceeded 0.5 Ct (threshold cycle), the samples were repeated. The average of the duplicates was taken as input for quantification using the 2−ΔCt method (CitationLivak & Schmittgen, 2001) or the relative expression software tool (REST) for group-wise comparisons of expression ratios (CitationPfaffl et al., 2002). A Spearman's rho correlation analysis was then performed on the fold-changes determined by microarray and qRT-PCR. In accordance with CitationMorey et al. (2006), a correlation of > 0.8 with a significance of p < 0.05 between qRT-PCR and microarray expression changes was considered validation of the microarray result.
miRNA Profiling Using Megaplex miRNA TaqMan Arrays
Total RNA was extracted from ˜100 laser-captured cells with the mirVana miRNA Detection Kit (Life Technologies). This typically resulted in approximately 4–7 ng of total RNA (). The concentration and purity of the total RNA were determined by a NanoDrop spectrophotometer, as described above. miRNA profiling was conducted according to manufacturer's specifications (Supplementary Methods 1 available online at http://informahealthcare.com/doi/abs/10.3109/01677063.2014.882918).
Data Analysis
Microarray Data Analysis
Each array was scanned twice and the Affymetrix Microarray Suite 5.1 software averaged the two images to compute an intensity value for each probe cell within each probe set. For the quality control step, we employed the dChip and Partek software's built-in function (Partek, St. Louis, MO). We then normalized the data with Partek's standard normalization method (i.e., data have a mean of 0 and a variance of 1, and each column for each sample was divided by the average of all control samples). Principal component analysis revealed the contribution of batch effect (i.e., scan date), but not sex, age, PMI, or antipsychotic treatment, to the observed expression variance. As such, an analysis of covariance (ANCOVA) was performed with batch effect as covariate (CitationSimunovic et al., 2009). Differentially expressed genes were visualized by performing unsupervised hierarchical clustering as stringency of the filtering criteria (i.e., fold-change and false discovery rate [FDR]-adjusted p-value) was varied to determine a representative gene list for pathway analyses.
We employed three approaches to explore the biological significance of our expression data. First, differentially expressed genes were manually grouped to elucidate gene families that were dysregulated in schizophrenia. Second, pathway analyses were performed with two Web-based algorithms, Ingenuity Pathway Analysis (Ingenuity Systems, Redwood City, CA) and MetaCore (GeneGo, Carsbad, CA), to map the differentially expressed genes onto biological functions and canonical pathways. With Ingenuity, the significance for each of the identified pathways was determined via a Fisher's exact test, whereas GeneGo Metacore makes use of their algorithm for hypergeometric distribution, identifying pathways overrepresented with significant genes. Third, literature mining was performed to elucidate which of these pathways or gene families might be particularly pertinent for pyramidal neuronal functions and dendritic/synaptic architecture and plasticity. We also made note of differentially expressed genes that have been implicated as schizophrenia risk genes (CitationAllen et al., 2008). Microarray data have been deposited into the Gene Expression Omnibus (GEO; http://www.ncbi.nlm.nih.gov/projects/geo/; accession number GSE37981).
miRNA Data Analysis
Primary analysis of the acquired signal data was performed in SDS and RQ Manager (Applied Biosystems). Quality control and differential expression analyses were performed using the qRT-PCR package for miRNA arrays (Applied Biosystems) in Bioconductor (www.bioconductor.org). The databases used to identify potential miRNA targets for specific miRNAs are summarized in Supplementary Methods 2 available online at http://informahealthcare.com/doi/abs/10.3109/01677063.2014.882918. Significant enrichment of specific Gene Ontology categories or KEGG (Kyoto Encyclopedia of Genes) pathways was estimated by hypergeometric tests or chi-square tests. Enriched pathways overrepresented by potential miRNA target genes were then determined with the p-value obtained by hypergeometric tests and adjusted for multiple comparisons (CitationKanehisa & Goto, 2000; CitationKanehisa et al., 2006, Citation2010).
RESULTS
Affymetrix-Based Microarray Gene Expression Profiling
We evaluated the reliability of our findings by assessing mRNA quality based on a combination of metrics, as there is not a single parameter that can serve as the sole determinant or predictor of mRNA quality. Although the quality of the total RNA extracted from homogenized cortex from all of the subjects used in this study appears to be superb (), the RQI of most samples on average tended to be relatively low, suggesting some RNA degradation. This was expected given the significantly lengthier (i.e., compared with extracting RNA from homogenized tissue) aqueous steps required for RNA extraction from single neurons (CitationPietersen et al., 2009, Citation2011). However, although RQI is a measure of total RNA integrity, it does not necessarily predict the quality of mRNA, which constitutes only 1–3% of total RNA (CitationVermeulen et al., 2011). In fact, virtual gels of the amplified products generated after two rounds of linear amplification of RNA extracted from pyramidal neurons revealed very healthy spreads of transcript lengths, extending well into the 5–6 kb range (). Furthermore, the efficiency of microarray hybridization appeared to be adequate in terms of probe intensity and percentage of present calls, and these parameters were highly comparable between the schizophrenia and control groups, with average (± SD) probe intensity being 81.8 ± 10.5 and 70.7 ± 6.2, respectively, and percent present calls 26.9 ± 2.6 and 27.5 ± 1.0, respectively. Overall, these percentages of present calls are lower than what have been reported in previously published schizophrenia microarray studies performed on RNA extracted from homogenized cortical gray matter (typically in the range of 40–45%), which contains a much greater number of RNA species in much larger quantities. Our data, however, are similar in magnitude to what was reported in a recent microarray study of laser-dissected hippocampal subfields in humans (mean ± SD = 31.8 ± 4.9) (CitationBenes et al., 2008), a region that is cellularly much less heterogeneous than cortical gray matter but more so than our neuronal samples, and to what was described in previous microarray studies based on laser-captured cells from clinical samples or other specimens of single cells (CitationLuzzi et al., 2001; CitationMahadevappa & Warrington, 1999).
Varying the stringency criteria of fold-change and FDR-adjusted p-value resulted in several lists of differentially expressed genes (Supplementary Table 2 available online at http://informahealthcare.com/doi/abs/10.3109/01677063.2014.882918). For instance, 1331 genes were identified based on the criteria of a minimal fold-change of 1.1 and p < 0.05, whereas only 264 genes met the slightly more stringent criteria of fold-change of 1.2 and p < 0.05. As a result, the 1331 genes were used for downstream pathway analysis. Hierarchical clustering revealed that these 1331 genes appeared to be well segregated according to diagnosis (). A complete list of these genes is shown in Supplementary Table 3 available online at http://informahealthcare.com/doi/abs/10.3109/01677063. 2014.882918. The canonical pathways and functional gene networks that were found to be altered in schizophrenia included the TGF-β/BMP signaling cascades, genes that regulate cytoskeleton and dendritic morphology and ECM composition, in addition to changes in apoptosis and DNA damage canonical pathways (Tables 3a–d). A number of key genes within the pathways that were found to be significantly differentially regulated in schizophrenia (N = 6) and several randomly selected genes (N = 4) were quantified by qRT-PCR; the expression levels of these genes were significantly correlated with the microarray data (p = 0.003; ). HPRT expression level also did not differ between schizophrenia and normal control groups (Supplementary Figure 1 available online at http://informahealthcare.com/doi/abs/10.3109/01677063.2014.882918). Finally, correlation analyses between the expression of the validated genes and age, PMI, and chlorpromazine equivalent dosage (CED) revealed no association of gene expression changes with any of these parameters, consistent with PCA results showing that none of these parameters appear to significantly contribute to differential gene expression variance of the entire data set. A representative correlation with SMAD4 (signal via the mothers against decapentaplegic homologs 4), the key transcription factor upon which TGF-β and BMP signaling cascades converge, is depicted in Supplementary Figure 2 available online at http://informahealthcare.com/doi/abs/10.3109/01677063.2014.882918.
Figure 2. Correlation analysis comparing fold-changes of selected genes determined by microarray and qRT-PCR. Comparison of fold-changes of differentially expressed genes within signaling pathways identified as dysregulated in schizophrenia (N = 6) and several randomly selected genes (N = 4) determined by microarray and qRT-PCR. BMP7 = bone morphogenetic protein 7; BMPR1A = bone morphogenetic protein receptor type IA; CLU = clusterin; HLA-A = major histocompatibility complex (MHC), class I, A; HPRT = hypoxanthine guanine phosphoribosyl transferase; P2RY14 = purinergic receptor P2Y, G-protein coupled, 14; MCPH1 = microcephalin 1; SMAD4 = mothers against decapentaplegic homolog 4; SMAD5 = mothers against decapentaplegic homolog 5; VCAN = versican.
Table 3a. Significantly affected genes within TGF-β/BMP signaling pathway.
Table 3b. Significantly affected genes associated with extracellular matrix.
Table 3c. Significantly affected genes associated with apoptosis and DNA damage.
Table 3d. Significantly affected genes associated with cytoskeletal and dendritic integrity.
TGF-β Superfamily Signaling Is Altered in Schizophrenia
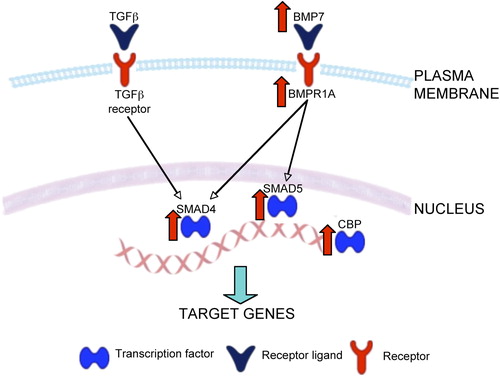
The TGF-β superfamily of proteins consists of over thirty members (CitationDerynck & Miyazono, 2008). Structurally they can be subdivided in three subfamilies: TGF-β, inhibins, and other proteins including BMPs and growth and differentiation factor (GDF). Together these proteins are involved in very diverse and complex cellular functions in both developing and adult systems, including the brain (CitationBenes, 2011; CitationDerynck & Miyazono, 2008; CitationMassague & Gomis, 2006; CitationVivien & Ali, 2006). We found that the TGF-β and BMP signaling canonical pathways were highly dysregulated in schizophrenia (GeneGo: p < 0.0001), with up-regulation of several genes immediately downstream from the TGF-β1 receptor (Supplementary Table 3a, Figure 3 available online at http://informahealthcare. com/doi/abs/10.3109/01677063.2014.882918; ). This is in line with a previous postmortem study revealing an up-regulation of the TGF-β signaling cascade in the hippocampus of schizophrenia subjects (CitationBenes et al., 2007) and is consistent with previous reports showing the involvement of TGF-β signaling in the pathophysiology of schizophrenia in general (CitationMiller et al., 2011). Within the TGF-β superfamily, we found that the canonical BMP signaling pathway was significantly affected (Ingenuity: p < 0.003; GeneGo: p < 0.005) (a). Specifically, we observed an up-regulation of BMP7 and BMP receptor 1A (BMPR1A), in addition to changes in genes further downstream in the signaling cascade ( and Supplementary Figure 3 available online at http://informahealthcare.com/doi/abs/10.3109/01677063.2014.882918). Both the TFG-β and BMP canonical pathways propagate their signal via SMADs (CitationShi & Massague, 2003) ( and Supplementary Figure 3 available online at http://informahealthcare.com/doi/abs/10.3109/ 01677063.2014.882918) and we found that SMAD4 and SMAD5 were up-regulated in schizophrenia. SMAD4 is the central mediator of both of these signal transduction cascades and regulates the transcription of target genes (CitationRoss & Hill, 2008). Furthermore, we observed an increase in the expression of cyclic adenosine monophosphate (cAMP) response element-binding protein (CREB)-binding protein (CBP), a transcription co-activator of SMAD (CitationOhta et al., 2008). Although not part of this particular canonical pathway, we noted a down-regulation of BMP5, which also acts via the BMPR1A (CitationBeck et al., 2001). Of interest, BMP5, BMP7, SMAD5, and CBP were all found to be significantly associated with schizophrenia in a recent genome-wide association study (CitationJia et al., 2010), with both TGFB1 and SMAD5 implicated as potential candidate genes in a linkage study (CitationZaharieva et al., 2008). Finally, these pathways are known to regulate the integrity of ECM (CitationHyytiainen et al., 2004; CitationSmith & Strunz, 2005; CitationZhou et al., 2003), apoptosis (CitationDhandapani & Brann, 2003), and cytoskeleton (CitationGuo et al., 1998; CitationMoustakas & Heldin, 2008), raising the possibility that disturbances of genes that regulate these functions (see below) may in part represent downstream consequences of dysregulated TGF-β/BMP signaling.
Figure 3. Representative diagram of TGF-β and BMP signaling pathways. Both TGF-β and BMP7 activate SMAD4 and CREB-binding protein, a transcription co-activator of SMAD, leading to the transcription of target genes that influence extracellular matrix composition, apoptosis, and synaptic/cytoskeletal plasticity. BMPR1A = bone morphogenetic protein receptor type IA; CBP = CREB-binding protein; SARA (ZFYVE9) = zinc finger, FYVE domain containing 9; SMAD4 = mothers against decapentaplegic homolog 4. Genes up-regulated in schizophrenia are depicted by red arrows.
ECM Regulation Is Altered in Schizophrenia
Gene networks related to ECM functionality, including altered cellular movement (p < 0.03) and changes in adhesion to the fibronectin matrix (p < 0.05), were altered in schizophrenia (b). Specifically, a number of genes coding for chondroitin sulfate proteoglycans (CSPGs) were down-regulated. These include aggrecan, versican, leprecan, lumican, testican, and spondin1. In addition, we found changes in genes that encode matrix metallopeptidases (MMPs), which are enzymes that are involved in the breakdown and remodeling of ECM by the proteolysis of several ECM components, including the CSPGs (CitationRauch, 2004). Specifically, we found an up-regulation of ADAM (a disintegrin and metallopeptidase) metallopeptidase with thrombospondin type 1 motif gene family (ADAMTS1 and ADAMTS6), in addition to alterations in several other MMPs, in the schizophrenia samples (b). Together these data suggest that the decrease in ECM structural components, such as CSPGs, in addition to the alterations in the enzymes that regulate their proteolysis, contribute to the altered integrity of ECM (CitationIkeda et al., 2009; CitationMauney et al., 2013; CitationPantazopoulos et al., 2010).
Apoptosis Regulation Is Altered in Schizophrenia
Two apoptosis canonical pathways were found to be dysregulated in schizophrenia (c). We noted predominantly an up-regulation of genes within the p53-regulated apoptosis pathway (GeneGo: p < 0.03), suggesting pro-apoptotic events (CitationPietsch et al., 2008), although the exact function of sumoylation of p53 remains controversial (CitationMelchior & Hengst, 2002). We also found changes in the expression of several genes associated with oxidative stress and DNA damage (c). Conversely, we saw increased expression of anti-apoptotic genes within the BCL2 (B-cell chronic lymphocytic leukemia [CLL]/lymphoma 2)-associated agonist of cell death (BAD) apoptosis survival pathway (GeneGo: p < 0.03), which inhibits apoptosis through BAD phosphorylation (CitationBergmann, 2002). Interestingly, TGF-β signaling regulates BAD phosphorylation via the induction of anti-apoptotic proteins of the BCL-2 family (E. S. CitationKim et al., 1998). Together these results appear to reflect the complex interplay between the orchestrated molecular responses regulating apoptosis that may in part be mediated by TGF-β signaling.
Cytoskeletal Regulation Is Altered in Schizophrenia
We found significant alterations in key biological functions (Ingenuity) related to the integrity of cytoskeleton. This included the organization of actin cytoskeleton (p < 0.05) and actin filaments (p < 0.05), coalignment of neurofilaments and microfilaments (p < 0.05) and redistribution of F-actin (p < 0.05). We also noted changes in genes encoding cytoskeletal components, such as tubulin and myosin (d). Finally, we observed that the integrin β5 receptor was up-regulated in schizophrenia. Integrin signaling is the major signaling pathway that mediates the interaction between ECM and the assembly of actin filaments that is necessary for cytoskeletal modification (CitationGiancotti & Ruoslahti, 1999; CitationShi & Ethell, 2006; CitationWozniak et al., 2004).
miRNA Profiling by Megaplex miRNA TaqMan Arrays
miRNA expression levels were normalized to the endogenous sno-RNA MammU6, whose levels were unchanged between control and schizophrenia samples for both the Human miRNA A and B Cards (mean ± SEM: 30.63 ± 0.35 and 31.72 ± 0.72, respectively). Out of the 754 miRNAs investigated, analysis of variance (ANOVA) revealed 10 differentially expressed miRNAs (p < 0.05; ). Many of these miRNAs are known to be expressed in the brain (CitationBaskerville & Bartel, 2005; CitationLandgraf et al., 2007), with some identified as being specifically localized in mammalian cortical neurons (e.g., miR-30b and miR-328) (J. CitationKim et al., 2004). A number of the differentially expressed miRNAs also correspond with previous studies on postmortem schizophrenia samples, including miR-150 (J. CitationKim et al., 2004), miR-328 (CitationSantarelli et al., 2011), and miR-30b (CitationMellios et al., 2012; CitationPerkins et al., 2007), with the caveat that all of the previously published miRNA profiling results were based on RNAs extracted from homogenized gray matter. Interestingly, enrichment analysis of the predicted target genes of the differentially expressed miRNAs revealed that the overrepresented signaling pathways included many of the pathways identified by microarray as differentially regulated in schizophrenia, such as TGF-β signaling, ECM composition, apoptosis, and cytoskeleton (, Supplementary Table 3 available online at http://informahealthcare.com/doi/abs/10.3109/01677063.2014.882918). The specific genes that were found by microarray to be differentially expressed in schizophrenia and are also the predicted targets of the differentially expressed miRNAs are shown in Supplementary Table 4 available online at http://informahealthcare.com/doi/abs/10.3109/ 01677063.2014.882918.
Table 4. Differentially expressed miRNAs in schizophrenia.
Table 5. Overrepressented KEGG pathways based on enrichment analysis of the predicted target genes of the differentially expressed miRNAs.
DISCUSSION
In order to understand the pathophysiology of schizophrenia, which is a manifestation of functional disturbances of cortical circuits characterized by neuronal type–dependent connectional complexity, it is necessary to define the molecular pathology of the illness in a neuronal type–specific manner. In this context, previous gene expression profiling studies of the cerebral cortex in schizophrenia have largely relied on the extraction of RNA from homogenized gray matter. Interpretation of these results can be difficult due to the profound cellular heterogeneity of the cerebral cortex, as gene expression changes that may be confined to a subset of neurons can be obscured, especially if transcript abundance is low or if specific transcripts are preferentially localized to cell types that are relatively uncommon. In this study, by combining LCM with mRNA profiling, we circumvented these potential problems and identified molecular cascades that appear to be dysregulated in layer 3 pyramidal neurons in the STG in schizophrenia. Specifically, our data revealed that a number of genes within the TGF-β superfamily, especially those that regulate BMP signaling, were differentially expressed in subjects with schizophrenia. In addition, we identified abnormalities in genes that regulate apoptosis, cytoskeletal plasticity, and ECM, that may, at least in part, represent downstream consequences of TGF-β signaling dysregulation. We should also note that the majority (61%) of these genes, with some exceptions, such as those that regulate ECM, were found to be up-regulated. In contrast, previous studies interrogating the expression of mRNA extracted from homogenized gray matter have revealed an overall decrease in gene expression (CitationIwamoto & Kato, 2006), and, for the most part, these genes do not overlap with genes identified in the present study. These differential findings, in our opinion, highlight the argument that neuronal type– specific gene expression alterations and thus the molecular pathophysiology of the illness in terms of cortical neuronal circuit dysfunction cannot necessarily be inferred from the interrogation of expression of transcripts obtained from homogenized cortical tissue. In more specific quantitative terms, approximately 84% of the volume of the cortex, excluding layer 1, contains glias, neuropil, which comprises axonal elements, dendrites and dendritic spines, and vascular elements such as blood vessels and related cellular components, including endothelial cells and various blood cells (CitationBraitenberg & Schuz, 1998), and the abundance of many transcripts can vary in a compartment-specific manner (CitationCajigas et al., 2012). Of the remaining 16% of the volume that contains neuronal bodies in layers 2–6, approximately 80% of them are pyramidal neurons and roughly 16% (i.e., 80% divided by 5 layers) are from layer 3. In other words, layer 3 pyramidal neurons represent only about 3% (i.e., 16% times 16%) of the entire volume of cortical gray matter. As such, it is difficult to envision that gene expression changes that may be restricted to this neuronal population can be readily discerned by studying RNA obtained from homogenization of the entire gray matter. This would arguably be especially true for the less abundant cell types, such as the various subsets of inhibitory neurons, including those that were examined in the accompanying study, the parvalbumin (PV)-containing neurons (Pietersen et al. 2014).
Methodological Considerations and Limitations
The goal of this study was to delineate the gene expression profile of layer 3 pyramidal neurons in schizophrenia in order to gain insight into the molecular basis of cortical circuit dysfunction. In this context, it should be noted that obtaining RNA from a truly homogeneous source from postmortem human brains, given the technologies that are available at the present time, is probably not achievable. For instance, when capturing pyramidal neurons, it would have been inevitable to include additional elements, such as the perineuronal oligodendrocytes, GABA(γ-aminobutyric acid)ergic axon terminals that innervate the perisomatic region of pyramidal neurons, etc. In fact, we found that the mRNA for the gene that encodes the 65-kDa isoform of the GABA-synthesizing enzyme glutamic acid decarboxylase (GAD2) was significantly down-regulated by 1.9-fold in the schizophrenia subjects (Supplementary Table 3 available online at http://informahealthcare.com/doi/abs/10.3109/01677063. 2014.882918). This is not a type I error, as qRT-PCR confirmed the presence of this transcript in our samples and its down-regulation by 3.1-fold. Because GAD2 is clearly not expressed in pyramidal neurons and because our sampling approach excludes the possibility of systematic inclusion of GABAergic neurons in our samples, the GAD2 mRNA in the samples most likely came from the GABAergic axon terminals innervating the pyramidal cell bodies. However, definitive confirmation of the presence of mRNA in axonal terminals in the human brain would be technically challenging.
Another consideration is that due to the labor- intensive nature of this methodological approach and the associated costs, the sample size of this study is small. This may have increased the likelihood of type II error. Although to a certain extent type I error can be addressed by means of validation (e.g., by qRT-PCR), type II error can only be minimized by increasing sample size. Finally, because the amount of RNA available for each sample was limited, the number of genes we were able to validate by qRT-PCR is small. For the same reason, we only used one housekeeping gene for normalization and samples were run in duplicate instead of triplicate. Because of these limitations and caveats, we consider this study proof-of-principle and our findings preliminary; it would therefore be critical to confirm these findings in a different and ideally larger cohort of subjects in future studies. Ultimately, true validation of microarray observations will have to be achieved by experimentally demonstrating mechanistic links between the disturbances of genes and pathways identified as altered in schizophrenia and known cellular and clinical phenotypes of the illness, such as decreased spine density on pyramidal neurons (CitationGlantz & Lewis, 2000; CitationSweet et al., 2009) or disturbances of ECM integrity (CitationPantazopoulos et al., 2010), and neurocognitive deficits (CitationBarch et al., 2003; CitationBowie & Harvey, 2005; CitationCho et al., 2006) or gamma oscillation disturbances (CitationCho et al., 2006; CitationKwon et al., 1999; CitationSpencer et al., 2004; CitationUhlhaas & Singer, 2010), respectively. In fact, this is exactly how postmortem microarray studies can uniquely contribute to the understanding of the pathophysiology of human psychiatric disorders; that is, they can inspire the conceptualization of novel hypotheses of disease mechanisms that can then be experimentally interrogated either in vitro or in animal systems.
Functional Considerations of Up-regulation of TGF-β and BMP Signaling in Schizophrenia
Apoptosis and Dendritic Atrophy
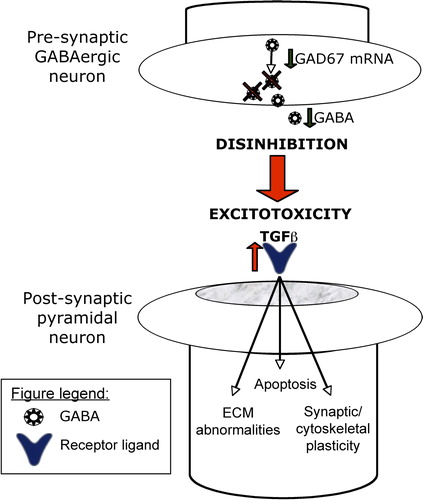
Up-regulation of TGF-β signaling typically represents a homeostatic response under a wide variety of pathological conditions, such as excitotoxicity (CitationChou et al., 2006; CitationDhandapani & Brann, 2003; CitationGabriel et al., 2003; CitationKlempt et al., 1992; CitationPetegnief et al., 2003). In schizophrenia, there has been compelling evidence indicating that the PV-containing fast-spiking inhibitory neurons, which confer perisomatic and axo-axonic inhibition to pyramidal neurons, are functionally disturbed (CitationLewis et al., 2005). Specifically, inhibition furnished by these neurons may be deficient, as the mRNA for the 67-kDa isoform of the GABA-synthesizing enzyme (GAD1) appears to be undetectable in close to half of the populations of PV neurons in schizophrenia (CitationHashimoto et al., 2003). In addition, the expression of the N-methyl-d-aspartate (NMDA) glutamate receptor NR2A subunit mRNA in some of these neurons has also been shown to be significantly decreased (CitationBitanihirwe et al., 2009), suggesting that excitatory inputs to PV neurons may also be impaired. Together these findings support the idea that pyramidal neurons that are postsynaptic to PV neurons may become hyperactive as a result of disinhibition of PV neurons (CitationHomayoun & Moghaddam, 2007; CitationKinney et al., 2006; CitationOlney & Farber, 1995). In this context, the observed up-regulation of TGF-β signaling may represent a homeostatic or neuroprotective response of pyramidal neurons to such excitotoxic insult () (CitationGabriel et al., 2003; CitationPetegnief et al., 2003). One mechanism that TGF-β signaling could exert homeostatic effects is through the regulation of BAD phosphorylation pathway via the induction of anti-apoptotic proteins of the BCL-2 family (E. S. CitationKim et al., 1998; CitationPrehn et al., 1994). In line with other postmortem studies indicating increased expression of anti-apoptotic genes in schizophrenia, such as BCL-2 (CitationBenes, 2006; CitationBenes et al., 2006), we also noted in our study an up-regulation of several genes within this pathway. Conversely, although we found an up-regulation of several pro-apoptotic genes within the p53-regulated pro-apoptosis pathway, e.g., SUMO-1 (small ubiquitin related modifier precursor), UBA1 (ubiquitin-like modifier activating enzyme 1), and CBP, expression of TP53, which encodes p53, the key initiator of apoptosis, was unaltered.
Figure 4. Hypothetical model of pyramidal cell dysfunction in schizophrenia. It is hypothesized that as a result of disinhibition-induced excitotoxic insult (see text for details), TGFβ signaling within pyramidal neurons is up-regulated, which may contribute to extracellular matrix abnormalities, dysregulated apoptosis, and impaired synaptic and cytoskeletal plasticity. Shown in this highly simplified diagram are some of the hub genes that can be targeted in future experiments in the testing of this hypothesis.
Although large-scale pyramidal cell death does not occur in schizophrenia, “nonlethal” apoptosis can lead to neuronal injury in the form of dendritic atrophy (CitationGlantz et al., 2006). For example, chronic glutamate excess has been shown to lead to a 20% reduction in primary dendritic length without causing cell death (CitationEsquenazi et al., 2002). The integrity of dendritic architecture depends on coordinated activities of various cytoskeletal components (CitationSvitkina et al., 2010). Our results indicate that several cytoskeletal genes, including actin, tubulin, and microtubules, are dysregulated in schizophrenia. BMP signaling, particularly BMP7, has also been shown to affect dendrite formation in cortical neurons (CitationGuo et al., 1998; CitationHorbinski et al., 2002; CitationLe Roux et al., 1999), through both the remodeling of the actin cytoskeleton (CitationLee-Hoeflich et al., 2004) and the stabilization of microtubules (CitationPodkowa et al., 2010). Of interest, BMP7 has also been shown to attenuate the reduction of primary dendrites exposed to glutamate excitotoxicity, suggesting a neuroprotective response (CitationEsquenazi et al., 2002). Considering all of these findings together, up-regulation of TGF-β/BMP signaling may represent a molecular snapshot of the internal homeostasis of these neurons in response to disinhibition-induced excitotoxic injury.
ECM Disturbances
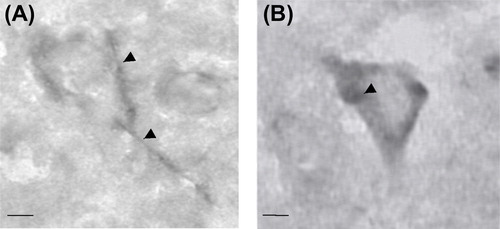
CSPGs are critical components of perineuronal nets (PNNs) (), which are ECM structures that enwrap the cell body and perisomatic region of various types of neurons, including PV and pyramidal neurons (CitationFrischknecht & Seidenbecher, 2008). They are believed to originate predominantly from glial cells and are secreted into the extracellular space (CitationMorgenstern et al., 2002; CitationPantazopoulos et al., 2008). Using biotin-labeled lectin from Wisteria floribunda agglutinin (WFA) to label CSPGs, it has recently been found that, in the human amygdala, CSPG-containing cells were virtually exclusively astrocytes (CitationPantazopoulos et al., 2008, Citation2010). At the same time, the density of PNNs in the amygdala has been found to be significantly decreased in schizophrenia (CitationPantazopoulos et al., 2010), which may be a result of impaired secretion and/or production of CSPGs by astrocytes (CitationPantazopoulos et al., 2010). In the present study, however, our data indicate that the transcripts of many of the genes that encode CSPGs are present in pyramidal neurons in the STG. Consistent with this, it has recently been shown that one of the CSPGs, versican, is localized to the somata and dendrites of pyramidal neurons in the mouse cerebral cortex (CitationHorii-Hayashi et al., 2008). Cell culture studies have also shown that the production of some of the CSPGs, such as aggregan, may be glia independent (CitationGiamanco & Matthews, 2012). Furthermore, using WFA histochemistry, we have found that many of the cells that express CSPGs in the human cerebral cortex appear to be neurons, not astrocytes (CitationIkeda et al., 2009) (). Hence, cellular mechanisms of CSPG production and/or secretion may differ between the cortex and subcortical structures. In the present study, we found that many of the CSPG transcripts in pyramidal neurons were significantly down-regulated in schizophrenia (Table 3b). Consistent with this observation and the aforementioned finding in the amygdala (CitationPantazopoulos et al., 2010), the density of PNNs in the prefrontal cortex has also been found to be decreased in schizophrenia (CitationMauney et al., 2013). A decrease in PNNs may render synaptic structures more vulnerable to alterations, contributing to reduced synaptic connectivities. It is of interest to note that TGF-β signaling is known to play a key role in regulating CSPGs (CitationAsher et al., 2002). However, activation of TGF-β signaling typically leads to increased CSPG production (CitationAsher et al., 2000, Citation2002), but we observed primarily a down-regulation of CSPG mRNAs. Further investigation is therefore needed to elucidate the precise relationship, if any, between the up-regulation of TGF-β signaling and the dysregulation of CSPGs in schizophrenia.
Figure 5. Wisteria floribunda agglutinin (WFA) histochemical labeling of chondroitin sulfate proteoglycans (CSPGs) in the human cerebral cortex. (A) CSPG-rich perineuronal nets (arrowheads). (B) WFA also labeled intracellular CSPGs (arrowhead). Scale bars = 5 μm (A and B).
Altered miRNA Expression in Schizophrenia
In addition to alterations in gene expression and biological pathways, we also noted changes in the posttranscriptional regulatory environment, characterized by alterations in miRNA expression. The number of miRNAs identified in this study is relatively small, but in the same order of magnitude as found in previous studies investigating miRNA expression in the cerebral cortex in schizophrenia (CitationBeveridge et al., 2008; CitationMoreau et al., 2011; CitationSantarelli et al., 2011). However, direct comparison of our data with those of the previous studies may not be appropriate, as all of these studies examined RNA extracted from homogenized cortical gray matter.
Results of pathway analysis of the predicted target genes of the differentially expressed miRNAs correlate highly with the dysregulated biological pathways identified by mRNA expression profiling, such as TGF-β signaling, regulation of actin cytoskeleton, ECM-receptor interaction, and apoptosis (), in addition to other pathways that have also been associated with schizophrenia, such as mitogen-activated protein kinase (MAPK) signaling, neurotrophin signaling, axon guidance, and WNT signaling. These data raise an intriguing possibility that the pathophysiology of pyramidal cell dysfunction in schizophrenia may in part be mediated by the concerted dysregulation of gene network functions as a result of the altered expression of a relatively small number of miRNAs.
CONCLUSION
We have identified molecular pathways that appear to be altered in layer 3 pyramidal neurons in the STG in schizophrenia. These findings provide a neurobiological foundation upon which experimental manipulation of the expression of the differentially expressed genes may allow us to begin to characterize the molecular architectures that underlie pyramidal cell dysfunction in schizophrenia. For instance, based on our findings, one might hypothesize that neurons derived from induced pluripotent stem cells from patients with schizophrenia may be particularly vulnerable to oxidative stress, which may then lead to dysregulated TGF-β/BMP signaling and downstream consequences, such as compromised extracellular matrix, hypoplastic dendritic spines, etc. An alternative approach may involve overexpressing genes related to the TGF-β/BMP pathway using pyramidal cell–specific promoters in in vivo systems to see if this may result in similar molecular pathologies. Hence, this “reverse translational strategy” circumvents the traditional difficulties of studying the biology of psychiatric disorders due to the inaccessibility of the living human brain and may ultimately lead to deeper understanding of the pathogenetic mechanisms of these devastating, uniquely human disorders.
Supplementary Methods 1 and 2, Tables 1–5 and Figures 1–3
Download PDF (854.2 KB)Declaration of interest: The authors report no conflicts of interest. The authors alone are responsible for the content and writing of the paper.
This study was supported by grants P50MH080272 (Boston CIDAR: Vulnerability to Progression in Schizophrenia) and R01MH076060 from the National Institutes of Health.
REFERENCES
- Allen, N. C., Bagade, S., McQueen, M. B., Ioannidis, J. P., Kavvoura, F. K., Khoury, M. J., et al. (2008). Systematic meta-analyses and field synopsis of genetic association studies in schizophrenia: The SzGene database. Nat Genet, 40, 827–834.
- Ananth, H., Popescu, I., Critchley, H. D., Good, C. D., Frackowiak, R. S., & Dolan, R. J. (2002). Cortical and subcortical gray matter abnormalities in schizophrenia determined through structural magnetic resonance imaging with optimized volumetric voxel-based morphometry. Am J Psychiatry, 159, 1497–1505.
- Arnsten, A. F., Paspalas, C. D., Gamo, N. J., Yang, Y., & Wang, M. (2010). Dynamic Network Connectivity: A new form of neuroplasticity. Trends Cogn Sci, 14, 365–375.
- Asher, R. A., Morgenstern, D. A., Fidler, P. S., Adcock, K. H., Oohira, A., Braistead, J. E., et al. (2000). Neurocan is upregulated in injured brain and in cytokine-treated astrocytes. J Neurosci, 20, 2427–2438.
- Asher, R. A., Morgenstern, D. A., Shearer, M. C., Adcock, K. H., Pesheva, P., & Fawcett, J. W. (2002). Versican is upregulated in CNS injury and is a product of oligodendrocyte lineage cells. J Neurosci, 22, 2225–2236.
- Barch, D. M., Sheline, Y. I., Csernansky, J. G., & Snyder, A. Z. (2003). Working memory and prefrontal cortex dysfunction: Specificity to schizophrenia compared with major depression. Biol Psychiatry, 53, 376–384.
- Baskerville, S., & Bartel, D. P. (2005). Microarray profiling of microRNAs reveals frequent coexpression with neighboring miRNAs and host genes. RNA, 11, 241–247.
- Beck, H. N., Drahushuk, K., Jacoby, D. B., Higgins, D., & Lein, P. J. (2001). Bone morphogenetic protein-5 (BMP-5) promotes dendritic growth in cultured sympathetic neurons. BMC Neurosci, 2, 12.
- Benes, F. M. (2006). Strategies for improving sensitivity of gene expression profiling: Regulation of apoptosis in the limbic lobe of schizophrenics and bipolars. Prog Brain Res, 158, 153–172.
- Benes, F. M. (2011). Regulation of cell cycle and DNA repair in post-mitotic GABA neurons in psychotic disorders. Neuropharmacology, 60, 1232–1242.
- Benes, F. M., Lim, B., Matzilevich, D., Subburaju, S., & Walsh, J. P. (2008). Circuitry-based gene expression profiles in GABA cells of the trisynaptic pathway in schizophrenics versus bipolars. Proc Natl Acad Sci U S A, 105, 20935–20940.
- Benes, F. M., Lim, B., Matzilevich, D., Walsh, J. P., Subburaju, S., & Minns, M. (2007). Regulation of the GABA cell phenotype in hippocampus of schizophrenics and bipolars. Proc Natl Acad Sci U S A, 104, 10164–10169.
- Benes, F. M., Matzilevich, D., Burke, R. E., & Walsh, J. (2006). The expression of proapoptosis genes is increased in bipolar disorder, but not in schizophrenia. Mol Psychiatry, 11, 241–251.
- Bergmann, A. (2002). Survival signaling goes BAD. Dev Cell, 3, 607–608.
- Beveridge, N. J., Tooney, P. A., Carroll, A. P., Gardiner, E., Bowden, N., Scott, R. J., et al. (2008). Dysregulation of miRNA 181b in the temporal cortex in schizophrenia. Hum Mol Genet, 17, 1156–1168.
- Bitanihirwe, B. K., Lim, M. P., Kelley, J. F., Kaneko, T., & Woo, T.-U. W. (2009). Glutamatergic deficits and parvalbumin-containing inhibitory neurons in the prefrontal cortex in schizophrenia. BMC Psychiatry, 9, 71.
- Bowie, C. R., & Harvey, P. D. (2005). Cognition in schizophrenia: Impairments, determinants, and functional importance. Psychiatr Clin North Am, 28, 613–633, 626.
- Braitenberg, V., & Schuz, A. (1998). Cortex: Statistics and geometry of neuronal connectivity. Berlin: Springer.
- Buzsaki, G., & Draguhn, A. (2004). Neuronal oscillations in cortical networks. Science, 304, 1926–1929.
- Cajigas, I. J., Tushev, G., Will, T. J., tom Dieck, S., Fuerst, N., & Schuman, E. M. (2012). The local transcriptome in the synaptic neuropil revealed by deep sequencing and high-resolution imaging. Neuron, 74, 453–466.
- Caretti, E., Devarajan, K., Coudry, R., Ross, E., Clapper, M. L., Cooper, H. S., et al. (2008). Comparison of RNA amplification methods and chip platforms for microarray analysis of samples processed by laser capture microdissection. J Cell Biochem, 103, 556–563.
- Cascella, N. G., Fieldstone, S. C., Rao, V. A., Pearlson, G. D., Sawa, A., & Schretlen, D. J. (2010). Gray-matter abnormalities in deficit schizophrenia. Schizophr Res, 120, 63–70.
- Cho, R. Y., Konecky, R. O., & Carter, C. S. (2006). Impairments in frontal cortical {gamma} synchrony and cognitive control in schizophrenia. Proc Natl Acad Sci U S A, 103, 19878–19883.
- Chou, J., Harvey, B. K., Chang, C. F., Shen, H., Morales, M., & Wang, Y. (2006). Neuroregenerative effects of BMP7 after stroke in rats. J Neurol Sci, 240, 21–29.
- Costa, E., Davis, J., Grayson, D. R., Guidotti, A., Pappas, G. D., & Pesold, C. (2001). Dendritic spine hypoplasticity and downregulation of reelin and GABAergic tone in schizophrenia vulnerability. Neurobiol Dis, 8, 723–742.
- Derynck, R., & Miyazono, K. o. (2008). The TGF-[beta] family. Cold Spring Harbor, NY: Cold Spring Harbor Laboratory Press.
- Dhandapani, K. M., & Brann, D. W. (2003). Transforming growth factor-beta: A neuroprotective factor in cerebral ischemia. Cell Biochem Biophys, 39, 13–22.
- Esquenazi, S., Monnerie, H., Kaplan, P., & Le Roux, P. (2002). BMP-7 and excess glutamate: Opposing effects on dendrite growth from cerebral cortical neurons in vitro. Exp Neurol, 176, 41–54.
- Frischknecht, R., & Seidenbecher, C. I. (2008). The crosstalk of hyaluronan-based extracellular matrix and synapses. Neuron Glia Biol, 4, 249–257.
- Gabriel, C., Ali, C., Lesne, S., Fernandez-Monreal, M., Docagne, F., Plawinski, L., et al. (2003). Transforming growth factor alpha-induced expression of type 1 plasminogen activator inhibitor in astrocytes rescues neurons from excitotoxicity. FASEB J, 17, 277–279.
- Garey, L. J., Ong, W. Y., Patel, T. S., Kanani, M., Davis, A., Mortimer, A. M., et al. (1998). Reduced dendritic spine density on cerebral cortical pyramidal neurons in schizophrenia. J Neurol Neurosurg Psychiatry, 65, 446–453.
- Geschwind, D. H., Ou, J., Easterday, M. C., Dougherty, J. D., Jackson, R. L., Chen, Z., et al. (2001). A genetic analysis of neural progenitor differentiation. Neuron, 29, 325–339.
- Giamanco, K. A., & Matthews, R. T. (2012). Deconstructing the perineuronal net: Cellular contributions and molecular composition of the neuronal extracellular matrix. Neuroscience, 218, 367–384.
- Giancotti, F. G., & Ruoslahti, E. (1999). Integrin signaling. Science, 285, 1028–1032.
- Glantz, L. A., Gilmore, J. H., Lieberman, J. A., & Jarskog, L. F. (2006). Apoptotic mechanisms and the synaptic pathology of schizophrenia. Schizophr Res, 81, 47–63.
- Glantz, L. A., & Lewis, D. A. (2000). Decreased dendritic spine density on prefrontal cortical pyramidal neurons in schizophrenia. Arch Gen Psychiatry, 57, 65–73.
- Guo, X., Rueger, D., & Higgins, D. (1998). Osteogenic protein-1 and related bone morphogenetic proteins regulate dendritic growth and the expression of microtubule-associated protein-2 in rat sympathetic neurons. Neurosci Lett, 245, 131–134.
- Gur, R. E., Cowell, P. E., Latshaw, A., Turetsky, B. I., Grossman, R. I., Arnold, S. E., et al. (2000). Reduced dorsal and orbital prefrontal gray matter volumes in schizophrenia. Arch Gen Psychiatry, 57, 761–768.
- Gur, R. E., Turetsky, B. I., Bilker, W. B., & Gur, R. C. (1999). Reduced gray matter volume in schizophrenia. Arch Gen Psychiatry, 56, 905–911.
- Hanover, J. L., Huang, Z. J., Tonegawa, S., & Stryker, M. P. (1999). Brain-derived neurotrophic factor overexpression induces precocious critical period in mouse visual cortex. J Neurosci, 19, RC40.
- Hashimoto, T., Volk, D. W., Eggan, S. M., Mirnics, K., Pierri, J. N., Sun, Z., et al. (2003). Gene expression deficits in a subclass of GABA neurons in the prefrontal cortex of subjects with schizophrenia. J Neurosci, 23, 6315–6326.
- Homayoun, H., & Moghaddam, B. (2007). NMDA receptor hypofunction produces opposite effects on prefrontal cortex interneurons and pyramidal neurons. J Neurosci, 27, 11496–11500.
- Horbinski, C., Stachowiak, E. K., Chandrasekaran, V., Miuzukoshi, E., Higgins, D., & Stachowiak, M. K. (2002). Bone morphogenetic protein-7 stimulates initial dendritic growth in sympathetic neurons through an intracellular fibroblast growth factor signaling pathway. J Neurochem, 80, 54–63.
- Horii-Hayashi, N., Okuda, H., Tatsumi, K., Ishizaka, S., Yoshikawa, M., & Wanaka, A. (2008). Localization of chondroitin sulfate proteoglycan versican in adult brain with special reference to large projection neurons. Cell Tissue Res, 334, 163–177.
- Hyytiainen, M., Penttinen, C., & Keski-Oja, J. (2004). Latent TGF-beta binding proteins: Extracellular matrix association and roles in TGF-beta activation. Crit Rev Clin Lab Sci, 41, 233–264.
- Ikeda, M., Naitoh, M., Kubota, H., Ishiko, T., Yoshikawa, K., Yamawaki, S., et al. (2009). Elastic fiber assembly is disrupted by excessive accumulation of chondroitin sulfate in the human dermal fibrotic disease, keloid. Biochem Biophys Res Commun, 390, 1221–1228.
- Iwamoto, K., & Kato, T. (2006). Gene expression profiling in schizophrenia and related mental disorders. Neuroscientist, 12, 349–361.
- Jia, P., Wang, L., Meltzer, H. Y., & Zhao, Z. (2010). Common variants conferring risk of schizophrenia: A pathway analysis of GWAS data. Schizophr Res, 122, 38–42.
- Kanehisa, M., & Goto, S. (2000). KEGG: Kyoto Encyclopedia of Genes and Genomes. Nucleic Acids Res, 28, 27–30.
- Kanehisa, M., Goto, S., Furumichi, M., Tanabe, M., & Hirakawa, M. (2010). KEGG for representation and analysis of molecular networks involving diseases and drugs. Nucleic Acids Res, 38 (Database issue), D355–D360.
- Kanehisa, M., Goto, S., Hattori, M., Aoki-Kinoshita, K. F., Itoh, M., Kawashima, S., et al. (2006). From genomics to chemical genomics: New developments in KEGG. Nucleic Acids Res, 34 (Database issue), D354–D357.
- Kim, E. S., Kim, R. S., Ren, R. F., Hawver, D. B., & Flanders, K. C. (1998). Transforming growth factor-beta inhibits apoptosis induced by beta-amyloid peptide fragment 25–35 in cultured neuronal cells. Brain Res Mol Brain Res, 62, 122–130.
- Kim, J., Krichevsky, A., Grad, Y., Hayes, G. D., Kosik, K. S., Church, G. M., et al. (2004). Identification of many microRNAs that copurify with polyribosomes in mammalian neurons. Proc Natl Acad Sci U S A, 101, 360–365.
- Kinney, J. W., Davis, C. N., Tabarean, I., Conti, B., Bartfai, T., & Behrens, M. M. (2006). A specific role for NR2A-containing NMDA receptors in the maintenance of parvalbumin and GAD67 immunoreactivity in cultured interneurons. J Neurosci, 26, 1604–1615.
- Klempt, N. D., Sirimanne, E., Gunn, A. J., Klempt, M., Singh, K., Williams, C., et al. (1992). Hypoxia-ischemia induces transforming growth factor beta 1 mRNA in the infant rat brain. Brain Res Mol Brain Res, 13, 93–101.
- Kwon, J. S., O’Donnell, B. F., Wallenstein, G. V., Greene, R. W., Hirayasu, Y., Nestor, P. G., et al. (1999). Gamma frequency-range abnormalities to auditory stimulation in schizophrenia. Arch Gen Psychiatry, 56, 1001–1005.
- Landgraf, P., Rusu, M., Sheridan, R., Sewer, A., Iovino, N., Aravin, A., et al. (2007). A mammalian microRNA expression atlas based on small RNA library sequencing. Cell, 129, 1401–1414.
- Le Roux, P., Behar, S., Higgins, D., & Charette, M. (1999). OP-1 enhances dendritic growth from cerebral cortical neurons in vitro. Exp Neurol, 160, 151–163.
- Lee-Hoeflich, S. T., Causing, C. G., Podkowa, M., Zhao, X., Wrana, J. L., & Attisano, L. (2004). Activation of LIMK1 by binding to the BMP receptor, BMPRII, regulates BMP-dependent dendritogenesis. EMBO J, 23, 4792–4801.
- Lewis, D. A., & Gonzalez-Burgos, G. (2008). Neuroplasticity of neocortical circuits in schizophrenia. Neuropsychopharmacology, 33, 141–165.
- Lewis, D. A., Hashimoto, T., & Volk, D. W. (2005). Cortical inhibitory neurons and schizophrenia. Nat Rev Neurosci, 6, 312–324.
- Livak, K. J., & Schmittgen, T. D. (2001). Analysis of relative gene expression data using real-time quantitative PCR and the 2(-Delta Delta C(T)) method. Methods, 25, 402–408.
- Luzzi, V., Holtschlag, V., & Watson, M. A. (2001). Expression profiling of ductal carcinoma in situ by laser capture microdissection and high-density oligonucleotide arrays. Am J Pathol, 158, 2005–2010.
- Mahadevappa, M., & Warrington, J. A. (1999). A high-density probe array sample preparation method using 10- to 100-fold fewer cells. Nat Biotechnol, 17, 1134–1136.
- Massague, J., & Gomis, R. R. (2006). The logic of TGFbeta signaling. FEBS Lett, 580, 2811–2820.
- Mauney, S. A., Athanas, K. M., Pantazopoulos, H., Shaskan, N., Passeri, E., Berretta, S., et al. (2013). Developmental pattern of perineuronal nets in the human prefrontal cortex and their deficit in schizophrenia. Biol Psychiatry, 74, 427–435.
- McCarley, R. W., Wible, C. G., Frumin, M., Hirayasu, Y., Levitt, J. J., Fischer, I. A., et al. (1999). MRI anatomy of schizophrenia. Biol Psychiatry, 45, 1099–1119.
- Melchior, F., & Hengst, L. (2002). SUMO-1 and p53. Cell Cycle, 1, 245–249.
- Mellios, N., Galdzicka, M., Ginns, E., Baker, S. P., Rogaev, E., Xu, J., et al. (2012). Gender-specific reduction of estrogen-sensitive small RNA, miR-30b, in subjects with schizophrenia. Schizophr Bull, 38, 433–443.
- Miller, B. J., Buckley, P., Seabolt, W., Mellor, A., & Kirkpatrick, B. (2011). Meta-analysis of cytokine alterations in schizophrenia: Clinical status and antipsychotic effects. Biol Psychiatry, 70, 663–671.
- Mitelman, S. A., Shihabuddin, L., Brickman, A. M., Hazlett, E. A., & Buchsbaum, M. S. (2003). MRI assessment of gray and white matter distribution in Brodmann’s areas of the cortex in patients with schizophrenia with good and poor outcomes. Am J Psychiatry, 160, 2154–2168.
- Moreau, M. P., Bruse, S. E., David-Rus, R., Buyske, S., & Brzustowicz, L. M. (2011). Altered microRNA expression profiles in postmortem brain samples from individuals with schizophrenia and bipolar disorder. Biol Psychiatry, 69, 188–193.
- Morey, J. S., Ryan, J. C., & Van Dolah, F. M. (2006). Microarray validation: Factors influencing correlation between oligonucleotide microarrays and real-time PCR. Biol Proced Online, 8, 175–193.
- Morgenstern, D. A., Asher, R. A., & Fawcett, J. W. (2002). Chondroitin sulphate proteoglycans in the CNS injury response. Prog Brain Res, 137, 313–332.
- Moustakas, A., & Heldin, C. H. (2008). Dynamic control of TGF-beta signaling and its links to the cytoskeleton. FEBS Lett, 582, 2051–2065.
- Ohta, Y., Nakagawa, K., Imai, Y., Katagiri, T., Koike, T., & Takaoka, K. (2008). Cyclic AMP enhances Smad-mediated BMP signaling through PKA-CREB pathway. J Bone Miner Metab, 26, 478–484.
- Olney, J. W., & Farber, N. B. (1995). Glutamate receptor dysfunction and schizophrenia. Arch Gen Psychiatry, 52, 998–1007.
- Pantazopoulos, H., Murray, E. A., & Berretta, S. (2008). Total number, distribution, and phenotype of cells expressing chondroitin sulfate proteoglycans in the normal human amygdala. Brain Res, 1207, 84–95.
- Pantazopoulos, H., Woo, T.-U. W., Lim, M. P., Lange, N., & Berretta, S. (2010). Extracellular matrix-glial abnormalities in the amygdala and entorhinal cortex of subjects diagnosed with schizophrenia. Arch Gen Psychiatry, 67, 155–166.
- Perkins, D. O., Jeffries, C. D., Jarskog, L. F., Thomson, J. M., Woods, K., Newman, M. A., et al. (2007). microRNA expression in the prefrontal cortex of individuals with schizophrenia and schizoaffective disorder. Genome Biol, 8, R27.
- Petegnief, V., Friguls, B., Sanfeliu, C., Sunol, C., & Planas, A. M. (2003). Transforming growth factor-alpha attenuates N-methyl-d-aspartic acid toxicity in cortical cultures by preventing protein synthesis inhibition through an Erk1/2-dependent mechanism. J Biol Chem, 278, 29552–29559.
- Pfaffl, M. W., Horgan, G. W., & Dempfle, L. (2002). Relative expression software tool (REST) for group-wise comparison and statistical analysis of relative expression results in real-time PCR. Nucleic Acids Res, 30, e36.
- Pietersen, C. Y., Lim, M. P., Macey, L., Woo, T.-U. W., & Sonntag, K. C. (2011). Neuronal type-specific gene expression profiling and laser-capture microdissection. Methods Mol Biol, 755, 327–343.
- Pietersen, C. Y., Lim, M. P., & Woo, T.-U. W. (2009). Obtaining high quality RNA from single cell populations in human postmortem brain tissue. J Vis Exp,(30).
- Pietsch, E. C., Sykes, S. M., McMahon, S. B., & Murphy, M. E. (2008). The p53 family and programmed cell death. Oncogene, 27, 6507–6521.
- Podkowa, M., Zhao, X., Chow, C. W., Coffey, E. T., Davis, R. J., & Attisano, L. (2010). Microtubule stabilization by bone morphogenetic protein receptor-mediated scaffolding of c-Jun N-terminal kinase promotes dendrite formation. Mol Cell Biol, 30, 2241–2250.
- Prehn, J. H., Bindokas, V. P., Marcuccilli, C. J., Krajewski, S., Reed, J. C., & Miller, R. J. (1994). Regulation of neuronal Bcl2 protein expression and calcium homeostasis by transforming growth factor type beta confers wide-ranging protection on rat hippocampal neurons. Proc Natl Acad Sci U S A, 91, 12599–12603.
- Radonic, A., Thulke, S., Mackay, I. M., Landt, O., Siegert, W., & Nitsche, A. (2004). Guideline to reference gene selection for quantitative real-time PCR. Biochem Biophys Res Commun, 313, 856–862.
- Rauch, U. (2004). Extracellular matrix components associated with remodeling processes in brain. Cell Mol Life Sci, 61, 2031–2045.
- Ross, S., & Hill, C. S. (2008). How the Smads regulate transcription. Int J Biochem Cell Biol, 40, 383–408.
- Santarelli, D. M., Beveridge, N. J., Tooney, P. A., & Cairns, M. J. (2011). Upregulation of dicer and microRNA expression in the dorsolateral prefrontal cortex Brodmann area 46 in schizophrenia. Biol Psychiatry, 69, 180–187.
- Selemon, L. D., & Goldman-Rakic, P. S. (1999). The reduced neuropil hypothesis: A circuit based model of schizophrenia. Biol Psychiatry, 45, 17–25.
- Shi, Y., & Ethell, I. M. (2006). Integrins control dendritic spine plasticity in hippocampal neurons through NMDA receptor and Ca2+/calmodulin-dependent protein kinase II-mediated actin reorganization. J Neurosci, 26, 1813–1822.
- Shi, Y., & Massague, J. (2003). Mechanisms of TGF-beta signaling from cell membrane to the nucleus. Cell, 113, 685–700.
- Simunovic, F., Yi, M., Wang, Y., Macey, L., Brown, L. T., Krichevsky, A. M., et al. (2009). Gene expression profiling of substantia nigra dopamine neurons: Further insights into Parkinson’s disease pathology. Brain, 132 (Pt 7), 1795–1809.
- Smith, G. M., & Strunz, C. (2005). Growth factor and cytokine regulation of chondroitin sulfate proteoglycans by astrocytes. Glia, 52, 209–218.
- Spencer, K. M., Nestor, P. G., Perlmutter, R., Niznikiewicz, M. A., Klump, M. C., Frumin, M., et al. (2004). Neural synchrony indexes disordered perception and cognition in schizophrenia. Proc Natl Acad Sci U S A, 101, 17288–17293.
- Suga, M., Yamasue, H., Abe, O., Yamasaki, S., Yamada, H., Inoue, H., et al. (2010). Reduced gray matter volume of Brodmann’s Area 45 is associated with severe psychotic symptoms in patients with schizophrenia. Eur Arch Psychiatry Clin Neurosci, 260, 465–473.
- Super, H., & Uylings, H. B. (2001). The early differentiation of the neocortex: A hypothesis on neocortical evolution. Cerebral Cortex, 11, 1101–1109.
- Svitkina, T., Lin, W. H., Webb, D. J., Yasuda, R., Wayman, G. A., Van Aelst, L., et al. (2010). Regulation of the postsynaptic cytoskeleton: Roles in development, plasticity, and disorders. J Neurosci, 30, 14937–14942.
- Sweet, R. A., Bergen, S. E., Sun, Z., Sampson, A. R., Pierri, J. N., & Lewis, D. A. (2004). Pyramidal cell size reduction in schizophrenia: Evidence for involvement of auditory feedforward circuits. Biol Psychiatry, 55, 1128–1137.
- Sweet, R. A., Henteleff, R. A., Zhang, W., Sampson, A. R., & Lewis, D. A. (2009). Reduced dendritic spine density in auditory cortex of subjects with schizophrenia. Neuropsychopharmacology, 34, 374–389.
- Sweet, R. A., Pierri, J. N., Auh, S., Sampson, A. R., & Lewis, D. A. (2003). Reduced pyramidal cell somal volume in auditory association cortex of subjects with schizophrenia. Neuropsychopharmacology, 28, 599–609.
- Uhlhaas, P. J., & Singer, W. (2010). Abnormal neural oscillations and synchrony in schizophrenia. Nat Rev Neurosci, 11, 100–113.
- Vermeulen, J., De Preter, K., Lefever, S., Nuytens, J., De Vloed, F., Derveaux, S., et al. (2011). Measurable impact of RNA quality on gene expression results from quantitative PCR. Nucleic Acids Res, 39, e63.
- Vivien, D., & Ali, C. (2006). Transforming growth factor-beta signalling in brain disorders. Cytokine Growth Factor Rev, 17, 121–128.
- Wilke, M., Kaufmann, C., Grabner, A., Putz, B., Wetter, T. C., & Auer, D. P. (2001). Gray matter-changes and correlates of disease severity in schizophrenia: A statistical parametric mapping study. Neuroimage, 13, 814–824.
- Wozniak, M. A., Modzelewska, K., Kwong, L., & Keely, P. J. (2004). Focal adhesion regulation of cell behavior. Biochim Biophys Acta, 1692, 103–119.
- Yamasue, H., Iwanami, A., Hirayasu, Y., Yamada, H., Abe, O., Kuroki, N., et al. (2004). Localized volume reduction in prefrontal, temporolimbic, and paralimbic regions in schizophrenia: An MRI parcellation study. Psychiatry Res, 131, 195–207.
- Zaharieva, I., Georgieva, L., Nikolov, I., Kirov, G., Owen, M. J., O’Donovan, M. C., et al. (2008). Association study in the 5q31–32 linkage region for schizophrenia using pooled DNA genotyping. BMC Psychiatry, 8, 11.
- Zhou, Y. X., Zhao, M., Li, D., Shimazu, K., Sakata, K., Deng, C. X., et al. (2003). Cerebellar deficits and hyperactivity in mice lacking Smad4. J Biol Chem, 278, 42313–42320.