Abstract
Purpose: To evaluate the predictive value of SAR indicators by assessing the correlation of a SAR indicator with the corresponding predicted temperature. Ultimately, this should lead to a number of verified SAR indicators for characterization and optimization of a predicted SAR distribution.
Methods: A literature survey is followed by an evaluation of the SAR indicators on their functionality, using a set of heuristic classification criteria. To obtain an objective assessment of the predictive value for SAR characterisation, all SAR indicators are evaluated by correlating the value of the SAR indicator to the predicted target temperature when heated with the BSD2000 Sigma 60 applicator. Two methods were followed. First, the specificity of the SAR indicator to target temperature was assessed for each of the 36 patient-specific models, using 30 randomly chosen phase and amplitude settings. Secondly, each SAR indicator was used as a goal function to assess its suitability for optimisation purposes.
Results: Only a selected number of SAR indicators correlate well with tumour/target-temperature. Hence, for target-related properties, an adequate set of SAR indicators is found in the literature. For hotspots, modifications are desirable. For optimisation purposes, improved objective functions have been defined.
Conclusions: From the correlation of the SAR indicators with tumour temperature, a preferred set of SAR indicators is derived:
For target heating, ‘average SAR ratio’, ‘Hotspot-target SAR ratio’, and ‘homogeneity coefficient’ provide suitable objective criteria, while for hotspot reduction, ‘Hotspot-target SAR ratio’ is considered the most useful indicator.
For optimisation procedures, ‘Hotspot-target SAR ratio’ is currently the most suitable objective function.
Nomenclature
| = |
Table |
Introduction
Within the hyperthermia community, general consensus exists that quality of hyperthermia treatment is a key factor for treatment outcome. In various clinical trials, a correlation between treatment outcome and various retrospectively assessed thermal dose parameters has been demonstrated Citation[1–8]. The derivation of a prescriptive quality parameter, preferably prognostic for treatment outcome, would have a great potential in further positioning hyperthermia as a practical and widespread adjunct to radiotherapy and chemotherapy Citation[9].
A major limitation for further enhancement of hyperthermia treatment quality is the difficulty to define the most relevant dose parameter Citation[10–12], to adequately monitor temperature distribution Citation[13], or to reliably predict the temperature (blood flow changes with temperature and over time) or SAR (specific absorption rate) distribution Citation[14], and thus it is still not feasible to prescribe a dose to a target volume. Important preconditions for solutions to overcome these limitations are that they must be economically as well as clinically acceptable Citation[15].
To improve hyperthermia treatment quality, research is currently focusing on two approaches:
Improvement of temperature monitoring during treatment by introducing non-invasive thermometry by magnetic resonance imaging (MRI) Citation[16],Citation[17]. However, it should be noted that this innovative approach improves monitoring and control, but provides no a priori information on treatment quality.
Optimisation of the temperature or SAR distribution by hyperthermia treatment planning (HTP). In strong contrast to the first research approach, a major benefit of HTP is that it offers a tool to a priori assess the temperature or SAR distribution and to apply optimisation methods prior to the actual treatment Citation[18–20].
As the potential of electromagnetic models has increased dramatically over recent years, the presently available HTP systems provide excellent opportunities to perform optimisation of the 3D SAR and, to a lesser extent, temperature distributions before and during treatment, i.e. to prescribe the amplitude and phase settings for optimal hyperthermia quality Citation[18],Citation[19].
A few groups have demonstrated already the great potential of 3D electromagnetic models to establish new quality assurance and control guidelines for superficial hyperthermia Citation[21–27]. De Bruijne et al. Citation[28] have demonstrated the new prospects that extensive electromagnetic modelling offers to elegantly characterise the performance of the Lucite cone applicator or superficial applicators in general. More recently, our group exploited electromagnetic modelling as the foundation for the development of a complex phased array applicator for hyperthermia treatment of head and neck tumours Citation[18],Citation[29–33].
Besides the initial use of HTP in characterisation of SAR distributions for applicator development and quality assurance studies, HTP is used more and more to guide optimisation of the hyperthermia treatment quality prior to or during treatment. In various publications, the Rotterdam and Berlin hyperthermia groups Citation[26],Citation[27],Citation[34] reported increased tumour temperatures following adaptation of the applicator settings or even by selecting a different applicator following extensive HTP to improve electromagnetic energy deposition in the tumour. The work of Paulides et al. Citation[28],Citation[29] showed that if the applicator is also designed with electromagnetic modelling, excellent agreement exists between predicted and measured SAR distribution in phantoms. De Bruijne et al. Citation[36] report a relative dose difference of 2% and a distance to agreement of 2 mm between predicted and measured data. The latter demonstrates that, under laboratory conditions, the accuracy of electromagnetic modelling in hyperthermia is comparable to the accuracy in radiotherapy treatment planning.
Various modelling packages are in use for hyperthermia, such as Sigma Hyperplan (finite element method or finite difference time domain) Citation[33],Citation[35], the Utrecht Citation[19],Citation[36] and SEMCAD-X HTP model (both finite difference time domain) Citation[37],Citation[38], as well as Comsol (finite element method), and CST (finite element method). Despite the fact that these electromagnetic models are using different mathematical concepts to describe the interaction between the electromagnetic field and tissue, all of them have been proven to be valid when compared against analytical solutions for specific configurations. At present, the reliability of an electromagnetic model is mostly governed by the precision of the antenna implementation in the electromagnetic model. In the hyperthermia groups of Rotterdam, Berlin, Munich and several others, Sigma Hyperplan is regularly used for treatment planning of loco-regional deep heating with the BSD2000 Sigma 60 or Sigma Eye applicator.
In order to exploit HTP to improve the quality of deep hyperthermia, it is mandatory that a comprehensive set of indicators is available to characterise and optimise the SAR distribution and to assess hyperthermia treatment quality. For both SAR characterisation and SAR optimisation, it is necessary to define objective criteria. Ideally, consensus exists on a set of quality indicators in order to enable quantitative comparison of different treatments, i.e. in the same patient with a single system, as well as in different patients, and even more importantly, with regard to treatments by different institutes and different treatment systems. Clearly, for optimisation, so-called objective functions for the selected SAR indicator are required, allowing it to be maximised or minimised using solver algorithms.
The objective of this study was to create a verified set of indicators for characterisation and optimisation of predicted SAR distributions. Hereto, the predictive value of SAR indicators is specified by assessing the correlation of a SAR indicator with the corresponding predicted temperature.
Methods
General outline of the study
First, in the methods section, the literature search, the set of heuristics for quality indicators, and the setup for the calculations for an objective evaluation through a correlation between temperature and SAR indicators are presented. In the results section, the outcome of the literature search is presented and evaluated according to the previously defined heuristic criteria. On basis of this evaluation, modifications of existing indicators or new indicators are proposed. The last part of the results section deals with objectively assessing the correlations between temperature models and the different indicators as well as the optimisation outcomes for the different indicators in order to evaluate their practical value, both in characterisation and in optimisation. This leads to the proposal of a preferred set of indicators that can be used in analysis or optimisation of SAR distributions. The outline is schematically depicted in .
Figure 1. Outline of the study.

Literature search
A literature search in PubMed was performed to make a survey of various quality indicators used for SAR characterisation and optimisation. Typical keywords used in this search were ‘treatment planning’, ‘SAR optimisation’, ‘SAR dosimetry’, ‘SAR analysis’ and ‘SAR treatment planning’ in combination with ‘Hyperthermia’. Subsequently, these quality indicators were evaluated on their usefulness for quality assurance and optimisation. A subjective evaluation was performed, using a set of heuristics considering various aspects of characterisation and optimisation modelling.
Criteria for subjective evaluation of SAR quality indicators
The quality of a hyperthermia treatment strongly depends on the balance between SAR in the target volume and SAR peaks outside this target volume, i.e. hotspots. Therefore, the SAR in target and hotspots are considered as most important for the analysis of SAR distributions. The SAR in the target is an indicator that needs to be maximised to elevate temperatures in the tumour. Hotspots, on the other hand, limit the applied power if they cause patient discomfort, further referred to as patient complaints, and thus must be minimised. Indicators providing information about the SAR in target and/or hotspots must be evaluated in terms of their ability to differentiate between poor and good treatment plans. Furthermore, the scale on which an indicator is defined is considered important, e.g. does the indicator contain absolute values, or is it defined relative to a certain average or maximum value?
For quality indicators in characterisation of SAR distributions, it is very important to have a comparative value. Intra- and inter-patient comparison should be possible with a quality indicator. Additionally, a comparison of clinical results as obtained by different treatment systems or institutes should be possible.
Over the years, many different quality indicators have been introduced. We may question whether many of these indicators are needed. However, for selection of the most appropriate indicator, an evaluation of the various quality indicators on their ability to characterise SAR distributions or to optimise a SAR distribution is required. For such an evaluation, a set of subjective and objective criteria are required. The definitions of the set of heuristics as used in the subjective evaluation are formulated below and provide a boolean (yes or no) as answer. The objective criteria are explained in the next section.
Criterion A: Characterisation of SAR distributions, SARmax independence
A general criterion for quality indicators is SARmax independence. In SAR distributions, either modelled or measured, the outliers tend to be more sensitive to the set-up of the model or measurement than the average. Clearly, comparison of measured data (mostly with a coarse data sampling) with predicted data (fine data sampling) will also improve when normalisation on SARmax is replaced by for instance on SARaverage. It is our experience that SARmax is potentially easily disrupted by details of the model. Tissue segmentation inaccuracies and inaccuracies in conformality of the tetrahedral grid can easily lead to local peaks in SAR that do not correspond with the actual situation. SARmax is potentially far more easily affected by these inaccuracies than the volume-averaged SAR. Additionally, tetrahedron–or voxel size will influence the SARmax value. In finite element method, but also in finite difference time domain models with dynamic voxel sizes, the element size often differs considerably over the patient anatomy, generally being particularly small at tissue interfaces with strong curvatures. If tetrahedra or voxels are large, maxima in SAR will be averaged over the element volume and thus will be smoothed. Average SAR however, is less sensitive for changes in value of SARmax, either in finite element method or finite difference time domain. Although the effect of size could be counteracted with a finer grid, SARmax will remain more sensitive to segmentation errors than average SAR.
Criterion B: Characterisation of SAR distributions, target- or region-related criteria
With regard to the target region, a first sub-criterion is quantification of deposited SAR in the target (and/or other regions) in absolute values, i.e. W/kg. Deposited SAR has a direct relationship to the quality of heating.
A second sub-criterion is the quantification of the deposited SAR in the target (and/or other regions) relative to the whole body average SAR, i.e. selectivity of tumour heating.
A third sub-criterion is the analysis of the homogeneity of the target. Temperature homogeneity would be the first goal. However, this requires detailed knowledge of perfusion in the target. To be able to distinguish inhomogeneities in perfusion on a sub-target scale, it would be necessary to incorporate accurate perfusion data, a large vessel model and the dynamic behaviour of the perfusion. Acquiring these data is still very difficult and their practical implementation has been limited so far to small volumes such as used in interstitial HT Citation[40]. At present, we consider aiming for SAR homogeneity as the best alternative for homogeneity of heating. Moreover, at the frequency we used (i.e. 77 MHz), it is impossible to focus heating on a sub-target size, e.g. cm3, scale. As a consequence, we anticipate that the SAR distribution in the target area will finally determine the quality of the treatment. With current available electromagnetic phased array systems, we may at best aim for low heterogeneity of the SAR distribution in the target volume.
Indicators obeying the three sub-criteria mentioned above are always comparable between heat sessions, patients, institutes, systems and studies, assuming that the efficiency of the system is known.
Criterion C: Characterisation of SAR distributions, hotspot related criteria
Quality indicators should provide information about the absolute SAR level in hotspots, as well as relative to the target. Indicators obeying these criteria are comparable between heat sessions, patients, institutes, systems and studies.
Criterion D: Optimisation criteria for SAR objective functions
For goal functions in optimisation there are two important criteria. Maximisation of SAR in the target area is the most important objective. However, hotspots typically limit the SAR level in the target and therefore the goal function should additionally restrict hotspot SAR.
Objective evaluation of quality indicators for characterisation of SAR distribution through model calculations for 36 patients
All subjective criteria mentioned in the previous paragraph lead to a set of indicators that theoretically allow SAR characterisation and optimisation. In case one of the aspects is covered insufficiently, new or modified indicators need to be proposed.
To assess the predictive value of the quality indicators, the SAR and temperature part of the Sigma Hyperplan model is used, to investigate the correlation of T50 with the associated quality indicator. A high correlation between T50 and a quality indicator means that the specific quality indicator has a high predictive value for the target temperature, i.e. a high value of this indicator will lead to a high temperature. Preferably, a quality indicator should provide patient-specific information, and should also enable comparison between different patients, treatments, institutes and treatment settings. The SAR part of Sigma Hyperplan is based on the finite element method calculation of Maxwell's equations, the temperature part is based on the Pennes bio-heat equation Citation[40]. Using Sigma Hyperplan with a model of the BSD2000 Sigma 60, we calculated electromagnetic and temperature distributions for 36 patients, with 30 different amplitude and phases settings each, to verify the functionality of the proposed indicators Citation[33],Citation[34]. These 30 different settings are chosen randomly (amplitude = random (0.5, 1), phase = random (−180, 180), but are the same for all 36 patients. To assess the functionality of each quality indicator for optimisation, each indicator is used as a goal function for a patient-specific SAR optimisation. The same 36 patient models as mentioned in the previous paragraph have been used for individual optimisation and the results are reported as the average for 36 patients. The resulting temperature model outcomes provide information about the suitability of each indicator as a goal function.
The characteristics of the 36 patient models used are summarised in .
Table I. Characteristics of the 36 patient models that were used to verify the found indicators. Averages and standard deviations are given.
Equipment
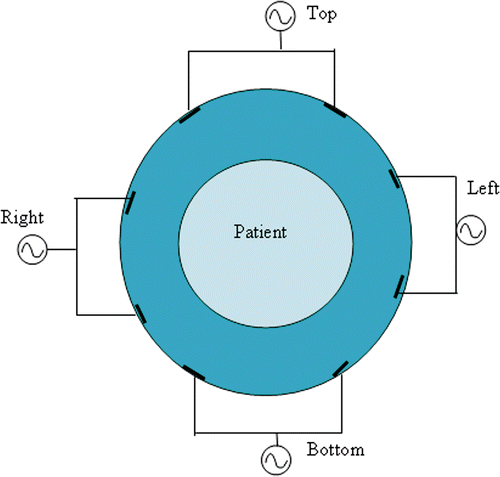
All calculation models are representative of a regular treatment of cervical cancer in the BSD2000 Sigma 60 Citation[41–43]. This applicator has a diameter of 60 cm and a length of 50 cm. Furthermore, it consists of a ring of 8 dipole antennas that are coupled in 4 channels of two antennas each, which is schematically depicted in .
Figure 2. Axial view of the BSD2000 Sigma 60 applicator, with the four channels, each connected to two antennas and a combined patient-applicator model.
E-fields are calculated for a frequency of 77 MHz, which is the standard treatment frequency for deep hyperthermia treatment in Rotterdam Citation[44]. For all models, the E-field for all antennas is calculated at an applicator input power of 400 W. Calculations take approximately 1.5 h on a 2.8 GHz Pentium 4 PC. Tissues are defined in the model on the basis of a CT scan, made with the patient in a hyperthermia hammock, i.e. equivalent to the position during hyperthermia treatment. Dielectric properties of these tissues are defined in Citation[45]. All tissues defined in are actually used in the segmentation of the patient model.
Table II. Tissues, defined in the patient model and their electromagnetic and thermal properties at 77 MHz, 37 °C and under thermal stress Citation[34],Citation[44],Citation[45].
The resolution of each CT slice is 0.1 × 0.1 cm2 and the slice thickness is 0.5 cm. This is resampled to 0.2 × 0.2 × 1 cm3, and then tissues are defined. Generally, a patient model is based on 140 CT slices, covering 70 cm of the patient, approximately from breast to knees.
From this segmented CT, a tetrahedral grid of patient and applicator is defined. This grid typically consists of 250,000 tetrahedra with edge lengths between 0.3 and 2.5 cm. This spatial resolution is commonly considered to be satisfactory for reliable SAR and temperature predictions and comparable to other studies, published on HTP using Sigma Hyperplan Citation[34],Citation[46].
Results
Literature survey
The indicators describing SAR in target and/or hotspots as found in the literature survey are listed in . In addition, a brief description is given per indicator, providing a basic overview of the reported quantity.
Ptarg: the power absorbed in the target Citation[47].
Table III. Quality indicators found in literature with a short explanation of their functionality.
Pratio1: ratio of target power to the total power absorbed in the patient Citation[46],Citation[48],Citation[49].
Pratio2: target power divided by the sum of the 10 maximum SAR locations Citation[48].
Pratio3: target power divided by the volume integral over the squared SAR in normal tissue, which gives a penalty to high SAR peaks Citation[48].
Pratio4: target power divided by the volume integral over the squared SAR in normal tissue expanded with the blood perfusion. Instead of SAR, the SAR perfusion quotient is used. The addition of perfusion corrects for a major bias between temperature and SAR modelling Citation[48].
Pratio5: target power divided by the sum of the 10 maximum SAR perfusion quotients. Again, the addition of tissue perfusion provides a better view of heating on basis of deposited energy Citation[48].
Psquare-ratio: ratio of the squared target power and the total power in normal tissue. The squared target power gives more weight to the target power Citation[46].
STHratio: ratio of squared SARtarg (the volume averaged target SAR) and hotspot SAR: the accumulated SAR in the 10 highest power points per antenna. The square in nominator gives more weight to target SAR Citation[46].
SARtarg: volume averaged SAR in the target. Used as objective function in Paulsen et al. Citation[49] with constraint SARtot ≤ 1 W/kg. Constraints of the form
lead to less satisfactory results. In Sandrini et al. Citation[50], more generally defined as power deposited in a region divided by region volume, as dosimetric indicator Citation[50–52].
SARratio: ratio of average SAR in the target and the average SAR in the patient Citation[49],Citation[53–55]. In Kuster et al. Citation[56], more generally defined as ratio of average SAR in a region and average SAR in the patient.
Maximum average SAR over 1 or 10 g of tissue, defined in IEEE-1529 Citation[57]. Used as dosimetric unit to define for example maximal doses of electromagnetic field Citation[50],Citation[58–60]. Also mentioned in ICNIRP guidelines Citation[61].
Maximum average SAR in 1 or 10 g relative to average SAR in patient, reported in Bernardi et al. Citation[59] as measure for maximal SAR relative to whole body average SAR.
Part of volume enclosed by x% SARmax. According to Meyerson et al. Citation[62] and Lee et al. Citation[63]. 25%SARmax coverage is a potential, prognostic factor, characterising the particular SAR distribution in the target. In Neumann et al. Citation[64] and Johnson et al. Citation[65] SAR coverage is used to assess the quality of heating by a superficial heating system. Also mentioned in Paulides et al. Citation[66] and De Bruijne et al. Citation[17].
Ratio of the volume enclosed by the 75%SARtarg max isoSAR and the volume enclosed by 25%SARtarg max isoSAR. Gelvich et al. Citation[67] used this quality indicator and found it suitable for applicator characterisation (see ).
SAR10max is defined as the sum of the 10 highest SAR spots Citation[46].
Ratio of the SAR exceeded in 1% of a region's volume and the median target SAR. In Kroeze et al. Citation[54] this indicator is used to assess the quality of heating in deep hyperthermia. In Van de Kamer et al. Citation[68], a similar definition of
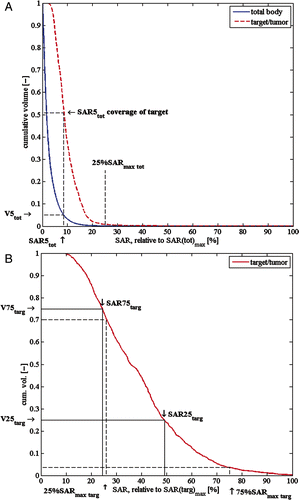
Figure 3. Illustration of SAR5 definition: SAR(tot)5 covers a substantial part of the target (A), and of 25%SAR targ max and 75%SAR targ max definition versus SAR25targ and SAR75targ definition (B). Both histograms are averages of 10 patient models.
Evaluation of SAR quality indicators as found in literature
As explained in the Methods section, a SAR quality indicator has to meet certain criteria in order to achieve maximum utility. gives an overview whether the criteria are met (Y/N) for each indicator.
Table IV. Heuristic evaluation of the quality indicators from .
From , for target-related characterisation of SAR distributions, two indicators appear to be most useful: SARtarg (9) and SARratio (10). They cover the absolute and relative effectiveness of a heat treatment, respectively. Additionally, x%SARmax coverage (13), considering the coverage of the target with sufficient SAR, has been reported to be useful in the literature. Modifications of this indicator are needed, however, to remove dependency on SARmax (see Methods section).
In our opinion, the Homogeneity coefficient (14) also appears to be a reasonable indicator for describing the distribution of target SAR, but is also dependent on SARmax. In the next paragraph, improvements for both x%SARmax coverage (13) and HC (14) are suggested.
For hotspot-related characterisation of SAR distributions, only a few indicators were found, and only one of them sufficiently meets the formulated heuristic criteria (see ). Here again we consider the SARmax dependency a disadvantage. Only SAR hs-targ ratio (16) is an indicator that clearly relates SAR in hotspots to the target SAR. Furthermore, it is difficult to predict a hotspot (which is defined by a temperature volume threshold) from a SAR indicator, because there is a complex dependency on the exposed volume, the perfusion, and the specific thermodynamics of the surroundings. However, if the SAR is low, it certainly will not cause a hotspot in well perfused normal tissue.
Finally, most of the indicators are possible objective functions for optimisation. Pratio2 (3) and Pratio5 (6) satisfy both criteria formulated for optimisation (see ). However, they only take into account the top 10 SAR values as hotspots, which makes them potentially sensitive for model inaccuracies for the reasons as mentioned for SARmax in the criteria section. Also, the STHratio (8) depends on SARmax. A good candidate for a goal function is SAR hs-targ ratio (16). This function relates the hotspots to the target without being dependent on SARmax. An alternative to the goal functions mentioned above is SARratio (10), which scores quite well according to the formulated general criteria and meets one of the two optimisation criteria (see ). Additional constraints should be applied to suppress hotspots.
We recommend defining all volume-related indicators relative to the patient volume inside the applicator. Since the part of the patient that is included in the model often differs between patients and institutes, patient volume inside the applicator is an unequivocal measure (at least for the BSD2000 Sigma 60 applicator), allowing comparisons between different patients, institutes and systems.
We conclude from our literature survey that, especially for target characterisation, most criteria are sufficiently covered by the existing indicators. Only sensitivity for model inaccuracies due to SARmax dependence is considered less satisfactory.
For hotspot characterisation, however, not all criteria are matched and an additional set of indicators is proposed for this purpose.
Suggested new or modified indicators
summarises our suggestions for modifications and new formulations of indicators to complete the spectrum of quality indicators and SAR optimisation objective functions.
Table V. Suggested modified and new quality indicators for characterisation and SAR optimisation.
In the paragraphs below, the rationale and function of the modifications and new indicators are explained:
13-m: SAR5tot coverage
First, x%SARmax coverage (13) is dependent on SARmax. Furthermore, this indicator was originally introduced in superficial hyperthermia, where the tumour is heated more directly: SARmax is almost always located in the target area. In deep hyperthermia though, 25%SARmax, i.e. 25% of the maximum SAR in the patient, covers almost no target volume at all, because of a small volume with very high SAR values. In this is illustrated in a cumulative SAR histogram, where the target and total body SAR are depicted, averaged over 10 patients. Therefore, we introduce the volume-dependent SAR5tot coverage (the SAR which is exceeded in 5% of the total volume). SAR5tot coverage is defined as the part of the target where the SAR exceeds SAR5tot. This is illustrated in , which shows that V5 covers approximately 50% of the target volume. This volume dependency, instead of SARmax dependency, should provide a less sensitive indicator. From the average of 10 patient models in , we deduced the measure of 5% of the total volume. The fifth volume percentile appears to cover the target exactly as much as needed for a sensitive indicator, since the SAR5tot value is situated on the steep part of the target SAR histogram. Therefore, higher or lower volume percentages would reduce the value of this indicator. Therefore, we presume that SAR5tot is a good measure for target coverage of the part of the patient with the highest SAR and is sensitive for differences between patients. This indicator produces the same sort of information as the x%SARmax coverage (13), but is independent of SARmax and more suitable for the deep hyperthermia practice.
14-m HCnew
The homogeneity coefficient HC(14) is also dependent on SARtarg max. Therefore, a similar improvement based on the volume dependent SAR75targ and SAR25targ is introduced. In , the rationale of this new approach is depicted in a cumulative volume SAR histogram of the target. This histogram again is an average of the calculated target SAR in 10 patient models. Values of SAR75targ and SAR25targ appear to be less different from each other than 25%SARtarg max and 75%SARtarg max, as can be seen in . However, the modified indicator HCnew provides information about the steepness of the target dose–volume histogram and thus about the homogeneity. Therefore, it provides the same information as the original HC but is less sensitive to SARtarg max changes.
16-m: SARhs-targ ratio new
Ratio of hotspot SAR and target SAR. Hotspot SAR is defined as the average SAR in V1. V1 is the volume of normal tissue where SAR > SAR1tot. This function is only slightly modified. Averages instead of medians are used because they provide a more direct relationship with the absorbed powers.
17a: ρhs
Besides the SAR value in the first percentile, we assume that the density of hotspots determines the local risk to induce any kind of discomfort. A single small hotspot may not become clinically relevant, because of the high cooling effect of the surroundings. On the contrary, extended hotspots, or multiple hotspots close together are more likely to cause complaints. In order to quantify this, we defined a new indicator, namely: hotspot density, ρhs. A density must be evaluated over a certain volume. Therefore, we choose an averaging volume of a sphere with a 5cm radius. Although the exact size of 5 cm is an arbitrary choice, the rationale is that the radius is on one side smaller than the patient volume. On the other hand, the volume must be considerably larger than the average tetrahedron/voxel volume to be able to obtain a density.
The hotspot density at a certain point in the patient evaluates the hotspot volume in a sphere of 5 cm radius around that point. Hotspot density is a helper function to evaluate the clinical significance of a hotspot.
17-b: Ihs
Ihs, the hotspot intensity, the product of ρhs (17-a) and the absolute SAR level, is considered to provide the most predictive value to estimate the clinical relevance of a single hotspot.
17c: Ihs region
By averaging over a certain volume, the Ihs region, the local average hotspot intensity is introduced. This description is equivalent with SARtarg (9), and is useful for absolute intra- and inter-patient comparison.
17: Ihs ratio region
Ihs ratio region is the ratio between Ihs region and whole body average SAR. This indicator is particularly useful in model studies, if relative SAR distributions have to be compared (and the absolute power level is not known).
18: SARtarg compl ratio
As an objective function for SAR optimisation, we propose SARtarg compl ratio. This essentially is the Serration (10) that is constrained when patient complaints occur. This function is relatively insensitive to peaks in SAR and minimises hotspots by taking into account relative SAR in all regions where hotspots occur.
Quantitative evaluation of all quality indicators
Indicators to characterise the SAR distribution and their correlation to temperature increase
In , the correlations between all SAR indicators and T50targ are displayed. Each indicator is individually evaluated in its own graph, which has the number that is also used in Tables .
Figure 4. Correlation of all indicators with target temperatures. Each indicator is individually plotted in a separate subfigure. Above each subfigure, the indicator number is depicted. R2 correlation coefficients in each subfigure indicate the amount of correlation between the respective indicator and the corresponding T50targ value.
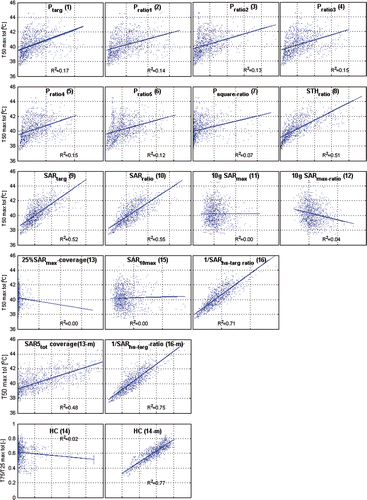
For all indicators, except the HC indicators, their correlation to the T50targ, the median target temperature, has been calculated. In every temperature calculation the input power was increased up to maximum patient tolerance (i.e. until the temperature in normal tissue reaches 44 °C).
The homogeneity coefficients, HC (14) and HCnew (14-m), are correlated to an equivalent temperature homogeneity expression of T75targ/T25targ, since these two indicators are not meant to provide information about median temperatures, but instead about temperature homogeneity.
Indicators 1 to 7 are all power-related. However, target and patient volumes are not taken into account. This causes the correlation coefficient to be very low.
The SAR-related indicators 8 to 10 therefore have a much better correlation coefficient, that is >0.5. Indicator 18, which is derived from indicator 10, has approximately the same R2 value as indicator 10.
Indicators 11 and 12, the 10 g average SARmax and SARmax ratio, again have almost no correlation with temperature. This can be understood by the fact that only the hotspot part is taken into account by these indicators, while the target SAR is left out.
Indicators 13 and 14 correlate poorly with temperature. However, their modified versions 13-m and 14-m do. This confirms the benefit of our decision to remove SARmax dependency from the indicators, and turn this into a volume-related term.
Indicator 15 is again SARmax dependent, and is correlating poorly with temperature.
Indicator 16 on the other hand, correlates very well, which slightly improves when modifying SAR50tot to average SAR (indicator 16-m).
The idea of multiplying SAR with a hotspot density does not appear to lead to a better correlation: indicator 17 does correlate, but worse than its SAR-only counterpart 16-m. Helper functions 17a, 17b, and 17c are not evaluated, since they describe a whole distribution over multiple tetrahedra, and thus are hard to summarise in a single number.
Ability of indicators to achieve the optimal temperature distribution
For a SAR indicator to be suitable for optimisation of the SAR distribution in an individual patient, it is not absolutely necessary to have a predictive value for temperature over a range of patients. An optimisation indicator should only have a predictive value within a single patient, i.e. optimisation using the indicator as a goal function should lead to an optimal T50targ. Therefore, we used each indicator as a goal function for optimisation in the same 36 patients. Just as in the previous correlation calculations, calculation of the temperature distribution is performed for each indicator with T50targ at the maximum patient tolerance (i.e. using the optimised phase and amplitude settings, power is increased until normal tissue temperature reaches 44 °C). shows the T50targ value, averaged over the 36 modelled patients, with standard errors added.
Figure 5. T50targ at the maximum patient tolerance, after optimisation with each indicator. The average T50targ over 36 patients is shown, together with SE of means as error bars.
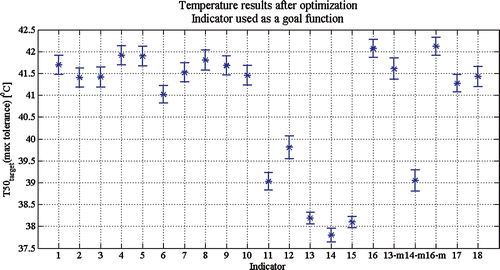
For optimisation modelling, it can be derived from that SARhs-targ ratio (16) and its modified version (16-m) are the most suitable indicators for optimisation, according to the calculated optimised T50targ values. They are the only indicators with a target T50 above 42 °C. Also the Pratios (4 and 5) with a squared SAR in the denominator, Ptarg (1), Psquare ratio(7), STHratio(8), SARtarg(9), and SAR5totcoverage(13-m) lead to good optimisation results, i.e. they are not significantly different (p > 0.05) from indicator 16-m, as shown with a two-sample t-test. Indicators 11, 12, and 15, which are not related to the target, obviously lead to very poor results. The 25%SARmax coverage (13) is, as stated in , generally not covering any target at all, and therefore also does not lead to a good result. The homogeneity coefficients (14 and 14-m) are not very suitable as goal functions because they only relate SAR values within the target. The modification of SARmax-related parameters appears to be beneficial also in optimisation. The practical value of the objective function is currently assessed in a clinical study.
Discussion
The scope of this study
All modelling presented in this study was done with a Sigma Hyperplan model of the BSD2000 Sigma 60 Citation[40],Citation[42]. However, we believe that the result of this study can be extended more generally, and is applicable to all deep hyperthermia treatments applied by a phased array system. In every calculated SAR distribution for deep hyperthermia, the same effects will play a major role: power absorption (and heating) of the target and hotspot reduction. Therefore, regardless of the chosen applicator, we believe that characterisation and optimisation in deep hyperthermia in the lower pelvic region will benefit from the proposed set of standard indicators to optimise and to compare SAR distributions.
Additionally, the focus on cervical cancer patient models limits the variety of locations of the tumour over the 36 patient models. However, we expect that the results found in this study are also valid in patients with other tumour locations, although the correlation between temperature and SAR indicator may differ.
SAR versus temperature modelling, pros and cons
With Sigma Hyperplan, both SAR and temperature distributions can be simulated. In many modelling studies temperature is used as the main quality indicator. This approach has the advantage of a direct link between modelling outcome and temperature measurements during treatment. Predicting temperature accurately is, however, a difficult task. The easiest approach is the solution of the bio-heat equation Citation[39]. This equation consists, among others, of a power-related term and a blood perfusion-related term. The blood perfusion-related term is only approximately known in a specific patient Citation[69]. Moreover, blood perfusion is a dynamic process that changes in time during the heat treatment, depending on both power and heating time. Obviously, an incorrect assumption of perfusion would lead to significant errors in the temperature predictions. The discrete vasculature model Citation[70],Citation[71] is another approach for calculating temperature. Although this model has a number of appealing features, its application in clinical practice is still focusing on relatively small volumes, due to the required detailed knowledge of the vessel anatomy. The same limitation with regard to accurate flow values exists. Furthermore, modelling packages provide only steady state solutions and neglect the dynamic behaviour of blood flow.
Instead of temperature, the SAR distribution might be considered as a prognostic factor. The 25%SARmax coverage (i.e. coverage of the tumour with at least 25% of maximum SAR) was found to be an important prognostic factor in earlier studies on superficial hyperthermia Citation[61],Citation[62]. Meyerson et al. Citation[61] demonstrated in 1990 for a group of 60 patients that coverage of the tumour by 25%SARmax was the most important factor predicting treatment outcome. Later, Lee et al. Citation[62] confirmed these findings in a different group of 151 patients with 196 lesions of recurrent breast cancer of the chest wall. They both found the complete response rate and the local tumour control to be significantly higher if the tumour was covered by 25%SARmax.
The interaction of the radiated electromagnetic field with several tissues having different permittivities and conductivities results in a power deposition pattern.
The calculated SAR distribution in a model strongly depends on these constants, but has only minimal sensitivity for changes in blood flow. This is an advantage of SAR as a prognostic factor.
From the extensive HTP as performed in this study, it may appear that the target SAR values are quite low in comparison to, for example, the SAR values in muscle. However, this corresponds to what we see during a treatment. The average temperature found in 444 deep hyperthermia patients was approximately 40.5 °C Citation[9]. The treatment limiting hotspots are expected to be approximately 44 °C when causing complaints. Hence, other regions are indeed often more heated than the target. This is an effect that is inherent to the use of interfering electromagnetic sources for heating the patient. Currently, work is in progress to improve targeting SAR to the tumour by using applicators with more antennas or higher frequencies.
At present, the most pressing problem concerns the translating of HTP from the monitor to the clinical application in the patient Citation[15],Citation[72]. For SAR this is due to a variety of causes, such as cross-coupling between antennas, inaccurate positioning of the patient, etc., for which currently clear efforts are undertaken to reduce their impact. For temperature prediction, also a more fundamental problem has to be solved such as integration of discrete vasculature in large models and the inclusion of the thermal dose-dependent behaviour of blood flow. In our opinion, especially the last argument demonstrates a need for good SAR optimisation algorithms. Later on, the gathered experience can be used to quickly proceed with temperature optimisation algorithms.
Validity of the electromagnetic models
In this study, all model calculations are performed in Sigma Hyperplan. A critical factor in the accuracy of electromagnetic modelling is the correct number of tetrahedra. At the start of this study we increased the number of tetrahedra from 100,000 to as much as 900,000, and checked at which number a stable solution was reached. We found that 200,000 Tetrahedra is enough to reach a reliable solution of the finite element method model, which is in line with other studies Citation[33],Citation[34],Citation[45]. Using more tetrahedra would require more computing time without providing a more accurate prediction. Especially when using HTP and optimisation in the clinic, the computing time is limited. We consider that online optimisation during a patient treatment must be less than 2 min, putting clear restrictions on the number of tetrahedra.
More generally, there is sufficient literature available supporting the validity of current available electromagnetic models used in HTP. A number of studies have demonstrated excellent subjective and objective performance of electromagnetic models to predict the SAR distribution in homogeneous phantoms Citation[34],Citation[36],Citation[37],Citation[73],Citation[74].
De Bruijne et al. Citation[37] demonstrated a dose difference of 2% and a distance to agreement of 2 mm between predicted and measured SAR distributions, which is equivalent to performance of modelling in radiotherapy.
Most suitable indicators
The results as shown in and both identify 16 m as the most favourable quality indicator. With respect to the other indicators the objective evaluation for the generic and the patient-specific do not identify the same indicator sequence, although the same metric for evaluation is used, namely T50targ. This is mainly because of the approach per individual patient model in optimisation, in contrast to the general, i.e. all patient, approach for characterisation indicators.
For both characterisation and optimisation, T50targ is used as the main metric for evaluation. The use of T50targ as an evaluation indicator has the advantage that it is not sensitive to possible temperature outliers that may disturb the evaluation, contrary to average target temperature. Other temperature indicators or thermal dose parameters derived from the whole data-set and insensitive for outliers may also be used.
From , the indicators that are most useful for characterisation, i.e. the indicators that correlate best with target temperature (T50targ), can be derived.
The correlations lead to the following list of most suitable indicators, listed in terms of their function:
Characterisation of SAR distributions: Target For target characterisation modelling, SARhs-targ ratio (16-m) and SARtarg (9) are the most useful indicators for relative or absolute SAR in target characterisation modelling. SARtarg (9) is most useful for absolute SAR value comparison, while SARhs-targ ratio (16-m) provides a generator power independent understanding of target SAR in relation to hotspots. Additionally, the redefined HC (14-m) that provides valuable additional information about SAR distribution within the target should be added.
Characterisation of SAR distributions: Hotspots For hotspot characterisation, the most useful indicator is SARhs-targ ratio (16-m). This indicator is very useful to compare the parts of the normal tissue with the highest SAR levels to the target SAR. Indicator 17, based on hotspot density appears to have less value for predicting temperatures. The correlation with T50 targ max tolerance of IHS ratio (17) is not an improvement in comparison to SARhs-targ ratio (16-m).
For optimisation modelling, SARhs-targ ratio (16-m) is the most suitable hotspot indicator. This indicator on the one hand maximises the target SAR, while on the other hand the SAR in the most absorbing parts of the patient is minimised. The optimisation results of indicators 1, 4, 5, 7, 8, 9, 13-m, and 16 are not significantly different from indicator 16-m.
Conclusions
We formulated subjective heuristic criteria and assessed the predictive value as a basis for selecting a set of quality indicators, useful in hyperthermia treatment planning for characterisation as well as optimisation of the SAR distribution during deep hyperthermia applied with the BSD2000 Sigma 60 applicator. Ideally the selected indicators are independent of the input power, target volume, and patient anatomy, and allow intra- as well as inter-patient comparison of results. Importantly, the selected indicators also facilitate comparison between institutes or systems. Such comparisons are, in our opinion, highly relevant to improve quality of heating widely.
Useful indicators for target SAR analysis are SARtarg (9), SARratio (10), SARhs-targ ratio (16-m), and HCnew (14-m). For hotspot analysis SARhs-targ ratio (16-m) is the most suitable indicator.
For optimisation, the best option for an objective function is the SARhs-targ ratio (16-m). This objective function attempts to increase average SARtarg, while the SAR in a selected hotspot region decreases. Indicators 1, 4, 5, 7, 8, 9, 13-m, and 16 can be considered also for optimisation.
This survey is a first step towards a more standardised set of quality indicators in characterisation and optimisation of SAR distributions. Undoubtedly, future research will lead to better quality indicators and goal functions in this area.
Acknowledgements
This work was supported by grant no. DDHK2003-2884 of the Dutch Cancer Society.
Declaration of interest: The authors report no conflicts of interest. The authors alone are responsible for the content and writing of the paper.
References
- Gellermann J, Hildebrandt B, Issels R, Ganter H, Wlodarczyk W, Budach V, Felix R, Tunn PU, Reichardt P, Wust P. Noninvasive magnetic resonance thermography of soft tissue sarcomas during regional hyperthermia: Correlation with response and direct thermometry. Cancer 2006; 107: 1373–1382
- Thrall DE, LaRue SM, Yu D, Samulski T, Sanders L, Case B, Rosner G, Azuma C, Poulson J, Pruitt AF, et al. Thermal dose is related to duration of local control in canine sarcomas treated with thermoradiotherapy. Clin Cancer Res 2005; 11: 5206–5214
- Maguire PD, Samulski TV, Prosnitz LR, Jones EL, Rosner GL, Powers B, Layfield LW, Brizel DM, Scully SP, Harrelson JM, et al. A phase II trial testing the thermal dose parameter CEM43T90 as a predictor of response in soft tissue sarcomas treated with pre-operative thermoradiotherapy. Int J Hyperthermia 2001; 17: 283–190
- Wust P, Stahl H, Dieckmann K, Scheller S, Löffel J, Riess H, Bier J, Jahnke V, Felix R. Local hyperthermia of N2/N3 cervical lymph node metastases: Correlation of technical/thermal parameters and response. Int J Radiat Oncol Biol Phys 1996; 34: 635–646
- van der Zee J, van Rhoon GC, Wike-Hooley JL. Clinically derived dose effect relationship for hyperthermia given in combination with low dose radiotherapy. Br J Radiol 1985; 58: 243–250
- Sherar M, Liu FF, Pintilie M, Levin W, Hunt J, Hill R, Hand J, Vernon C, van Rhoon G, van der Zee J, et al. Relationship between thermal dose and outcome in thermoradiotherapy treatments for superficial recurrences of breast cancer: Data from a phase III trial. Int J Radiat Oncol Biol Phys 1997; 39: 371–380
- Cox RS, Kapp DS. Correlation of thermal parameters with outcome in combined radiation therapy-hyperthermia trials. Int J Hyperthermia 1992; 8: 719–732
- Franckena M, Fatehi D, de Bruijne M, Canters RA, van Norden Y, Mens JW, van Rhoon GC, van der Zee J. Hyperthermia dose-effect relationship in 420 patients with cervical cancer treated with combined radiotherapy and hyperthermia. Eur J Cancer 2009; 45(11)1969–1978
- Thrall DE, Rosner GL, Azuma C, Larue SM, Case BC, Samulski T, Dewhirst MW. Using units of CEM 43°C T90, local hyperthermia thermal dose can be delivered as prescribed. Int J Hyperthermia 2000; 16: 415–428
- Fatehi D, van der Zee J, de Bruijne M, Franckena M, van Rhoon GC. RF-power and temperature data analysis of 444 patients with primary cervical cancer: Deep hyperthermia using the Sigma-60 applicator is reproducible. Int J Hyperthermia 2007; 23: 623–643
- Sugahara T, Van Der Zee J, Kampinga HH, Vujaskovic Z, Kondo M, Ohnishi T, Li G, Park HJ, Leeper DB, Ostapenko V, et al. Kadota Fund International Forum 2004. Application of thermal stress for the improvement of health, 15–18 June 2004, Awaji Yumebutai International Conference Center, Awaji Island, Hyogo, Japan. Final Report. Int J Hyperthermia 2008; 24: 123–125
- van der Zee J, Vujaskovic Z, Kondo M, Sugahara T. Kadota Fund International Forum 2004–Clinical group consensus*. Int J Hyperthermia 2008; 24: 111–122
- van Rhoon GC, Wust P. Introduction: Non-invasive thermometry for thermotherapy. Int J Hyperthermia 2005; 21: 489–495
- Lagendijk JJ. Hyperthermia treatment planning. Phys Med Biol 2000; 45: R61–76
- Dewhirst MW, Vujaskovic Z, Jones E, Thrall D. Re-setting the biologic rationale for thermal therapy. Int J hyperthermia 2005; 21: 779–790
- Nadobny J, Szimtenings M, Diehl D, Stetter E, Brinker G, Wust P. Evaluation of MR-induced hotspots for different temporal SAR modes using a time-dependent finite difference method with explicit temperature gradient treatment. IEEE Trans Biomed Eng 2007; 54: 1837–1850
- Weihrauch M, Wust P, Weiser M, Nadobny J, Eisenhardt S, Budach V, Gellermann J. Adaptation of antenna profiles for control of MR guided hyperthermia (HT) in a hybrid MR-HT system. Med Phys 2007; 34: 4717–4725
- de Bruijne M, Wielheesen DH, van der Zee J, Chavannes N, van Rhoon GC. Benefits of superficial hyperthermia treatment planning: Five case studies. Int J Hyperthermia 2007; 23: 417–429
- Canters R, Franckena M, Van der Zee J, Van Rhoon G. Complaint adaptive PD-optimization as a tool for HTP-guided steering in deep hyperthermia treatment of pelvic tumors. Phys Med Biol Dec 7, 2008; 53(23)6799–6820
- Kok H, Van Haaren P, Van de Kamer J, Zum Vörde Sive Vörding PJ, Wiersma J, Hulshof MC, Geijsen ED, van Lanschot JJ, Crezee J. Prospective treatment planning to improve locoregional hyperthermia for oesophageal cancer. Int J Hyperthermia 2006; 22: 375–389
- Rossetto F, Stauffer PR, Manfrini V, Diederich CJ, Biffi Gentili G. Effect of practical layered dielectric loads on SAR patterns from dual concentric conductor microstrip antennas. Int J Hyperthermia 1998; 14: 553–571
- Rossetto F, Stauffer PR. Effect of complex bolus-tissue load configurations on SAR distributions from dual concentric conductor applicators. Specific absorption rate. IEEE Trans Biomed Eng 1999; 46: 1310–1319
- Rossetto F, Stauffer PR. Theoretical characterization of dual concentric conductor microwave applicators for hyperthermia at 433 MHz. Int J Hyperthermia 2001; 17: 258–270
- Samaras T, Rietveld P, Van Rhoon G. Effectiveness of FDTD in predicting SAR distributions from the Lucite cone applicator. IEEE trans MTT 2000; 48: 2059–2063
- Paulides MM, Vossen SH, Zwamborn AP, van Rhoon GC. Theoretical investigation into the feasibility to deposit RF energy centrally in the head-and-neck region. Int J Radiat Oncol Biol Phys 2005; 63: 634–642
- Paulides MM, Wielheesen DH, Van der Zee J, Van Rhoon GC. Assessment of the local SAR distortion by major anatomical structures in a cylindrical neck phantom. Int J Hyperthermia 2005; 21: 125–140, Erratum in: Int J Hyperthermia 2005; 21:285
- Van der Gaag ML, De Bruijne M, Samaras T, Van der Zee J, Van Rhoon GC. Development of a guideline for the water bolus temperature in superficial hyperthermia. Int J Hyperthermia 2006; 22: 637–656
- de Bruijne M, Samaras T, Bakker JF, van Rhoon GC. Effects of waterbolus size, shape and configuration on the SAR distribution pattern of the Lucite cone applicator. Int J Hyperthermia 2006; 22: 15–28
- Paulides MM, Bakker JF, Chavannes N, Van Rhoon GC. A patch antenna design for application in a phased-array head and neck hyperthermia applicator. IEEE Trans Biomed Eng 2007; 54: 2057–2063
- Paulides MM, Bakker JF, Zwamborn AP, Van Rhoon GC. A head and neck hyperthermia applicator: Theoretical antenna array design. Int J Hyperthermia 2007; 23: 59–67
- Kok HP, Van Haaren PM, Van de Kamer JB, Wiersma J, van Dijk JD, Crezee J. High-resolution temperature-based optimization for hyperthermia treatment planning. Phys Med Biol 2005; 50: 127–141
- Van der Wal E, Franckena M, Wielheesen DHM, van der Zee J, van Rhoon GC. Steering in locoregional deep hyperthermia: Evaluation of common practice with 3D-planning. Int J Hyperthermia 2008; 24: 682–693
- Seebass M, Beck R, Gellermann J, Nadobny J, Wust P. Electromagnetic phased arrays for regional hyperthermia: Optimal frequency and antenna arrangement. Int J Hyperthermia 2001; 17: 321–336
- Gellermann J, Wust P, Stalling D, Seebass M, Nadobny J, Beck R, Hege H, Deuflhard P, Felix R. Clinical evaluation and verification of the hyperthermia treatment planning system hyperplan. Int J Radiat Oncol Biol Phys 2000; 47: 1145–1156
- Sreenivasa G, Gellermann J, Rau B, Nadobny J, Schlag P, Deuflhard P, Felix R, Wust P. Clinical use of the hyperthermia treatment planning system Hyperplan to predict effectiveness and toxicity. Int J Radiat Oncol Biol Phys 2003; 55: 407–419
- Van De Kamer J, De Leeuw A, Hornsleth SN, Kroeze H, Kotte AN, Lagendijk JJ. Development of a regional hyperthermia treatment planning system. Int J Hyperthermia 2001; 17: 207–220
- De Bruijne M, Samaras T, Chavannes N, Van Rhoon G. Quantitative validation of the 3D SAR profile of hyperthermia applicators using the gamma method. Phys Med Biol 2007; 52: 3075–3088
- Paulides M, Bakker J, Van Rhoon G. Electromagnetic head-and-neck hyperthermia applicator: Experimental phantom verification and FDTD model. Int J Radiat Oncol Biol Phys 2007; 68: 612–620
- Raaymakers BW, Van Vulpen M, Lagendijk JJ, De Leeuw AA, Crezee J, Battermann JJ. Determination and validation of the actual 3D temperature distribution during interstitial hyperthermia of prostate carcinoma. Phys Med Biol 2001; 46: 3115–3131
- Pennes H. Analysis of tissue and arterial blood temperature in the resting forearm. J Appl Physiol 1948; 1: 93–122
- Turner P, Schaefermeyer T. BSD-2000 approach for deep local and regional hyperthermia: Physics and technology. Strahlenther Onkol 1989; 165: 738–741
- van Rhoon GC, Van Der Heuvel DJ, Ameziane A, Rietveld PJ, Volenec K, Van Der Zee J. Characterization of the SAR distribution of the Sigma-60 applicator for regional hyperthermia using a Schottky diode sheet. Int J Hyperthermia 2003; 19: 642–654
- Turner P, Tumeh A, Schaefermeyer T. BSD-2000 approach for deep local and regional hyperthermia: Physics and technology. Strahlenther Onkol 1989; 165: 738–741
- van der Zee J, González González D, van Rhoon G, van Dijk JD, van Putten WL, Hart AA. Comparison of radiotherapy alone with radiotherapy plus hyperthermia in locally advanced pelvic tumours: A prospective, randomised, multicentre trial. Dutch Deep Hyperthermia Group. Lancet 2000; 355: 1119–1125
- Gabriel S, Lau R, Gabriel C. The dielectric properties of biological tissues II. Measurements in the frequency range 10 Hz to 20 GHz;. Phys Med Biol 1996; 41: 2251–2269
- Gellermann J, Göke J, Figiel F, Weihrauch M, Cho C, Weihrauch M, Cho CH, Budach V, Felix R, Wust P. Simulation of different positions for treatment of a presacral tumour. Int J Hyperthermia 2007; 23: 37–47
- Das S, Clegg S, Samulski T. Electromagnetic thermal therapy power optimization for multiple source applicators. Int J Hyperthermia 1999; 15: 291–308
- Seebass M, Beck R, Gellermann J, Nadobny J, Wust P. Electromagnetic phased array for regional hyperthermia: Optimal frequency and antenna arrangement. Int J Hyperthermia 2001; 17: 321–336
- Wust P, Seebass M, Nadobny J, Deuflhard P, Mönich G, Felix R. Simulation studies promote technological development of radiofrequency phased array hyperthermia. Int J Hyperthermia 1996; 12: 477–494
- Paulsen K, Geimer S, Tang J, Boyse W. Optimization of pelvic heating rate distributions with electromagmetic phased arrays. Int J Hyperthermia 1999; 15: 157–186
- Sandrini L, Vaccari A, Malacarne C, Cristoforetti L, Pontalti R. RF Dosimetry: A comparison between power absorption of female and male numerical models from 0.1 to 4 GHz. Phys Med Biol 2004; 49: 5185–5201
- Bardati F, Borrani A, Gerardino A, Lovisolo G. SAR optimization in a phased array radiofrequency hyperthermia system. IEEE Trans Biomed Eng 1995; 42: 1201–1207
- Wiersma J. Hyperthermia treatment planning. PhD thesis, 2000
- Wiersma J, Van Maarseveen R, Van Dijk J. A flexible optimization tool for hyperthermia treatments with RF phased array systems. Int J Hyperthermia 2002; 18: 73–85
- Kroeze H, Van de Kamer A, De Leeuw A, Lagendijk J. Regional hyperthermia applicator design using FDTD modeling. Phys Med Biol 2001; 46: 1919–1935
- Kuster N, Torres V, Nikoloski N, Frauscher M, Kainz W. Methodology of detailed dosimetry and treatment of uncertainty and variations for in vivo studies. Bioelectromagnetics 2006; 27: 378–391
- Recommended practice for determining the peak spatial-average specific absorption rate (SAR) associated with the use of wireless handsets–Computational techniques. Draft standard, IEEE-1529
- Keshvari J, Lang S. Comparison of radio frequency energy absorption in ear and eye region of children and adults at 900, 1800 an 2450 MHz. Phys Med Biol 2005; 50: 4355–4369
- Bahr A, Dorn H, Bolz T. Dosimetric assessment of an exposure system for simulating GSM and WCDMA mobile phone usage. Bioelectromagnetics 2006; 27: 320–327
- Bernardi P, Cavagnaro M, Pisa S, Piuzzi E. Specific absorption rate and temperature elevation in a subject exposed in the far-field of radio frequency sources operating in the 10-900 MHZ range. IEEE Trans Biomed Eng 2003; 50: 295–304
- ICNIRP Guidelines: Guidelines for limiting exposure to time-varying electric, magnetic and electromagnetic fields (up to 300 GHz). Health Phys 1998; 74: 494–522
- Meyerson R, Perez C, Emani B, Straube W, Kuske RR, Leybovich L, Von Gerichten D. Tumor control in long-term survivors following superficial hyperthermia. Int J Radiat Oncol Biol Phys 1990; 18: 1123–1129
- Lee H, Antell A, Perez C, Straube WL, Ramachandran G, Myerson RJ, Emami B, Molmenti EP, Buckner A, Lockett MA. Superficial hyperthermia and irradiation for recurrent breast carcinoma of the chest wall: Prognostic factors in 196 tumors. Int J Radiat Oncol Biol Phys 1998; 40: 365–375
- Neumann D, Stauffer P, Jacobsen S, Rosetti F. SAR pattern perturbations from resonance effects in water bolus layers used with superficial microwave hyperthermia applicators. Int J Hyperthermia 2002; 18: 180–193
- Johnson J, Neuman D, Maccarini P, Juang T, Stauffer PR, Turner P. Evaluation of a dual-arm archimedian spiral array for microwave hyperthermia. Int J Hyperthermia 2006; 22: 475–490
- Paulides MM, Bakker JF, Neufeld E, van der Zee J, Jansen PP, Levendag PC, van Rhoon GC. The HYPERcollar: A novel applicator for hyperthermia in the head and neck. Int J Hyperthermia 2007; 23: 567–576
- Gelvich E, Mazokhin V, Troshin I. An attempt at quantitative specification of SAR distribution homogeneity. Int J Hyperthermia 1996; 12: 431–436
- Van de Kamer JB, Van Wieringen N, De Leeuw AA, Lagendijk JJ. The significance of accurate dielectric tissue data for hyperthermia treatment planning. Int J Hyperthermia 2001; 17: 123–142
- Vaupel P, Kallinowski F, Okunieff P. Blood flow, oxygen and nutrient supply, and metabolic micro-environment of human tumors: A review. Cancer Res 1989; 49: 6449–6465
- Kotte A, Van Leeuwen G, Lagendijk J. Modeling the thermal impact of a discrete vessel tree. Phys Med Biol 1999; 44: 57–74
- Kotte A, Van Leeuwen G, De Bree J, van der Koijk J, Crezee H, Lagendijk J. A description of discrete vessel segments in thermal modelling of tissues. Phys Med Biol 1996; 41: 865–884
- Gellermann J, Weihrauch M, Cho CH, Wlodarczyk W, Fähling H, Felix R, Budach V, Weiser M, Nadobny J, Wust P. Comparison of MR-thermography and planning calculations in phantoms. Med Phys 2006; 33: 3912–3920
- Wust P, Beck R, Berger J, Fähling H, Seebass M, Wlodarczyk W, Hoffmann W, Nadobny J. Electric field distributions in a phased-array applicator with 12 channels: Measurements and numerical simulations. Med Phys 2000; 27: 2565–2579
- Kok P. Treatment planning for locoregional and intraluminal hyperthermia. PhD thesis, 2007