Abstract
Introduction: Motivation for this research was a patient with large and bulky melanoma lesions on a leg, treated with hyperthermia in a special set-up with an open water bolus and two opposing applicators. Treatment planning was used to find the most suitable heating method, comparing 70 MHz capacitive contact flexible microstrip applicators (CFMAs) and 70 MHz waveguides.
Methods: The first three sessions were performed with CFMA applicators; the last session with waveguides. Power and water temperature were adjusted to achieve clinically relevant temperatures. Finite difference time domain (FDTD) simulations were performed for a CFMA and waveguide on a fat-muscle geometry to compare effective field size (EFS) and effective heating depth (EHD). A CT scan of the patient's leg was automatically segmented into muscle, fat and bone; tumour lesions were outlined manually. Patient simulations were performed to evaluate the 3D heating pattern and to compare CFMAs and waveguides for equal power and water temperature.
Results: Hyperthermia treatment was well tolerated. Temperature measurements indicated mainly superficial heating with CFMAs. Simulated EHD was 2.1 and 2.4 cm for CFMA and waveguide, respectively and EFS was 19.6 × 16.2 cm2 and 19.4 × 16.3 cm2. Simulation results showed a better tumour coverage using waveguides; absorbed power in the tumour was ∼75% higher with waveguides and absorption in fat was approximately twice as high with CFMAs. Simulations showed that a relatively high water temperature (∼42°C) improves the overall temperature distribution.
Conclusion: CFMAs and waveguides have a similar EFS and EHD, but for large extremity lesions, the performance of 70 MHz waveguides is favourable compared to 70 MHz CFMA applicators.
Introduction
Hyperthermia has proven to be an effective anti-cancer therapy when applied in combination with radiotherapy and/or chemotherapy Citation[1–3]. Examples of tumour sites for which the efficacy of hyperthermia has been shown are chest wall recurrences Citation[4], Citation[5] and recurrent malignant melanoma Citation[6], particularly when the radiation dose is limited due to previous irradiation.
The widely accepted therapeutic thermal dose is one hour at 43°C Citation[7] for at least 90% of the tumour. During treatment, imminent overheating of normal tissue (hot spots) can occur due to inhomogeneous power absorption and perfusion at tissue interfaces, which limits the amount of power that can be applied. In clinical practice, these hot spots and systemic stress at high power cause patient discomfort and are often the limiting factors for achieving the goal tumour temperatures. Regarding the difficulties in optimal tumour heating, achieving tumour temperatures in the range of 40–45°C is considered acceptable in clinical practice. A relation between temperature and clinical outcome was observed in some studies Citation[8–10], so it remains important to pursue an optimal thermal dose.
Important factors for achieving adequate tumour temperatures are the effective field size (EFS) and effective heating depth (EHD) of the applied applicator type. The EHD of an electromagnetic field decreases with increasing frequency. Antennas operating at a relatively high frequency (≥434 MHz) Citation[11–13] are normally used for superficial tumours, such as chest wall recurrences and melanoma. Applicators operating at a lower frequency (∼60–150 MHz) Citation[14–16] are applied for deep-seated tumours, such as cervical and bladder carcinoma.
At the Academic Medical Center (AMC), superficial hyperthermia is performed using contact flexible microstrip applicators (CFMAs) operating at a frequency of 434 MHz Citation[11] and deep-seated tumours are heated using the locoregional AMC-4 Citation[14] or AMC-8 Citation[17] waveguide system, both operating at 70 MHz. CFMA antennas are flexible, such that they can be bent in order to fit the curved body contour. For superficial lesions with more than 3 cm depth penetration, a CFMA applicator operating at 70 MHz has been developed Citation[11], combining flexibility with a good penetration depth.
In clinical practice, temperature information is very limited. Several non-invasive thermometry techniques such as radiometry Citation[18], ultrasound Citation[19] and MRI Citation[20], Citation[21] are under development. These techniques are promising, but not yet accurate enough to replace the customary temperature measurements. Furthermore, MRI is very difficult to combine with the applicators used at our department, since they consist of metal structures. Hyperthermia treatment planning can also be useful to obtain more insight in SAR and temperature distributions resulting from different types of antennas. It can provide insight in the feasibility to heat a specified target volume with a specific applicator type Citation[22] and might be helpful to improve the design of antenna systems Citation[23], Citation[24].
Motivation for this research was a patient with multiple large and bulky melanoma lesions on a leg, treated with hyperthermia in a special set-up with an open water bolus and two opposing applicators. A frequently used technique in treatment of extremity lesions is hyperthermic isolated limb perfusion (HILP) Citation[25–28]. However, because of the number and sizes of the tumour lesions of this patient, isolated limb perfusion was not adequate and the patient was treated with external radiotherapy and hyperthermia. Limb removal can in some cases improve the quality and extent of life, but this was also not an option for this patient because of distant metastases.
In this paper, treatment planning is used for a retrospective study to assess the clinical effectiveness of 70 MHz capacitive CFMAs and 70 MHz waveguides, as applied during treatment of these large extremity lesions. Temperature data from the treatment are shown and the simulated SAR distributions in a fat–muscle geometry using a CFMA or a waveguide will be compared as well as the simulated SAR and temperature distributions in the patient anatomy.
Methods
Applicator set-up and hyperthermia treatment
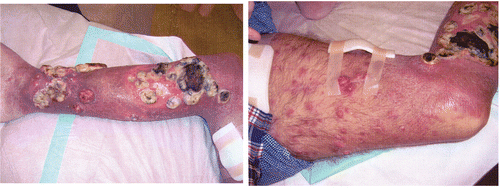
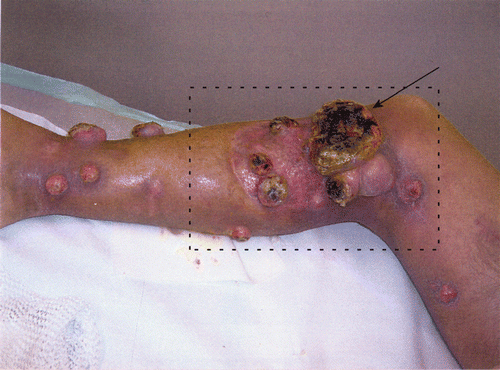
In January–February 2007, a 45-year-old male patient was treated with hyperthermia combined with radiotherapy (35 Gy, with a 5 Gy fraction dose) for multiple recurrent melanoma lesions on the right leg (). The treatment was palliative, aiming at reduction of the tumour volume and reducing discomfort. The initial target volume for radiotherapy was the largest tumour volume (near the knee; see ).
Figure 1. A patient with multiple large melanoma lesions on the right leg. The box indicates the radiotherapy target volume. The arrow points to the entrance point of the invasive thermometry probe during treatment 3.
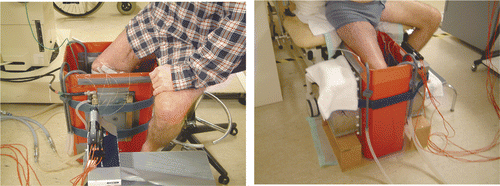
Two opposing applicators were needed to fully cover the tumour area and a frequency of 70 MHz was selected to assure an adequate penetration depth in the lesions. The patient had a weekly hyperthermia treatment for four weeks. The first three treatments were performed with two capacitive 70 MHz CFMA applicators (aperture ∼20 × 29 cm2). Measurements during treatment showed a sub-optimal tumour coverage with these applicators and for the last treatment two rectangular 70 MHz waveguides (aperture ∼20 × 34 cm2) similar to those used with the AMC-4 and AMC-8 systems were applied. A water bolus between the applicator and tissue is normally applied for optimal coupling of fields to tissue and cooling of the skin. Due to the number and bulkiness of the lesions, optimal contact with a water bolus over the complete tumour surface could not be achieved. To solve this problem, a special treatment set-up was created for this patient. A 2-mm thick PVC box was made with dimensions of 40 × 25 × 60 cm3 (length × width × height). At both long sides of the box, an opening of 21 × 30 cm2, 10 cm from the upper side, was made such that the CFMA applicators could be placed in this opening. A thin-walled transparent polyethylene bin bag was placed in this box and filled with tap water. The bolus water was circulated via inlet and outlet hoses. This way, an open water bolus system was created.
For treatment with waveguides the opening in the box was enlarged to 21 × 34.5 cm, 9.5 cm from the upper side of the box. Waveguides were placed against the PVC box and two wooden boxes were constructed to support the waveguides. The treatment set-up with the CFMA antennas and with the waveguides is shown in .
All treatments were performed with equal amplitudes for both applicators and no phase differences. shows the applied power and water bath temperatures for each treatment. The output power of the antennas and the temperature of the water bath was varied in order to find a suitable combination for achieving a clinically relevant temperature distribution, especially during the first two treatments. The maximum power that can be applied for CFMA applicators is 300 W, to avoid overheating of the antenna. The efficiency was determined using FDTD simulations and ΔT measurements. For homogeneous phantoms with well-known properties, the calculated SAR distributions were scaled with a factor that was determined from ΔT measurements. The efficiency of the CFMA applicators and the waveguides was ∼40% and ∼70%, respectively.
Table I. Applied power per antenna and water bath temperatures for each treatment. Values at the start of treatment as well as the final values are listed.
To monitor the tumour temperatures, six multi-sensor thermocouple probes were used. Two 14-point thermocouple probes with a sensor spacing of 0.5 cm were placed superficially at the largest tumour volume and the other four 14-point thermocouple probes were circumferentially placed over the shin, the calf and the left and right side of the leg. For treatment 3, one of the probes was inserted in the largest tumour volume and the invasive length was 6.3 cm. Temperatures were measured during power off, in order to avoid disturbances Citation[29]. The applied duty-cycle consisted of 25 s power on, followed by 5 s power off, after which the temperatures were measured. According to protocol, the steady-state period of 60 min started as soon as one measurement point at tumour location reached 41°C, or alternatively after a power on period of 30 min.
CFMA and waveguide applicators
A CFMA applicator consists of two coplanar active electrodes and a shield electrode Citation[11]. The shield electrode and the active electrodes are separated by a thin layer of fluoroplastic substrate. The electrodes are separated by means of a slot of approximately 5 mm. The microstrip line is excited by a feeding pin of a coaxial cable. The type of CFMA applicator applied in this study is referred to as a capacitive type, which means that the active electrodes with the shield electrode compose two capacitors. The capacitors are connected by a microstrip inductance L, making up a resonant circuit tuned at the operating frequency Citation[11]. The electrodes are incorporated in a silicon frame, integrated with a thin silicon water bolus.
The rectangular waveguide is a hollow metal box to guide electromagnetic waves. Electromagnetic fields are generated via a choke over the short side, which is connected with a coaxial cable to the generator system. The waveguide was filled with distilled water.
Hyperthermia treatment planning
The treatment planning software used at the AMC applies the finite difference time domain (FDTD) method to solve Maxwell's equations Citation[30]. The FDTD program uses the graphics card for fast computation of the E-fields Citation[31]. To truncate the computational domain, a perfectly matched layer Citation[32] was used as an absorbing boundary condition.
Phantom simulations
First, FDTD simulations were used to compare the heating patterns in a flat fat–muscle phantom. A CFMA applicator and a waveguide with a water bolus thickness of 1 cm was positioned on a block of muscle tissue with a 1 cm fat layer on top (see ). The water bolus was filled with distilled water. To avoid fringing fields Citation[33], the waveguide was modelled with a 40-cm long water bolus at the short side of the waveguide and just covering the flanges in the other direction. This is analogous to the bolus size applied for locoregional hyperthermia with these waveguides. The resolution of these phantom simulations was 2 × 2 × 2 mm3. Since the microstrip inductance of the CFMA applicator is only meant for tuning, it was not modelled. The source point for FDTD calculations was positioned between an active electrode and the shield electrode of the CFMA. For the waveguide, the source point was positioned between the choke and the side wall. The distance between the choke and the waveguide's back wall was modelled as 3 cm. The depth of the waveguide was 12 cm, which corresponds to a quarter wave length in water. shows a schematic picture of the modelled CFMA applicator and the waveguide on a flat fat–muscle phantom.
Figure 3. Schematic representation of the modelled CFMA and waveguide applicator on a fat–muscle geometry. Drawings are not to scale.

After calculation of the E-field distribution, the SAR distribution can be determined using the relation:where σ (S m−1) is the electrical conductivity and ρ is the density (kg m−3). The values can be found in .
Table II. Dielectric and thermal properties used for the simulations; conductivity (σ [S m−1]), relative permittivity (εr [−]), density (ρ [kg m−3]), specific heat capacity (c [J kg−1°C−1]), thermal conductivity (k [W m−1°C−1]) and perfusion (Wb [mL 100 gr−1 min−1]).
Patient simulations
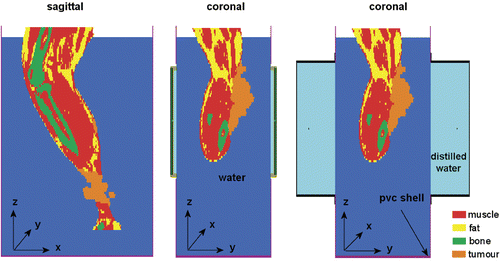
For patient simulations, a CT scan of 53-cm length was made with a slice thickness of 5 mm; the voxel size in transversal direction was 0.9375 mm. The tumour lesions were outlined manually and the rest of the data set was segmented automatically into fat, muscle and bone tissue by applying thresholding on a histogram of the Hounsfield units of the CT data set Citation[34]. The segmented data set was downscaled to a resolution of x × y × z = 2 × 2 × 5 mm3 using the ‘winner take all’ principle Citation[35], which means that a low resolution voxel is assigned the dielectric and thermal properties of the most frequently occurring tissue type of the corresponding high resolution voxels. The 5 mm spacing corresponds to the CT slice thickness. Dielectric and thermal properties were obtained from literature Citation[36], Citation[37] and are listed in . CFMA or waveguide applicators were positioned at both sides of the PVC box, according to the description above. Sagittal and coronal cross sections of the modelled set-up are shown in .
Figure 4. Sagittal and coronal cross sections of the modelled set-up of the leg in a PVC box with CFMA (centre) and waveguide (right) applicators.
After computation of the E-field distribution and power scaling, the temperature distribution was calculated using the conventional bio heat transfer equation Citation[38]:with c the specific heat capacity (J kg−1°C−1) and ρ the tissue density (kg m−3). The term ∇ · (k ∇ T) represents the heat conduction in tissue, with k (W m−1°C−1) the thermal conductivity of tissue. The second term on the right hand side models the perfusion, with cb the specific heat of blood, Wb (kg m−3 s−1) the volumetric perfusion rate and Tart the local arterial or body core temperature (37°C). The power density added by the hyperthermia system is represented by P (W m−3). To take into account the water bolus cooling, a fixed boundary condition was used (i.e. the water was kept at a constant temperature).
Analysis
Treatment data for CFMA and waveguide applicators were evaluated. Steady-state temperatures were expressed as T10, T50 and T90, i.e. the temperature at least achieved in 10%, 50% and 90% of the tumour. The value of T90 is generally considered a good representative of the minimum temperature. Treatments 3 (CFMAs) and 4 (waveguides) were examined in more detail. These treatments are most suitable to compare as the first two treatments showed a strong learning curve.
To compare the heating patterns of the applicators in the simple fat–muscle geometry, the effective field size (EFS), i.e. the area covered by the 50% iso-SAR contour Citation[39] was compared at 1 cm depth in muscle, i.e. 1 cm below the fat layer. For this purpose, the SAR distributions were scaled to the maximum value at 1 cm depth in muscle, which was normalised to 100%. Furthermore, the absorbed power in the fat layer was evaluated. The effective heating depth (EHD), which is defined as the distance below 1 cm at which the relative power deposition has decayed to 50% of the maximum value at 1 cm depth in the muscle Citation[39], was also compared for the CFMA and waveguide applicators.
Patient simulations were evaluated for the third and fourth treatment. For this comparison, the absorbed power in water and tissue was normalised to the total amount of power applied at steady-state. A correction factor for the efficiency of the applicators and the duty cycle was taken into account, so the total absorbed power in water and tissue was 200 and 465 W for treatments 3 and 4 respectively. A constant water bath temperature of 42° and 39.5°C, respectively, was assumed in the simulation. Simulated temperature distributions were determined at steady-state and T10, T50 and T90 were determined for the complete tumour volume.
Since the water bath temperature, the applied power and the efficiency for both types of applicators were different during treatments, simulations with an equal amount of absorbed power and equal water temperature were also performed, in order to make a direct theoretical comparison between the two applicator types. For this comparison, the total absorbed power in water and tissue was scaled to 200 W for both applicator types, which is below the power limitation of the CFMA antennas. To demonstrate the impact of the water bath temperature on the achieved temperatures, the temperature of the water bath was set to 38°, 40°, 42° and 44°C. The average absorbed power in the tumour, muscle and fat tissue was compared for CFMA applicators and waveguides. The simulated steady-state temperatures T10, T50 and T90 were compared for the different water bath temperatures.
The homogeneity of the temperature distributions was determined by the overall temperature heterogeneity coefficient (HC) Citation[40]:where Tcore is the body core temperature (usually 37°C).
Results
Treatment data
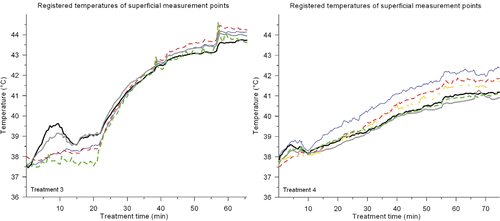
The indexed steady-state temperatures T90, T50 and T10 for all treatments, determined over all superficial measurement points, are listed in . The values for T90, T50 and T10 for treatment 3 were 40.66°, 42.9° and 44.06°C, respectively, determined over all superficial and invasive measurements. Treatments 1–3 show increasing tumour temperatures as a result of increasing power and water temperature. The T90 of treatment 4 was moderate, despite the relatively high amount of power, which can be explained by the relatively low water temperature used. Tumour temperatures were measured mainly superficially, which means that the water temperature has a strong influence on the reported tumour temperatures. Furthermore, these temperature data cannot be compared directly, because of differences in the water bath temperature and applied power.
Table III. Indexed steady-state temperatures for all four treatment sessions. Values were determined over all superficial measurement points. Because of the difference in applied power and water temperature for the different treatments, the indexed temperatures are not directly comparable (see text for details).
To examine the reported temperatures more accurately, the average temperature of each superficial thermometry probe during treatment 3 and 4 is plotted in . The temperature of the water bath started at approximately 38°C for treatments 3 and 4, and was increased to ∼42°C and ∼39.5°C, respectively. During treatment 3 the temperature profiles start to level off at ∼20 min and temperatures are still fairly low. After 21 min the temperature of the water bath was gradually increased and a strong response of the registered temperatures can be observed. During treatment 4 there was a steady increase of the temperatures. No strong response to the change in water temperature after approximately 37 min was observed, which suggests a more power-related temperature rise.
Figure 5. Average temperatures for each superficial thermocouple probe during treatment 3 (left) and treatment 4 (right). Five superficial thermometry probes were used in treatment 3, and six in treatment 4. The small temperature decrease for two thermocouple probes in treatment 3 after ∼10 min was caused by generator failure of one applicator for ∼5 min. The small temperature decrease in treatment 4 after ∼8 min was caused by replacing a generator. In treatment 3, the water bath temperature was increased after 21 min; in treatment 4 the water temperature was gradually increased after approximately 37 min.
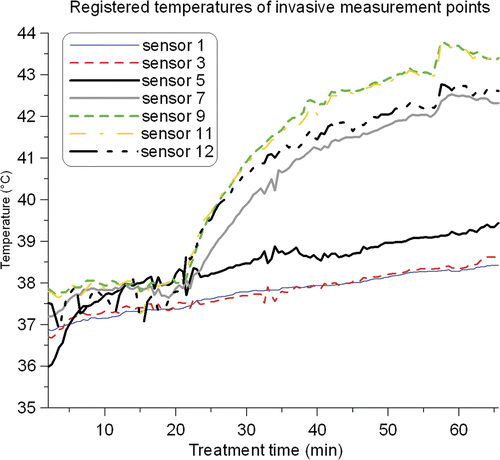
The temperatures of the invasive thermocouple probe registered during treatment 3 are depicted in . The tip of the thermocouple probe is represented by sensor 1. From it is clear that the temperatures registered by the thermosensors deeper in the tumour tissue were fairly constant over the duration of the treatment (e.g. sensor 1), while the more superficially located thermosensors (e.g. sensor 11) showed a strong increase in temperature after increasing the water bath temperature. This confirms the assumption that the strong increase in temperatures observed after ∼21 min in was mainly caused by the increased water temperature. The deepest thermocouple sensors did not achieve temperatures in the clinically relevant range. Thus, despite the high reported temperatures for treatment 3, the temperature rise deeper in the tumour was moderate. These sub-therapeutic temperatures in depth were the reason to change from CFMAs to waveguides during the last treatment.
Toxicity and response
Initially, the hyperthermia treatment was well tolerated. No hot-spot-related pain complaints were reported. During the first treatment the patient started to feel weak after about 30 min at steady state, possibly caused by decreasing blood pressure due to vasodilatation and redistribution of perfusion. Therefore, the steady-state period of 60 min, as prescribed by the protocol, was not completed. The other treatments were prematurely stopped due to a steadily decreasing blood pressure. The total times at steady-state were 31, 59, 38 and 44 min for the four treatments respectively. Insertion of the invasive thermometry probe at the start of treatment 3 was quite troublesome and resulted in haemorrhages and blood pressure drop. Therefore, during the last treatment again only superficial measurements were performed.
At seven weeks after treatment, the sizes of the largest tumour volumes had decreased significantly and necrotic regions were observed. The lesions outside the radiotherapy field (e.g. the distal lower leg) were progressive (). The patient died in May 2007 after progression of distant metastases. Thus, the clinical benefit of the achieved tumour regression was limited.
Phantom simulations
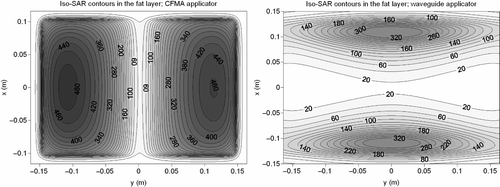
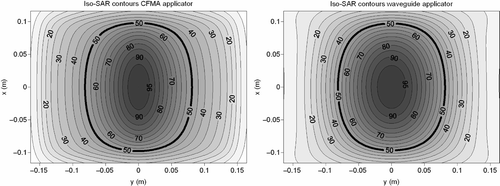
Contour plots of the simulated relative SAR distributions at 1 cm depth in muscle tissue, resulting from the CFMA and waveguide applicator heating the fat–muscle phantom are shown in . These pictures show that the heating pattern in the muscle tissue is comparable. The effective field size was 19.6 × 16.2 ≈ 318 cm2 and 19.4 × 16.3 ≈ 316 cm2 for the CFMA applicator and the waveguide, respectively. A similar EFS is expected since the applicator sizes are approximately equal and the operating frequency is the same. The simulated effective heating depth was also comparable for both applicator types: 2.1 and 2.4 cm for the CFMA applicator and the waveguide, respectively.
Figure 8. Simulated iso-SAR contours for the CFMA (left) and waveguide (right) applicator in a fat–muscle structure. The plane of these contours is located in muscle, one centimetre below the fat layer.
Although the SAR patterns in muscle tissue, the EFS and the EHD were comparable for both applicators, there was quite a large difference in power absorption in the fat layer. The absorbed SAR in the fat layer was much higher for the CFMA applicator than for the waveguide, as can be seen in . This figure shows the iso-SAR contours at the transversal plane at the centre of the fat layer. The same normalisation was applied as in : SAR values were normalised to 100% in muscle, 1 cm below the fat layer. The maximum SAR value at the centre of the fat layer is roughly 35% higher for the CFMA applicator in comparison to the waveguide. This high absorption in the superficial fat layer is caused by the relatively high z-component of the field Citation[41] and is in correspondence with an earlier publication by Gelvich et al. Citation[42].
Patient simulations
Treatment simulations
Simulated steady-state tumour temperatures for treatments 3 and 4 determined over the complete tumour volume are listed in . The simulated temperatures showed a better tumour heating in the case of treatment 4. For example, the difference in T90 was 0.8°C and for T50 a difference of 2.7°C was found in favour of the waveguides. These simulation results qualitatively confirm that the water temperature during treatment 3 had a strong impact on the measured temperatures and caused a mainly superficial temperature rise.
Table IV. Simulated steady-state tumour temperatures for treatments 3 and 4, determined over the complete tumour volume. A constant power and water bath temperature was assumed.
Theoretical comparison of the two applicator types
To make a direct theoretical comparison between the two applicators, an ideal situation with an equal amount of total absorbed power of 200 W in the patient and water bath was simulated. The temperatures of the water bath were kept constant at 38°, 40°, 42° and 44°C.
The simulation with CFMA applicators showed a larger amount of power absorbed in the water bath, which was filled with tap water. The absorbed power in the leg was 94 W and 122 W for the CFMAs and waveguides, respectively. This means that ∼30% more power is absorbed in the patient when waveguides are applied.
The simulated average SAR in tumour, muscle and fat tissue is listed in . From these results, it becomes clear that waveguides provide a more efficient absorption in the target volume. The absorption in tumour tissue is about 75% higher for the waveguides, while the total amount of absorbed power in the leg and the water bath was equal for both cases. The absorption in fat tissue was more than twice as high with CFMA applicators in comparison to waveguides.
Table V. Average simulated SAR values (W/kg) in tumour, muscle and fat tissue, using CFMA applicators or waveguides.
The simulated steady-state tumour temperatures T10, T50 and T90 over the complete tumour volume and the maximum temperatures achieved in tumour, muscle and fat tissue are listed in . The temperatures in show that the water bath temperature has a strong influence on the achieved steady-state temperatures. With a water bath temperature of 38°C, the T90 was also ∼38°C for both the waveguides and the CFMA applicators, which is below the clinically relevant range. The difference in T50 was about 1°C, in favour of the waveguides, indicating a more efficient tumour heating. The corresponding heterogeneity coefficient was rather high. Increasing the water bath temperature improves the value of T90. With a relatively high water bath temperature, the waveguide applicators yield a higher and more homogeneous temperature distribution in comparison to CFMA applicators. When the water temperature increased from 38°C to 42°C, the value of T90 determined over the complete tumour volume, increased approximately 1° and 2°C with CFMA applicators and waveguides, respectively.
Table VI. Simulated steady-state temperatures, determined over the complete tumour volume, heterogeneity coefficients and maximum temperatures achieved in tumour, muscle and fat tissue with CFMA applicators and waveguides.
When using waveguides, maximum temperatures in normal tissue were about 0.5–1°C lower than the maximum tumour temperature. With CFMAs, the maximum temperature in muscle tissue was about half a degree higher than the maximum tumour temperature for a water temperature of 38–40°C and comparable or slightly lower for higher water bath temperatures of 42–44°C.
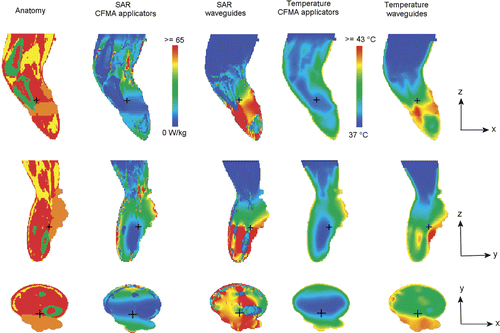
Coronal, sagittal and transversal cross sections of the simulated SAR and temperature distributions with an absorbed power of 200 W and a water bath temperature of 42°C are shown in . This picture clearly shows that the overall tumour coverage is better with waveguides, compared to CFMA applicators.
Figure 10. Cross sections of the simulated SAR and temperature distributions with CFMA and waveguide applicators. In both cases, the water bath temperature was 42°C and the absorbed power 200 W in tissue and water bath. The colours red, yellow and green in the anatomy represent muscle, fat and bony tissue, respectively and tumour tissue is orange. The small black cross hair indicates the location of the cross sections.
Discussion
In this study, hyperthermia treatment planning was used to compare capacitive 70 MHz CFMA applicators, and radiative 70 MHz waveguides, as applied for a patient with large and bulky melanoma lesions on the right leg. SAR and temperature distributions were simulated in the patient anatomy and temperature data from treatment were shown. The waveguides provided a more favourable tumour coverage.
During treatments, temperatures were measured only superficially; with the exception of treatment 3, where one of the thermometry probes was placed invasively. Insertion of this thermometry probe was quite troublesome and resulted in haemorrhages and blood pressure drop. Therefore, during the last treatment again only superficial measurements were performed. The CT scan used for treatment planning was a pre-treatment scan, so the exact location of the superficial and invasive thermometry probes is unknown. This implies that a quantitative comparison between results from treatment and treatment planning is difficult. Clinically achieved tumour temperatures T90, T50 and T10, were determined using the measured temperatures during steady-state. In the simulations, temperature data for the complete tumour volume were available to determine T90, T50 and T10. Therefore, clinical and simulated T90, T50 and T10 cannot be compared quantitatively. Furthermore, perfusion changes during treatment can be large, which is shown by the fact that the patient started to feel weak during treatment; probably caused by vasodilatation and perfusion. This also implies that simulation results should not be interpreted quantitatively, since average perfusion values from literature were used for modelling. Nevertheless, both treatment and simulation results showed a better tumour coverage when waveguides were used.
Skin temperatures during treatment are influenced by both the local power deposition and the water temperature. The thermal impact of the water bolus was modelled as a constant water temperature, and heat transfer between water and tissue by thermal conduction. This way, the simulated skin temperatures are also influenced by both the local power deposition and the water temperature. A convective boundary condition would have been more accurate if the exact heat transfer coefficient during treatment had been known. The approach using a constant water temperature may yield results differing from the results when the true but unknown heat transfer coefficient has been modelled, but it does allow a qualitative but fair assessment of the impact of the water temperature.
From it can be observed that the power focus is not steered to the largest tumour lesion. Repositioning of the leg and/or phase/amplitude steering would be possible to realise this. However, since the lesions are widely spread over the leg (see ) the whole lower leg was actually considered as the target during treatment, and equal amplitudes and phases were chosen. Therefore, to compare the performance of the two different applicators in a numerical model, equal antenna settings were applied as well.
In the numerical simulations, a more favourable power absorption was found for the waveguides, compared to the CFMA applicators. Large differences in power absorption between radiative and capacitive systems were also observed for other systems. Kroeze et al. Citation[43] have published a comparison between a locoregional 8 MHz capacitive (Thermotron RF8) and 150 MHz cavity slot radiative (RHOCS) hyperthermia system. In their study, simulations were performed for heating of the pelvic region and results also showed a better tumour coverage with the radiative system and a much higher power absorption in fat tissue with the capacitive system.
Despite the more favourable power absorption with waveguides, the use of CFMA applicators did not result in clinically apparent normal tissue hot spots during treatment. In contrast to waveguides, for the CFMA applicators the amount of applied power is technically limited to 300 W per channel. The efficiency of CFMA applicators is also much lower than for waveguides (∼40% and 70%, respectively). This means that the effectively applied power for each channel is limited to 120 W. Thus, the absence of hot spots during treatments can possibly be explained by the low amount of power and, as a consequence, the relatively low temperatures in depth (see ). In the simulations with CFMA applicators it was shown that the maximum temperature in normal tissue was not always lower than the maximum tumour temperature. This implies that when the amount of applied power is not a practical limitation, the power can possibly be limited by the normal tissue temperatures. This is in contrast to the simulations with waveguides, where the maximum normal tissue temperature was lower than the maximum tumour temperature.
Simulations showed that the water bath temperature has a strong impact on the achieved tumour temperatures. A relatively low amount of power was assumed to take into account the power limitation of CFMAs. For the waveguide simulations a water temperature of 44°C yielded maximum tumour temperatures close to the usually maximum tolerable temperature of 45°C. Waveguides do not have this power limitation and when a higher power level will be applied for waveguides in combination with a high water bath temperature, this will possibly result in pain complaints. Thus, when a relatively high power level is applied for waveguides, a lower water bath temperature will be necessary to avoid (superficial) tissue damage. This lower water temperature can in turn affect the T90. When that is the case, it is more favourable for the overall temperature distribution to decrease the power level instead of the water temperature.
A relatively low water temperature can sometimes be preferable, for example in cases where the surface needs to be spared and/or to move the temperature maximum to depth, thereby improving the thermal penetration depth. For the case presented in this paper, the tumour lesions were very large and bulky, which means that the outer shell represents a relatively large volume. This can be compared with a sphere, where the volume is proportional to the radius cubed. The fact that the outer shell of the lesions represents a relatively large volume explains that a higher water temperature yielded a higher T90. A sufficiently high T90, which usually represents the minimum temperature, is important for treatment outcome Citation[8]. Thus, for this kind of application, a higher water temperature is favourable for effective tumour coverage.
Conclusion
Simulations for a fat–muscle phantom showed that 70 MHz waveguides and CFMA applicators have a similar penetration depth and effective field size, but the SAR distribution in the fat layer is more favourable for the waveguides. For large extremity lesions that need to be treated in an open water bolus set-up, 70 MHz waveguides also provide a more favourable tumour coverage compared to 70 MHz CFMA applicators. Simulations showed a higher power absorption in tumour tissue (∼75%) for waveguides. Power absorption in fat tissue was roughly twice as high for CFMA applicators, compared to waveguides.
Acknowledgements
This study was supported by the Dutch Cancer Society.
Declaration of interest: The authors report no conflicts of interest. The authors alone are responsible for the content and writing of the paper.
References
- Van der Zee J, Gonzalez GD, Van Rhoon GC, van Dijk JDP, van Putten WLJ, Hart AA. Comparison of radiotherapy alone with radiotherapy plus hyperthermia in locally advanced pelvic tumours: A prospective, randomised, multicentre trial. Dutch Deep Hyperthermia Group. Lancet 2000; 355: 1119–1125
- Perez CA, Kuske RR, Emami B, Fineberg B. Irradiation alone or combined with hyperthermia in the treatment of recurrent carcinoma of the breast in the chest wall: A nonrandomized comparison. Int J Hyperthermia 1986; 2: 179–187
- Sugimachi K, Kuwano H, Ide H, Toge T, Saku M, Oshiumi Y. Chemotherapy combined with or without hyperthermia for patients with oesophageal carcinoma: A prospective randomized trial. Int J Hyperthermia 1994; 10: 485–493
- Vernon CC, Hand JW, Field SB, Machin D, Whaley JB, Van der Zee J, van Putten WLJ, Van Rhoon GC, van Dijk JDP, Gonzalez GD, et al. Radiotherapy with or without hyperthermia in the treatment of superficial localized breast cancer: Results from five randomized controlled trials. International Collaborative Hyperthermia Group. Int J Radiat Oncol Biol Phys 1996; 35: 731–744
- Jones EL, Marks LB, Prosnitz LR. Point. Hyperthermia with radiation for chest wall recurrences. J Natl Compr Canc Netw 2007; 5: 339–344
- Overgaard J, Gonzalez GD, Hulshof MCCM, Arcangeli G, Dahl O, Mella O, Bentzen SM. Randomised trial of hyperthermia as adjuvant to radiotherapy for recurrent or metastatic malignant melanoma. European Society for Hyperthermic Oncology. Lancet 1995; 345: 540–543
- Sapareto SA, Dewey WC. Thermal dose determination in cancer therapy. Int J Radiat Oncol Biol Phys 1984; 10: 787–800
- Dewhirst MW, Sim DA, Sapareto S, Connor WG. Importance of minimum tumor temperature in determining early and long-term responses of spontaneous canine and feline tumors to heat and radiation. Cancer Res 1984; 44: 43–50
- Sneed PK, Gutin PH, Stauffer PR, Phillips TL, Prados MD, Weaver KA, Suen S, Lamb SA, Ham B, Ahn DK. Thermoradiotherapy of recurrent malignant brain tumors. Int J Radiat Oncol Biol Phys 1992; 23: 853–861
- Wust P, Rau B, Gellerman J, Pegios W, Loffel J, Riess H, Felix R, Schlag PM. Radiochemotherapy and hyperthermia in the treatment of rectal cancer. Recent Results Cancer Res 1998; 146: 175–191
- Gelvich EA, Mazokhin VN. Contact flexible microstrip applicators (CFMA) in a range from microwaves up to short waves. IEEE Trans Biomed Eng 2002; 49: 1015–1023
- Stauffer PR, Rossetto F, Leoncini M, Gentilli GB. Radiation patterns of dual concentric conductor microstrip antennas for superficial hyperthermia. IEEE Trans Biomed Eng 1998; 45: 605–613
- Rietveld PJ, van Putten WL, van der ZJ, Van Rhoon GC. Comparison of the clinical effectiveness of the 433 MHz Lucite cone applicator with that of a conventional waveguide applicator in applications of superficial hyperthermia. Int J Radiat Oncol Biol Phys 1999; 43: 681–687
- van Dijk JDP, Schneider CJ, van Os RM, Blank LE, Gonzalez DG. Results of deep body hyperthermia with large waveguide radiators. Adv Exp Med Biol 1990; 267: 315–319
- De Leeuw AAC, Lagendijk JJW. Design of a clinical deep-body hyperthermia system based on the ‘coaxial TEM’ applicator. Int J Hyperthermia 1987; 3: 413–421
- Turner PF, Tumeh A, Schaefermeyer T. BSD-2000 approach for deep local and regional hyperthermia: Physics and technology. Strahlenther Onkol 1989; 165: 738–741
- Crezee J, Van Haaren PMA, Westendorp H, De Greef M, Kok HP, Wiersma J, Van Stam G, Sijbrands J, Zum Vörde Sive Vörding PJ, Van Dijk JDP, et al. Improving locoregional hyperthermia delivery using the 3-D controlled AMC-8 phased array hyperthermia system: A preclinical study. Int J Hyperthermia 2009; 25: 581–592
- Jacobsen S, Stauffer P. Non-invasive temperature profile estimation in a lossy medium based on multi-band radiometric signals sensed by a microwave dual-purpose body-contacting antenna. Int J Hyperthermia 2002; 18: 86–103
- Straube WL, Arthur RM. Theoretical estimation of the temperature dependence of backscattered ultrasonic power for noninvasive thermometry. Ultrasound Med Biol 1994; 20: 915–922
- Hekmatyar SK, Hopewell P, Pakin SK, Babsky A, Bansal N. Noninvasive MR thermometry using paramagnetic lanthanide complexes of 1,4,7,10-tetraazacyclodoecane-alpha,alpha′, alpha″, alpha′″-tetramethyl-1, 4,7,10-tetraacetic acid (DOTMA4-). Magn Reson Med 2005; 53: 294–303
- Hoffmann W, Rhein KH, Wojcik F, Noeske R, Seifert F, Wlodarczyk W, Fahling H, Wust P, Rinneberg H. Performance and use of current sheet antennae for RF-hyperthermia of a phantom monitored by 3 tesla MR-thermography. Int J Hyperthermia 2002; 18: 454–471
- de Bruijne M, Wielheesen DH, Van der Zee J, Chavannes N, Van Rhoon GC. Benefits of superficial hyperthermia treatment planning: Five case studies. Int J Hyperthermia 2007; 23: 417–429
- Kroeze H, van de Kamer JB, De Leeuw AAC, Lagendijk JJW. Regional hyperthermia applicator design using FDTD modelling. Phys Med Biol 2001; 46: 1919–1935
- Seebass M, Beck R, Gellermann J, Nadobny J, Wust P. Electromagnetic phased arrays for regional hyperthermia: Optimal frequency and antenna arrangement. Int J Hyperthermia 2001; 17: 321–336
- Cornett WR, McCall LM, Petersen RP, Ross MI, Briele HA, Noyes RD, Sussman JJ, Kraybill WG, Kane JM, III, Alexander HR, et al. Randomized multicenter trial of hyperthermic isolated limb perfusion with melphalan alone compared with melphalan plus tumor necrosis factor: American College of Surgeons Oncology Group Trial Z0020. J Clin Oncol 2006; 24: 4196–4201
- Knorr C, Meyer T, Janssen T, Goehl J, Hohenberger W. Hyperthermic isolated limb perfusion (HILP) in malignant melanoma. Experience with 101 patients. Eur J Surg Oncol 2006; 32: 224–227
- Ma D, Ariyan S. The use of isolated limb perfusion to manage recurrent malignant melanoma. Clin Plast Surg 2000; 27: 441–450, ix
- Ross MI. Current status of hyperthermic limb perfusion for in-transit melanoma. Int J Hyperthermia 2008; 24: 205–217
- De Leeuw AAC, Crezee J, Lagendijk JJW. Temperature and SAR measurements in deep-body hyperthermia with thermocouple thermometry. Int J Hyperthermia 1993; 9: 685–697
- van de Kamer JB, De Leeuw AAC, Hornsleth SN, Kroeze H, Kotte ANTJ, Lagendijk JJW. Development of a regional hyperthermia treatment planning system. Int J Hyperthermia 2001; 17: 207–220
- Correia D, De Greef M, Kok HP, Bel A, Crezee J. Fast FDTD computation using graphics card: The orientation of the yee-cell. ESHO 2009: Abstract Book. European Society for Hyperthermic Oncology, VeronaItaly, 32
- Berenger JP. A perfectly matched layer for the absorption of electromagnetic waves. J Comp Phys 1994; 114: 185–200
- Wiersma J, van Dijk JDP, Sijbrands J, Schneider CJ. The measurement of fringing fields in a radio-frequency hyperthermia array with emphasis on bolus size. Int J Hyperthermia 1998; 14: 535–551
- Hornsleth SN, Mella O, Dahl O. A new segmentation algorithm for finite difference based treatment planning systems. Hyperthermic Oncology, C Franconi, G Arcangeli, R Cavaliere. Tor Vergata, RomeItaly 1996; 2: 521–523
- James BJ, Sullivan DM. Creation of 3-dimensional patient models for hyperthermia treatment planning. IEEE Trans Biomed Eng 1992; 39: 238–242
- ESHO Task Group Committee. Treatment Planning and Modelling in Hyperthermia, A Task Group Report of the European Society for Hyperthermic Oncology. Rome, Italy; Tor Vergata; 1992.
- Gabriel C, Gabriel S, Corthout E. The dielectric properties of biological tissues: I. Literature survey. Phys Med Biol 1996; 41: 2231–2249
- Pennes HH. Analysis of tissue and arterial blood temperatures in the resting human forearm. J Appl Physiol 1948; 1: 93–122
- Hand JW, Lagendijk JJ, Bach AJ, Bolomey JC. Quality assurance guidelines for ESHO protocols. Int J Hyperthermia 1989; 5: 421–428
- van der Koijk JF, Lagendijk JJW, Crezee J, de Bree J, Kotte ANTJ, van Leeuwen GMJ, Battermann JJ. The influence of vasculature on temperature distributions in MECS interstitial hyperthermia: Importance of longitudinal control. Int J Hyperthermia 1997; 13: 365–385
- Van Wieringen N, Wiersma J, Zum Vörde Sive Vörding PJ, Oldenborg S, Gelvich EA, Mazokhin VN, Van Dijk JDP, Crezee H. Characteristics and performance evaluation of the capacitive contact flexible microstrip applicator operating at 70 MHz for external hyperthermia. Int J Hyperthermia 2009; 25: 542–553
- Gelvich EA, Kolmakov DN, Kudryavtsev YS, Mazokhin VN. Contact flexible microstrip applicators (CFMA) for superficial and deep hyperthermia. COMAC-BME Hyperthermia Bull 1992; 10: 66–72
- Kroeze H, Kokubo M, van de Kamer JB, De Leeuw AAC, Kikuchi M, Hiraoka M, Lagendijk JJW. Comparison of a capacitive and a cavity slot radiative applicator for regional hyperthermia. Jap J Hyperthermic Oncol 2002; 18: 75–91

