Abstract
Purpose: Hyperthermia treatment might increase tumour oxygenation and perfusion, as has been reported for experimental tumours. The present study was performed to investigate this hypothesis in patients undergoing regional hyperthermia treatment.
Methods: Thirteen patients with primary or recurrent pelvic tumours were included in this study. Prior to and up to one hour after regional hyperthermia, perfusion was quantitatively determined by H215O-PET. The fused CT-PET images were used to extract tumour time-activity curves and to identify the catheter position. Perfusion was calculated from the total tumour time-activity curves and for the time-activity curves at the catheter site. Additionally, perfusion was calculated from the temperature-time curves measured using temperature probes.
Results: Perfusion values calculated using H215O-PET and those deduced from temperature probe measurements are significantly correlated with a correlation coefficient, R = 0.21. The perfusion values deduced from the temperature measured in a body cavity do not provide information about average tumour perfusion. Perfusion values deduced from the temperature are overestimated for very poorly perfused tissues and underestimated for highly perfused tissues.
Conclusions: Temperature measurement during hyperthermia may allow only determination of intermediate perfusion values.
Introduction
Mild local hyperthermia is a promising treatment modality for various types of cancer but it is difficult to ensure reliable heating of the entire tumour while reducing energy deposition in healthy tissue. Perfusion is crucial for hyperthermia treatment planning and has to be taken into account when calculating the expected temperature using the bioheat equation with temperature and tissue parameters Citation[1–4]. Moreover, perfusion is important because it dramatically changes during hyperthermia treatment. One must be aware that the interaction between temperature and perfusion is highly non-linear because complex thermoregulatory processes take place in a patient's body Citation[5], Citation[6]. Part of the beneficial effects of hyperthermia in multimodal tumour treatment are caused by changes in the microenvironment such as altered perfusion, improved oxygenation, and enhanced delivery of chemotherapeutic agents Citation[7–12]. It is therefore important to have a tool for evaluating perfusion in patients undergoing hyperthermia treatment.
The most established technique for assessing perfusion is H215O-PET. Functional information on perfusion is obtained from signal-time curves of tissue whose shape is determined by perfusion and distribution volume and which can be extracted from images acquired dynamically after intravenous administration of a short tracer bolus. In addition, perfusion can be assessed during hyperthermia from temperature-time curves derived by means of a temperature probe in the catheter used for hyperthermia treatment. Local perfusion can be deduced from the steady-state temperature during heating and the rate of the temperature increase/decrease when power is switched on/off Citation[13].
This study was performed to compare and analyse differences in perfusion quantification between the temperature probe method and H215O-PET. This means that basically we are comparing two methods based on different mechanisms. The temperature probe method using thermal wash-out relies on heat transport, which occurs predominantly with vessels >100 µm in diameter, whereas H215O-PET uses transport of an indicator occurring at the microvessel level. H215O-PET was performed before and 20–60 min after heating in patients undergoing hyperthermia treatment for recurrent rectal cancer or primary cervical cancer. Perfusion was assessed using the temperature probe method at the beginning and end of heating during regional hyperthermia treatment (RHT). The dynamic PET acquisition protocol allows quantitative determination of local perfusion in conjunction with an appropriate kinetic model. The data is analysed using a volume of interest (VOI) placed within the tumour and a second one at the catheter location for generating time-activity curves of these two regions.
Materials and methods
Patients
Thirteen patients with primary or recurrent pelvic tumours (five rectal carcinomas and eight cervical carcinomas) were investigated. The patients ranged in age from 44 to 69 years. For treatment planning, a CT of the abdomen and pelvis was acquired within two weeks before PET with the patient in the same orientation as for PET without use of immobilisation techniques and without catheters in place. The patients underwent regional hyperthermia treatment (RHT) in addition to conventional chemotherapy or radiochemotherapy. Chemotherapy was applied during RHT and radiotherapy on those days of the treatment phase on which no RHT was performed. The investigations were approved by the local ethics committee. All patients gave their informed consent prior to the PET examinations.
Regional hyperthermia
RHT was administered regularly once a week using the BSD 2000 (BSD Medical, Salt Lake City, UT) SIGMA 60-ring applicator. An array of four antenna pairs irradiated electromagnetic waves at 90 MHz with a dorsal phase delay of 20–40° and a 5–20° delay on the lateral pairs (supine position of the patient) Citation[14]. The power deposition pattern was shifted posteriorly into the presacral space using phase control. This adjustment leads to higher temperatures in presacral pelvic tumours and is better tolerated and more effective, as assumed theoretically Citation[13], Citation[15].
Temperatures were measured endoluminally using Bowman thermistors (BSD Medical) in closed-end catheters placed in the rectum, bladder, vagina, or above the gluteal fold Citation[14]. In all patients, tumour-associated temperatures were measured with a thermistor in contact with the tumour or within the tumour. Additionally, temperatures were measured at the rectum in patients with cancer of the uterine cervix. The site of contact with the tumour, i.e. the temperature measurement point, was determined according to tumour size as measured from the anocutaneous line using endoscopy, trans-rectal ultrasound, or CT scans. The therapeutic period of RHT began as soon as a temperature of 42°C was reached at one of the tumour-related measurement points or, in case the target temperature was not reached, 30 min after the power was turned on. Continuous heat application over a period of 60 min was attempted. Temperature-time curves in tumour-related reference points as well as temperature-position curves were recorded and evaluated to identify predictive thermal parameters. Perfusion was deduced from the steady-state temperature during heating and the gradient of the temperature increase/decrease when power was switched on/off Citation[13]. In this way, perfusion at the beginning and end of RHT was determined.
H215O-PET
In addition, tumour perfusion was investigated by water PET in all study patients prior to and immediately after completion of an RHT session. The investigation was performed between the first and sixth RTH session, i.e. between the first and thirty-fifth day of RTH. 2D-PET scans were acquired on an ECAT-Exact/921-PET scanner (47 slices; 128 × 128 matrix; reconstructed in-plane resolution 5 mm; axial resolution 3.75 mm). A 10-min transmission scan was acquired with a 68Ge/68Ga-ring source for attenuation correction. For each scan 1.5 GBq in 6–8 mL physiological saline solution was administered as an intravenous bolus followed by 20 mL 0.9% saline solution with a flow rate of 2 mL/s. Forty-six frames were collected over an 11-min period (35 × 2 s, 8 × 30 s, 3 × 120 s) starting with the initiation of the injection. Scan data were reconstructed using filtered back-projection with corrections for attenuation, scatter, randoms, dead time, and decay, and smoothed by a Gaussian function with 7.3-mm full width half maximum (FWHM).
PET evaluation
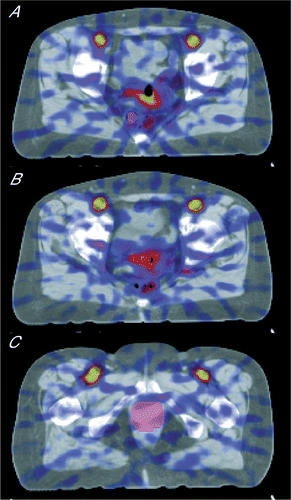
The evaluation of the dynamic H215O-PET scan is described in detail in Citation[16]. In short, the arterial input function (AIF) is extracted from the image data by using a VOI placed in the common iliac artery Citation[17]. The tumour and the catheter positions have to be contoured in the PET images to extract the tumour activity-time curve. Since CT allows more accurate labelling of the tumour than the H215O-PET images, image fusion of PET and CT was done to identify the tumour area as described in Citation[16]. In the CT image two structures were labelled, the tumour and the catheter position (see ).
Figure 1. 3D CT scan with superimposed fused perfusion-weighted PET image shows the ROI used to estimated positions of the rectal catheter (A), vaginal catheter (B), and tumour (C).
15O-Water is a chemically inert, nearly freely diffusible tracer, and its behaviour in tissue can be described by the methods published by Citation[18], Citation[19] neglecting the limited diffusion of water Citation[20], Citation[21]. The AIF was extracted from the common iliac artery using the method validated in Citation[17]. The AIF was fitted over time by means of a function using a parameterisation consisting of a gamma variate bolus Citation[22] and a reflow contribution Citation[23], Citation[24]. The parameterised AIF calculated in this way is used to calculate tumour perfusion and perfusion at the catheter location. Fitting of AIF and perfusion calculation were performed with program modules in C++ and FORTRAN dynamically linked to AM IRA which were developed in our institution.
Statistical analysis
The statistical analysis was performed using R for Linux (GNU Project, http://www.r-project.org). A linear correlation was assumed between the methods. Therefore, a three-parameter linear model was fitted using the least mean square technique for approximation. A linear offset and a multiplicative factor between the measurements prior and after hyperthermia were investigated. Additionally, slope and y-axis were fitted and tested for significance. Water PET perfusion was used as a reference.
Results
The mean duration of hyperthermia was 60 ± 12 min (minimum 32 min, maximum 1 h 19 min). The mean time between hyperthermia and PET after hyperthermia was 40 ± 13 min (minimum 21 min, maximum 60 min). In the eight patients with cancer of the uterine cervix one temperature probe was positioned at the rectum and the second at the cervix. In the five patients with rectal tumours a temperature probe was positioned at the rectum. The differences between the average pre-therapeutic and post-therapeutic H215O-PET perfusion values and between temperature probe-derived perfusion at the beginning and end of heating were evaluated. No significant differences were found between the measurements before hyperthermia/beginning of heating and after hyperthermia/end of heating (see ). Therefore, the average tumour pre- and post-hyperthermia investigations were evaluated together (see ). The average maximum tumour-related temperature achieved in the steady state was 40.9 ± 0.8°C, and the average duration of the steady-state temperature was 43 ± 12 min determined by the temperature probe at the tumour.
Figure 2. Comparison of the differences (post, pre) of the perfusion values determined by using the temperature probe and those determined using H215O-PET at the position of the temperature probe. ▵: rectal perfusion difference patients with cancer of the uterine cervix, □: rectal perfusion difference in patients with rectal cancer, ◯: cervical perfusion in patients with cancer of the uterine cervix.
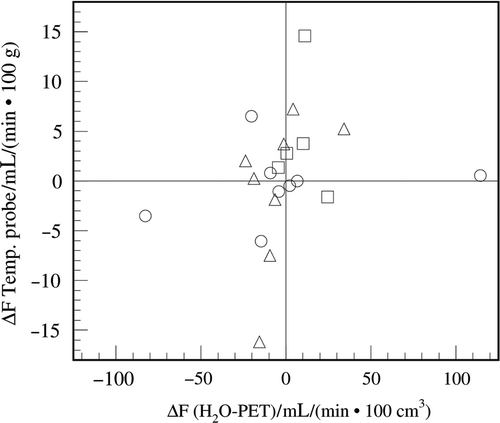
Table I. Perfusion was assessed using the temperature probe, PET using a VOI at the location of the temperature probe, and PET using a VOI at the tumour. Mean perfusion values measured at the beginning of heating/before RHT (pre) and end of heating/after RHT (post) are provided. Additionally, the difference (diff.) between both measurements and the average (mean) of both measurements are provided. Cervical perfusion was determined in patients with cervical cancer and rectal perfusion in patients with rectal cancer and cervical cancer.
The H215O-PET perfusion determined in patients with cancer of the uterine cervix at the cervical temperature probe position was 5.7 times larger (79.3 mL/(min 100 cm3)) than the temperature probe perfusion (13.8 mL/(min 100 g)). The rectal H215O-PET perfusion for the cervical carcinomas at the rectal temperature probe position was twice as large (24.6 mL(min 100 cm3)) than the temperature probe perfusion (12.6 mL/(min · 100 g)). The rectal H215O-PET perfusion for the rectal carcinomas (29.4 mL/(min 100 cm3)) was 2.5 times larger than the temperature probe perfusion (11.6 mL/(min · 100 g)). Overall, the H215O-PET perfusion (46.6 mL/(min 100 cm3)) was found to be 3.6 times larger than the temperature probe perfusion (12.8 mL/(min · 100 g)).
For both tumours the average tumour H215O-PET perfusion differed significantly (P < 0.05) from the H215O-PET perfusion at the temperature probe position. The mean cervical tumour perfusion (59.2 mL/(min · 100 g)) was 25 % smaller than the H215O-PET perfusion at the temperature probe position (79.3 mL/(min · 100 g)). On the other hand, the mean rectal tumour perfusion (35.1 mL/(min · 100 g)) was 19% larger than the H215O-PET perfusion at the temperature probe position (29.4 mL/(min · 100 g)).
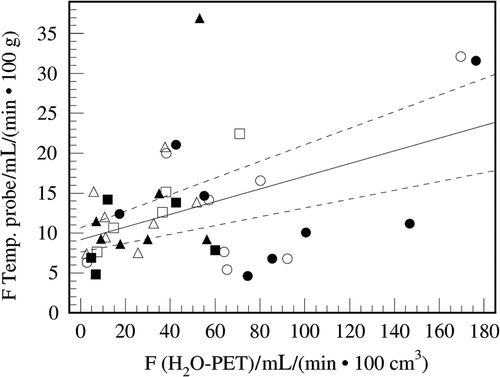
All temperature probe-deduced perfusion values were correlated with the H215O-PET perfusion values determined at the catheter position using the linear model. Since no significant offset or multiplicative factor was found between pre-hyperthermia/beginning of heating and post-hyperthermia/end of heating, both measurements were evaluated together to reduce statistical uncertainty using linear regression. Offset and slope were found to differ significantly from zero with P < 0.001. The overall correlation of H215O-PET and the temperature probe-deduced perfusion was P = 0.002. The linear correlation coefficient was 0.211 with a slope of 0.0796 ± 0.0342 (mL/min 100 g))/(mL/min 100 cm3)) (P < 0.0001) and a y-axis perfusion of 9.13 ± 1.53 ml/(min × 100 g) (P = 0.002) using H215O-PET as a reference, see . On the other hand, no significant correlation was found when comparing the temperature-deduced perfusion with total tumour perfusion as well as when comparing the H215O-PET perfusion at the temperature probe position with total tumour perfusion.
Figure 3. Comparison of the perfusion values determined by using the temperature probe and those determined using H215O-PET at the position of the temperature probe. The filled line represents the result of linear regression and the broken line the fit error as standard deviation. Filled symbols (▴, •, ![]()
Discussion
In this study we used a technique to extract the AIF from a peripheral artery. The technique allowed absolute quantification of perfusion without arterial blood sampling. On the other hand, not using arterial blood sampling during measurement significantly increased the statistical uncertainty in calculating perfusion. Overall reproducibility of H215O-PET evaluation of perfusion was 19.2% Citation[16]. While better accuracy would be useful, the mean accuracy of the method was sufficient to identify significant changes in perfusion and partition coefficient. The mean tumour perfusion values determined in the present study are nearly identical to the values determined in a larger group of patients in an earlier study Citation[16]. Therefore, it was assumed that a representative group of patients was investigated in the present study.
A major limitation of the current study, in contrast to our previous study is that perfusion was additionally determined in a small area at the catheter position. Since the VOI used for determination of PET perfusion was much smaller than the tumour VOI, a misregistration has larger effects. The accuracy of the coregistration for the iliac arteries was much better than the effective spatial resolution of the PET perfusion measurement. However, registration accuracy is affected by internal organ filling. Since no other internal structures can be assessed by using a H215O-PET the uncertainty of the catheter position is unknown, but the spatial resolution of both perfusion measuring techniques is low. Deviations from the actual position increase the overall uncertainty and reduce the value of the regression coefficient. The impact of the coregistration uncertainty on the regression parameters (slope, abscissa) is much smaller.
The H215O-PET evaluation technique applied here provides perfusion values 104.0 ± 52.0% above those determined by using the AIF calculated from blood samples Citation[17]. Using the correction factor of Citation[17], the slope becomes higher, 0.163, but is still far below one, which would mean identity. Additionally, the y-axis intercept is far above zero. Interestingly, modifying the H215O-PET perfusion values by the correction factor, one obtains perfusion values for the rectal catheter positions of 14.4 mL/(min · 100 cm3) versus 11.6 mL/(min · 100 g) for the rectal carcinomas and 12.1 mL/(min · 100 cm3) versus 12.6 mL/(min · 100 g) for the cervical carcinomas. In first approximation, both methods predict identical perfusion values for the rectal site. On the other hand, correcting the PET perfusion values determined at the cervix reduced the ratio between both methods only to a factor of 2.8. Nevertheless, altogether the perfusion values are highly correlated.
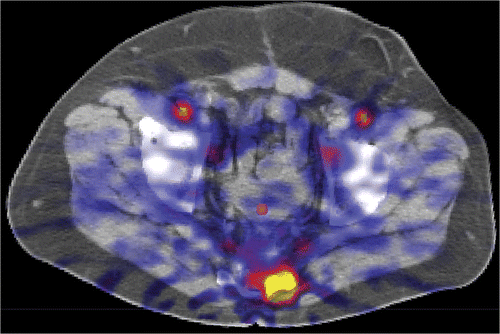
Temperature probe-deduced perfusion is determined indirectly by using the temperature and not directly by using an indicator-based method. Local temperature is subject to convection and diffusion. The contribution of the thermal conduction component depends on the magnitude and direction of the local thermal gradient. These conduction terms are not taken into account using the temperature probe method Citation[13] and lead to substantial smoothing of a perfusion distribution determined with the temperature probe method Citation[25], Citation[26]. Moreover, the temperature probe provides perfusion values at sites where no perfusion is present. In contrast, H215O-PET correctly fails to provide any significant perfusion for the bladder, since there are no vessels inside the bladder. In one patient, see , the temperature probe provided a perfusion value of 13.1 mL/(min · 100 g) for the beginning of heating and 14.3 mL/(min · 100 g) for the end of heating in the bladder. Conductive heating losses of neighbouring perfused tissue create the appearance of perfusion in temperature versus time curves measured using a temperature probe.
Figure 4. CT image with fused perfusion-weighted PET image shows the ROI used for the position of the catheter in the bladder.
As a result of the smoothing effect, very highly perfused tissues distribute their temperature increase in adjacent tissues so that the perfusion determined by the temperature probe appears much smaller. Therefore, high perfusion values are significantly underestimated and low perfusion values are significantly overestimated by using the temperature probe. The effect becomes larger as the volume of the highly perfused tissue decreases and perfusion increases. These results are consistent with the simulations of Wong et al. Citation[25].
Additionally, higher perfusion values can be expected using H215O-PET compared with a method based on thermal conduction. This is because much of the signal coming from H215O-water is contributed by microvessels that are not thermally significant, whereas the thermal conduction method solely relies on thermally significant contributing vessels typically larger than 100 µm. The thermal washout method should yield lower values because of the relative difference in the number and density of vessels governing transport. Comparable deviations between the perfusion predicted by using the bioheat transfer equation and measured perfusion and temperature values have already been described earlier by Rine et al. Citation[27] and discussed in detail.
Nevertheless, since the perfusion values are highly correlated, a correction using the results of the linear regression seems not applicable because the spread of datapoints along the regression line should be considerably narrower. Additionally, such a correction might yield wrong results because in principle small hot spots should be corrected differently than large perfused areas. Other perfusion correlation studies using different techniques also failed to establish a high correlation between different imaging-based perfusion techniques Citation[28], Citation[29]. Therefore, it would be useful to combine magnetic resonance imaging-based temperature measurements with temperature probe measurement to obtain 3-dimensional thermal profiles during hyperthermia. In this way, thermal gradients could be calculated and effects of conduction accounted for. On the other hand, the contribution of microvascular perfusion to heat transfer cannot be predicted by assessing microvascular perfusion using an indicator-based method.
Conclusions
The present study demonstrates that the perfusion estimated by the temperature probe provides only information about perfusion at the catheter site but not about mean tumour perfusion. Tumour perfusion might be higher or lower than the perfusion value determined from a temperature probe placed within a body cavity. Perfusion determined from temperature measurements is overestimated for very poorly perfused tissues and underestimated for highly perfused tissues because, basically, different physiological transport processes are assessed, microvascular perfusion by H215O-PET and heat transport predominantly occurring in vessels >100 µm.
Acknowledgements
The authors are very greatful for the support of the Berliner Sparkassenstiftung Medizin.
Declaration of interest: The authors report no conflicts of interest. The authors alone are responsible for the content and writing of the paper.
References
- Pennes HH. Analysis of tissue and arterial blood temperature in the resting forearm. J Appl Physiol 1948; 1: 93–122
- Langendijk JJW. The influence of blood flow in large vessels on the temperature distribution in hyperthermia. Phys Med Biol 1982; 27: 17–23
- Langendijk JJW, Schellekens M, Schipper J, van der Linden PM. A three-dimensional description of heating patterns in vascularized tissues during hyperthermic treatment. Phys Med Biol 1984; 29: 495–507
- Weinbaum S, Jiji LM, Lemons DE. Theory and experiment for the effect of vascular microstructure on surface tissue heat transfer-part I: Anatomical foundation and model conceptualisation. ASME J Biomech Eng 1984; 106: 321–330
- Vaupel P, Kallinowski F, Kluge M. Pathophysiology of tumors in hyperthermia. Recent results in cancer research. Application of hyperthermia in the treatment of cancer, RD Issels, W Wilmanns. Springer-Verlag, Berlin, Heidelberg 1988; 65–75
- Horsman MR. Tissue physiology and the response to heat. Int J Hyperthermia 2006; 22: 197–203
- Burton MA, Chen Y, Atkinson H, Codde JP, Jones SK, Gray BN. In vitro and in vivo responses of doxorubicin ion exchange microspheres to hyperthermia. Int J Hyperthermia 1992; 8: 845–894
- Khalek Y, Vilor M, Sorrentino J, Brown M, Wills J, Herrera L. Complete disappearance of a leiomyosarcoma of the lower extremity following preoperative hyperthermia and intra-arterial doxorubicin. J Surg Oncol 1993; 52: 272–275
- Miller RC, Richards M, Baird C, Martin S, Hall EJ. Interaction of hyperthermia and chemotherapy agents: Cell lethality and oncogenic potential. Int J Hyperthermia 1994; 10: 89–99
- Wong M, Urano K. Enhancement of misonidazole chemosensitization effect by mild local hyperthermia. Int J Radiat Oncol Biol Phys 1992; 23: 593–598
- Song CW, Park HJ, Lee CK, Griffin R. Implications of increased tumour blood flow and oxygenation caused by mild temperature hyperthermia in tumour treatment. Int J Hyperthermia 2005; 21: 761–767
- Dewhirst MW, Vujaskovic Z, Jones E, Thrall D. Re-setting the biologic rationale for thermal therapy. Int J Hyperthermia 2005; 21: 779–790
- Wust P, Stahl H, Loeffel J, Seebass M, Riess H, Felix R. Clinical, physiological and anatomical determinants for temperature elevations in radiofrequency hyperthermia. Int J Hyperthermia 1995; 11: 151–167
- Wust P, Gellermann J, Harder C, Tilly W, Rau B, Dinges S, Schlag P, Budach V, Felix R. Rationale for using invasive thermometry for regional hyperthermia of pelvic tumors. Int J Radiat Oncol Biol Phys 1998; 41: 1129–1137
- Feldmann HJ, Molls M, Adler S, Meyer-Schwickerath M, Sack H. Hyperthermia in eccentrically located pelvic tumors: Excessive heating of the perineal fat and normal tissue temperatures. Int J Radiat Oncol Biol Phys 1991; 20: 1017–1022
- Lüdemann L, Sreenivasa G, Amthauer H, Michel R, Gellermann J, Wust P. Use of H215O-PET for investigating perfusion changes in pelvic tumours due to regional hyperthermia. Int J Hyperthermia 2009; 25: 299–308
- Lüdemann L, Sreenivasa G, Michel R, Rosner C, Plotkin M, Felix R, Wust P, Amthauer H. Corrections of arterial input function for dynamic H215O PET to assess perfusion of pelvic tumours: Arterial blood sampling versus image extraction. Phys Med Biol 2006; 51: 2883–2900
- Kety SS. The theory and applications of the exchange of inert gas at the lungs and tissues. Pharmacol Rev 1951; 3: 1–41
- Kety SS. Theory of blood-tissue exchange and its application to measurement of blood flow. Meth Med Res 1960; 8: 223–227
- Herscovitch P, Raichle ME, Kilbourn MR, Welch MJ. Positron emission tomographic measurement of cerebral blood flow and permeability-surface area product of water using [15O]water and [11C]butanol. J Cereb Blood Flow Metab 1987; 7: 527–542
- Berridge MS, Adler LP, Nelson AD, Cassidy EH, Muzic RF, Bednarczyk EM, Miraldi F. Measurement of human cerebral blood flow with [15O] butanol and positron emission tomography. J Cereb Blood Flow Metab 1991; 11: 707–715
- Thompson HK, Starmer CF, Whalen RE, McIntosh HD. Indicator transit time considered as a gamma variate. Circulation Res 1964; 14: 502–515
- Blomley MJ, Dawson P. Bolus dynamics: Theoretical and experimental aspects. Br J Radiol 1997; 70: 351–359
- Lüdemann L, Hamm B, Zimmer C. Pharmacokinetic analysis of glioma compartments with dynamic Gd-DTPA-enhanced MRI. Magn Reson Imaging 2000; 18: 1201–1214
- Wong TZ, Mechling JA, Jones EL, Strohbehn JW. Transient finite element analysis of thermal methods used to estimate SAR and blood flow in homogeneously and nonhomogeneously perfused tumour models. Int J Hyperthermia 1988; 4: 571–592
- Waterman FM, Tupchong L, Liu CR. Modified thermal clearance technique for determination of blood flow during local hyperthermia. Int J Hyperthermia 1991; 7: 719–733
- Rine GP, Dewhirst MW, Cobb ED, Clegg ST, Coleman EN, Samulski TV, Wallen CA. Feasibility of estimating the temperature distribution in a tumor heated by a waveguide applicator. Int J Radiat Oncol Biol Phys 1992; 23: 1009–1019
- Warmuth C, Günther M, Zimmer C. Quantification of blood flow in brain tumors: Comparison of arterial spin labeling and dynamic susceptibility-weighted contrast-enhanced MR imaging. Radiology 2003; 228: 523–532
- Lüdemann L, Warmuth C, Plotkin M, Förschler A, Gutberlet M, Wust P, Amthauer H. Brain tumor perfusion: Comparison of dynamic contrast enhanced magnetic resonance imaging using T1, T2, and T2* contrast, pulsed arterial spin labeling, and H215O positron emission tomography. Eur J Radiol 2009; 70: 465–474