Abstract
Purpose: In controlled laboratory studies of hyperthermia and thermal ablation, translucent hydrogels containing bovine serum albumin (BSA) are often employed as tissue-mimicking materials due to the change in their opacity that takes place as they accumulate heat damage. In this work we demonstrate the biological relevance of this optical metric of thermal damage, as well as establish the physical mechanisms that link it with quantifiable damage to the proteins embedded in the gel.
Materials and methods: We applied Fourier transform infrared (FTIR) spectroscopy, turbidity analysis using ultraviolet-visible (UV/VIS) spectroscopy, and size exclusion chromatography (SEC) to samples of heat-treated, aqueous bovine serum albumin (BSA). We also measured the rates of survival in heated suspensions of breast cancer cells using a colorimetric assay.
Results: Using FTIR spectroscopy and SEC, we show that the intermolecular β-sheet content of the protein ensemble rises in heat treatments above 60°C, which causes aggregate formation. Furthermore, by applying UV/VIS spectroscopy we demonstrate that the opacity of the hydrogel increases past 60°C due to the formation of insoluble protein aggregates that scatter incident light. Finally, we illustrate that the viability of human breast cancer cells follows a similar trend to measurements of BSA polyacrylamide hydrogel opacity at various temperatures from 37°C to 90°C.
Conclusions: Our work establishes a causal link between the degree of BSA denaturation in hydrogel and the opacity of the medium. Furthermore, our results demonstrate that BSA hydrogels provide a simple physical model for quantifying biologically relevant heat damage in real time during controlled laboratory studies of hyperthermia and thermal ablation.
Introduction
A common requirement in the research and development work that underpins any hyperthermic or thermally ablative therapy is the ability to quantify the amount of heat-induced damage imparted to the target medium. When this medium is biological tissue, the most direct way of assessing damage is to use techniques such as histology and cryosectioning. These methods involve examining thin slices of tissue under a microscope, typically with the help of a staining agent to highlight particular structural features of interest Citation[1]. However, histological procedures are invasive, time-consuming, and often yield results that are qualitative rather than quantitative. Moreover, these techniques do not allow damage to be monitored in real time, and are therefore not always an appropriate or convenient option for developing and testing hyperthermia or thermal ablation protocols in controlled laboratory settings.
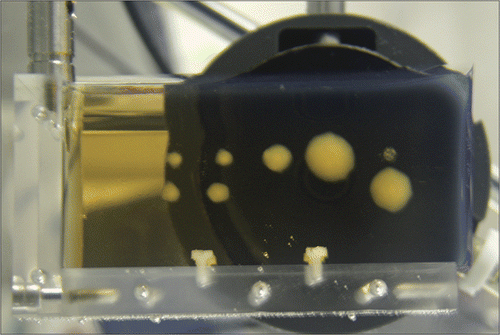
To overcome the limitations of histological procedures in laboratory bench-top testing, tissue is often substituted with an alternative test medium that retains some degree of biological relevance while also exhibiting a quantitative metric of thermal damage that can be observed non-invasively and in real time. Numerous tissue-mimicking materials have been developed to simulate various physical properties of biological tissue Citation[2]. Among these materials, protein-embedded hydrogels are often used in laboratory bench-top testing Citation[3–6], as these gels have the desirable property of visibly changing in opacity as the proteins accumulate thermal damage. For example, polyacrylamide hydrogels containing dissolved bovine serum albumin (BSA) are translucent in their normal state, but become increasingly opaque over time when exposed to sufficiently high temperatures Citation[6], Citation[7], as shown in . This change in opacity is straightforward to measure using an optical sensor (e.g. a camera) and elementary image processing techniques Citation[7], Citation[8], and has the major advantage that it can be monitored in real time. However, two issues should first be addressed if this optical indicator is to be used as a quantitative, biologically relevant measure of thermal damage.
Figure 1. Illustration of the change in the opacity of a BSA polyacrylamide hydrogel due to heat-induced denaturation of the embedded proteins. The opaque lesions were created by exposure to High Intensity Focused Ultrasound (HIFU) generated by the transducer shown in the background.
Firstly, the physical mechanisms that link the opacity of hydrogels containing embedded BSA with heat-induced changes in the protein molecules must be clarified. One starting point to address is to study the effect of heating on the molecular structure of proteins. Four canonical levels have been defined for describing protein structure: primary, secondary, tertiary, and quaternary. The most fundamental level is the primary structure, which consists of the specific sequence of amino acids that form the protein molecule. The next structural levels are the secondary and tertiary ones, which refer to the three-dimensional shapes formed locally by segments of amino acids within the molecule (secondary) or between the secondary structure motifs themselves (tertiary). Finally, in proteins that are comprised of multiple amino acid chains, the positioning of these chains relative to one another is called the quaternary structure. It is known that the structure of a protein can change significantly at one or more of these four levels if the molecule is exposed to sources of external stress, including heat Citation[9]. This phenomenon is called denaturation and typically results in the protein losing its biological functionality, although in the case of thermally induced stress the primary structure usually remains intact. The denaturation process can be either reversible or irreversible depending on the amount of stress placed on the protein molecule, and can also cause other events such as aggregation or precipitation.
Secondly, once the opacity-based metric of damage has been linked to protein denaturation, the biological relevance of this metric should be established across a range of temperature profiles relevant to modern hyperthermia and thermal ablation therapies. This may be accomplished by comparing the opacity of BSA hydrogel with the degree of thermally induced damage sustained for the same amount of heating by a more biologically relevant system, such as a suspension of cells. Previous studies have indicated that heat-induced cell death is accompanied by the denaturation of its constituent proteins Citation[10]. For example, Lepock et al. Citation[11] as well as Burgman and Konings Citation[12] have observed that protein denaturation occurs in mammalian cells during hyperthermia, and it is also known that proteins play a critical role in determining the heat-shock response of cells Citation[13]. Hence, one approach for demonstrating the biological relevance of the optical metric of damage is to compare it to the damage sustained by a cell line for the same temperature profile.
In this work, we apply quantitative bioanalytical techniques to study multiple aspects of the thermal denaturation of BSA. We then use the results from these techniques to establish a correlation between macroscopically observable variations in the opacity of BSA hydrogel and the amount of heat-induced changes occurring in the microscopic, molecular structure of the proteins. Our approach also makes apparent the biochemical mechanisms underlying the optical change, thereby providing a physical justification for the use of opacity as a proxy metric of thermally induced BSA denaturation. Finally, by correlating thermally induced cell death in human breast cancer cells and previously published opacity values for BSA polyacrylamide hydrogel Citation[6], Citation[7] across a range of temperature profiles, we demonstrate that this optical measure of thermal damage is biologically relevant and may therefore be used for developing and testing hyperthermia or thermal ablation treatment protocols in controlled laboratory environments.
Materials and methods
Protein structural analysis
We employed three protein analytic techniques to characterise samples of BSA (product A7906 from Sigma-Aldrich, UK) that were dissolved in water and subjected to pre-set temperatures for a fixed time of 30 min. This approach allows for studying the thermal characteristics of BSA separately from the other substances in the hydrogel. Firstly, we used turbidity analysis using ultraviolet-visible (UV/VIS) spectroscopy to determine the relative amount of insoluble BSA protein aggregates in the sample. Secondly, we applied size exclusion chromatography (SEC) Citation[14] to examine the relative content of BSA monomer and soluble protein aggregates. Thirdly, we employed Fourier transform infrared (FTIR) spectroscopy Citation[15] to study the changes in the secondary structure content of the BSA protein molecules, since thermal denaturation does not normally affect the primary structure of proteins Citation[9]. In all cases the concentration of the solution was chosen such that measurable changes in the observed phenomena could be detected without saturating the devices used to perform the measurement.
Ultraviolet-visible spectroscopy
The aim of this technique is to measure the amount of insoluble BSA aggregates (i.e. precipitates) that form at different temperatures. Turbidity analysis was performed on a Cary 50 Bio UV/VIS spectrophotometer with a single-cell Peltier temperature control element (Varian, Yarnton, Oxfordshire, UK). A 3 mL quartz cuvette was filled with 3.5% (w/v) BSA solution that had been prepared by dissolving the protein in double-distilled and filtered (0.2 µm) water. The samples were heated from room temperature to steady-state temperatures of 25°C, 40°C, 50°C, 60°C, 70°C, 80°C, and 90°C for a duration of 30 min using the built-in Peltier element, and were continuously stirred throughout the heating. In all cases, the temperature of the samples rose to within 1°C of their steady-state values within 2 min or less.
During the heating procedure, turbidity was measured at 350 nm. This value was selected due to the relatively low absorbance of BSA at this wavelength Citation[16] and also because 350 nm is a common choice in turbidity analyses reported in the literature. The temperature inside the cuvette was monitored using a Pico TC-08 thermocouple data logger (Pico Technology, Cambridge, UK) and a Type T needle thermocouple (model HYP0 by Omega Engineering, Stamford, CT, USA). The baseline value of 100% transmittance was set with the cuvette containing only distilled water. SEC was performed on the heat-treated samples immediately after the 30-min heating period. Turbidity was also measured 24 h after heating to check for any reversible changes in protein denaturation.
Size exclusion chromatography
In this study we use the SEC technique to quantify the amount of soluble aggregates present in each heated sample. In SEC, the amount of time a particle takes to flow through the chromatography column varies inversely with its size.
The high performance liquid chromatography (HPLC) apparatus used in this study consisted of a Prostar 210 dual-pump solvent delivery system, a Prostar 500 column valve module, a Prostar 325 UV detector, and a Model 410 autosampler (Varian). SEC was performed using a 4.6 by 250 mm Zorbax GF250 gel-filtration column (Agilent Technologies, South Queensferry, West Lothian, UK) with a pore diameter of 150 Å and a nominal particle size of 4.0 to 4.5 µm. A 20 mM phosphate buffer at pH 6.8 with 250 mM NaCl was chosen as the mobile phase. For these experiments, 10 µL samples were taken from each of the solutions that had been heat-treated in the UV/VIS spectrophotometer and were injected into the column with the mobile phase. The flow rate through the column was 0.250 mL/min under isocratic conditions (single solvent) and the temperature of the column was held constant at 30°C. UV detection of the eluent was carried out at a wavelength of 280 nm, which corresponds to a local maximum in the absorption spectrum of BSA Citation[17] due to resonance in its tryptophan amino acid side chains Citation[18]. Absorbance was monitored for 20 min following injection, after which peak identification and integration was performed using Galaxie chromatography software (Varian).
Fourier transform infrared spectroscopy
The objective of the FTIR technique is to measure the relative amount of different secondary structure motifs (such as α-helices and β-sheets) as a function of temperature. To this end, a 2% (w/v) BSA solution was prepared in the same manner as described previously. Samples of this solution were then subjected to 25°C, 40°C, 60°C, 70°C, 80°C, and 95°C for 30 min by placing them in a preheated water bath and were subsequently centrifuged at 10,000 rpm for 10 min to eliminate precipitates. As in the UV/VIS experiment, the temperature of the samples rose to within 1°C of their steady-state values within 2 min or less. The FTIR spectra were then collected on an Omnic Nicolet Magna-IR 550 spectrometer using a Proteus transmission cell kit (Thermo Fisher Scientific, Limburg an der Lahn, Hessen, Germany) with an optical path length of 6 µm. The instrument was continuously purged with dry air to avoid spectral noise due to water vapour. Measurements consisted of 42 averaged scans and were repeated 3 times, preceded on each occasion by the recording of a new background spectrum in order to minimise baseline and temperature effects. Background subtraction was performed to obtain a flat baseline between 1900 and 1750 cm−1.
Changes to protein secondary structure were detected using the baseline-corrected, area-normalised, non-deconvolved Amide I band of the spectrum (1700 to 1600 cm−1). The positions of the underlying peaks were determined using the second derivative of the spectra and were assigned to secondary structures according to the literature Citation[19]. Quantification was performed by peak fitting using PeakFit version 4.12 (Systat Software, Erkrath, Germany) assuming a Gaussian peak shape. The r2 correlation coefficient of each fit was at least 0.999. The ratio of the area under a given Gaussian peak to the total area under the curve was then used as a relative measure of how often the secondary structure associated with that peak occurred in the sample, with values expressed as a percentage of the total number of secondary structure motifs that were observed and classified in this manner.
Heat-induced cell death
The aim of this experiment was to measure the amount of thermally induced cell death in a human breast cancer cell line across a range of heating profiles. Cells were grown in RPMI 1640 medium without phenol red (E15-048 from PAA, Yeovil, Somerset, UK), 10% (v/v) fetal calf serum (A15-151 from PAA) and 25 U/mL penicillin-streptomycin (P4333 from Sigma Aldrich, UK). ZR75.1 human breast cancer cells were suspended in this medium at a final concentration of 106 cells per mL, after which 300 µL samples of this suspension were placed in enclosed microcentrifuge tubes. The samples were heated for 1 min, starting from room temperature, in mechanically stirred water baths set at 25°C, 40°C, 50°C, 60°C, 70°C, 80°C, and 90°C (measurement of the internal temperature of the samples themselves is described further below). The fraction of surviving cells in each heat-treated sample was then determined using an MTS-based assay kit (product G5421 from Promega, Southampton, Hampshire, UK) per the manufacturer's instructions, with absorbance measured at 490 nm after 2 h of MTS incubation using a Victor 2 plate reader (PerkinElmer, Cambridge, Cambridgeshire, UK).
To determine the temperature profiles that each sample was subjected to, an additional microcentrifuge tube containing 300 µL of cell medium only was included in each heat treatment. The temperature in this tube was monitored using a Pico TC-08 thermocouple data logger (Pico Technology) and a Type T needle thermocouple (HYP0 by Omega Engineering). Given that the temperature of the water bath was kept fairly uniform throughout each heat treatment by stirring the water, the temperature profile measured in the extra tube was taken as representative of the temperature profile experienced by all other samples in the same batch. In all cases, the temperature inside the tube rose to within 1°C of the surrounding water bath within 1 min of immersion.
Results
Ultraviolet-visible spectroscopy
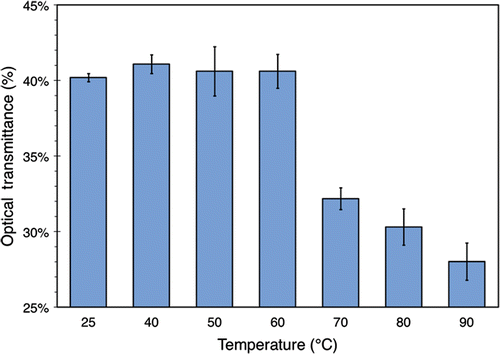
shows the optical transmittances of the BSA samples after 30 min of heating, as measured by turbidity analysis using UV/VIS spectroscopy. Measurements indicate that the turbidity of the solution does not change significantly up to 60°C, after which there is a noticeable decline in its optical transmittance. This indicates the existence and increased formation of insoluble aggregates beyond this temperature, which act as scatterers of incident light. Additionally, no substantial changes were observed in these results 24 h after heating, indicating that no significant reversible denaturation occurred.
Figure 2. Optical transmittance of 3.5% (w/v) BSA solution exposed to various temperatures for 30 minutes. The data were obtained using a UV/VIS spectrometer set to 350 nm and with 100% transmittance corresponding to distilled water containing no BSA. The values plotted here are averaged over 3 separate runs of the experiment described in the text. Standard deviations are indicated with error bars.
Size exclusion chromatography
shows minutes 6 through 12 of three SEC chromatograms for samples exposed to 25°C, 70°C, and 90°C. Measurements are expressed in absorbance units (AU). The absorbance value at all other elution times was below the noise floor of the detector.
Figure 3. Minutes 6-12 of three SEC chromatograms for 3.5% (w/v) BSA solutions heated to 25°C, 70°C, and 90°C for 30 minutes. Absorbance was monitored at 280 nm. For this run of the experiment, the chromatograms at 40°C, 50°C, and 60°C (not shown) were found to be similar to the 25°C one. Absorbance at all other times was found to lie below the noise floor.
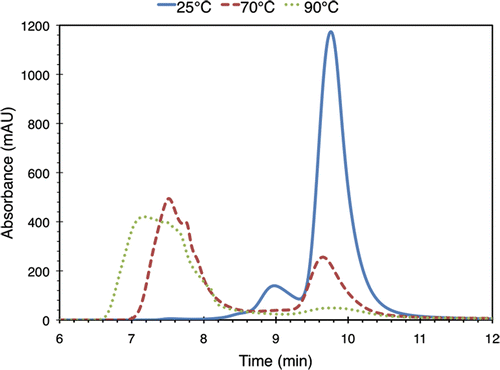
The chromatogram for 25°C BSA (solid line) shows a large peak at a retention time of 9.82 min (1173 AU), as well as smaller peaks at 9.03 min and 7.57 min (139 AU and 5.2 AU respectively). Using a BSA molecular weight standard (product P7869 from Sigma-Aldrich) with the same SEC method, we determined that the large peak at 9.82 min corresponds to BSA monomer, i.e. undenatured single BSA protein molecules with a molecular weight of 66.4 kDa Citation[20]. The smaller peaks correspond to larger molecular weight aggregates.
The chromatograms associated with the samples treated at 40°C, 50°C, and 60°C (not shown in the figure) do not vary significantly from the 25°C one. However, in the 70°C case (dashed line), the amplitude of the peak around 7.57 min has increased more than threefold to 494 AU, while the monomer peak has dropped to 255 AU, less than a quarter of its value for the sample at 25°C. This indicates that some of the BSA monomers have aggregated together due to the thermal damage they have sustained. This trend continues in the sample treated at 90°C (dotted line), in which very little monomer remains (peak value of 49 AU) and most of the BSA proteins have formed aggregates. The aggregate peak in this chromatogram has a maximum value of 420 AU. It is also relatively spread out compared to the results at 25°C and 70°C and does not have a Gaussian shape, which indicates that it spans a range of aggregate sizes.
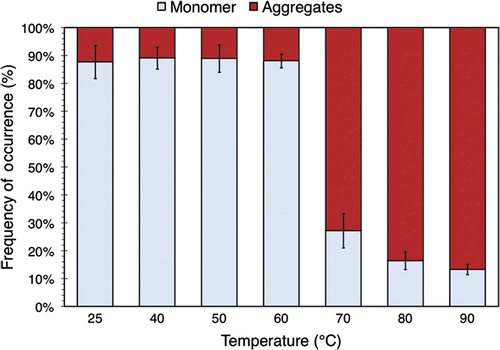
shows the relative amounts of monomer and aggregates in all heat-treated BSA samples, as computed by peak integration of their respective chromatograms. The figure shows that over 85% of the BSA is monomeric for temperatures less than or equal to 60°C. However, beyond this threshold, the percentage of aggregates rises markedly. At 80°C, the distribution is essentially the reverse of the 60°C one, with 85% of the BSA aggregated.
Figure 4. The relative amount of BSA monomers and aggregates in 3.5% (w/v) BSA solution exposed to various temperatures for 30 minutes. The data were obtained by performing peak identification and integration on the associated SEC chromatograms. The values plotted here are averaged over 3 separate runs of the experiment described in the text. Standard deviations are indicated with error bars.
Fourier transform infrared spectroscopy
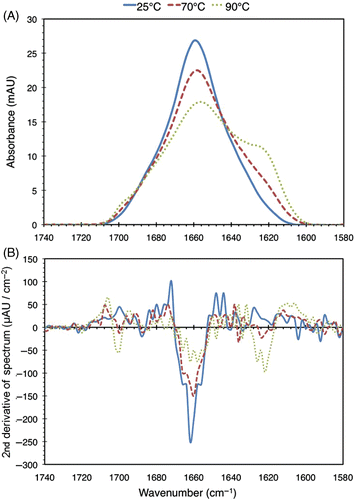
shows the Amide I band of the FTIR spectra obtained from BSA samples exposed to 25°C, 70°C, and 95°C. The second derivatives of these spectra are plotted in . The locations of the fitted peaks for the spectra in are given by the zero-crossings in , which correspond to inflection points in the spectra.
Figure 5. (a) FTIR spectra of 2% (w/v) BSA solutions heated to 25°C, 70°C, and 95°C for 30 minutes. For this run of the experiment, the spectra at 40°C and 60°C (not shown) were found to be similar to the 25°C one. (b) Second derivatives of the spectra. The zero-crossings of the second derivative curves correspond to inflection points in the original spectra, which are used in the peak fitting process as described in the text.
Fitting peaks to all observed spectra and matching these with secondary structures in the manner described previously yields the data in , which shows the secondary structure distribution of the heat-treated BSA samples. It should be noted that the values obtained are biased by the fact that the precipitates were spun out during the procedure, thereby enriching the mixture for the relatively undamaged protein. However, this limitation does not affect the conclusions we will draw from these results.
Figure 6. Relative secondary structure distribution of BSA in solutions with a concentration of 3.5% (w/v) exposed to elevated temperatures for 30 min. The data were obtained using a FTIR apparatus. The values plotted here are averaged over 3 separate runs of the experiment described in the text. Standard deviations of more than 0.5% are indicated with error bars.
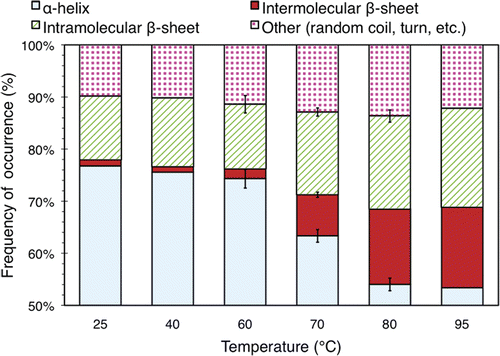
In the 25°C sample, 77.6% of the secondary structure content is α-helix, while 11.6% is intramolecular β-sheet, 1.1% is intermolecular β-sheet, and the remaining 9.7% is comprised of various other secondary structure types (random coils, turns, etc.). These values are consistent with other studies Citation[18], Citation[21], which report that the majority of the secondary structure motifs in BSA are α-helices.
The secondary structure distribution does not change significantly from the 25°C one for temperatures up to 60°C. However, at and above 70°C, an increasing number of the α-helices transform into other types of secondary structure, mainly β-sheets. Most notably, the number of intermolecular β-sheets rises significantly at 70°C, whereas only a small number are present below this temperature.
In the 95°C sample, α-helices comprise 53.1% of the secondary structure, while 15.3% is intermolecular β-sheet. Compared to the 25°C sample, the amount of α-helices has decreased by nearly one third while the number of intermolecular β-sheets has increased almost 14-fold.
Heat-induced cell death
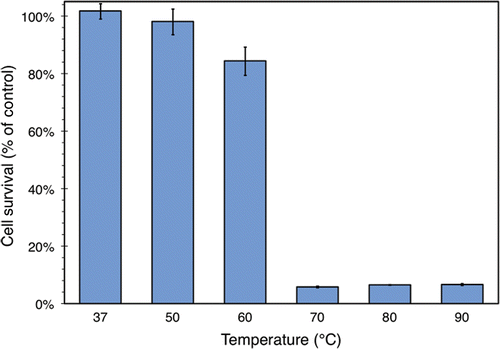
shows the fractions of surviving cells after 1 minute of heating across the range of temperatures tested. The values are plotted as a function of the peak temperature achieved in the sample (which is simply its temperature just before removal from the water bath). The figure shows that cell survival is essentially 100% up to 60°C, but drops sharply to near zero at 70°C and beyond.
Figure 7. Survival of ZR75.1 human breast cancer cells after 1 min of heating, expressed as a percentage of a control sample that was not heated. Cell survival was measured using an MTS assay. The temperature indicated is that of the water bath used to heat the samples, although the internal temperature of the samples themselves had settled to the within 1°C of this value by the end of the heating process. The values plotted here are averaged over 3 samples from one run of the experiment described in the text. Standard deviations are indicated with error bars.
Discussion
Relationship between protein denaturation and hydrogel opacity
Taken together, the protein structural analysis findings listed above explain the mechanism that links the opacity of BSA hydrogel with thermally induced denaturation of the proteins. The FTIR data in show that at the molecular level an increasing number of the α-helices in the BSA transform into intermolecular β-sheets as the proteins accumulate thermal damage beyond 60°C. This result also indicates that the BSA proteins are aggregating, because intermolecular β-sheets must be formed between two distinct protein molecules Citation[9] (although it should be noted that in general, this is not the only mechanism by which proteins can form aggregates). This is confirmed by the SEC data in , which shows that the conversion of BSA monomer into soluble aggregates follows a similar trend to the graph of intermolecular β-sheet formation against temperature displayed in . Hence, our results indicate that the biochemical mechanism of thermal denaturation in BSA is aggregate formation due to the conversion of α-helices into intermolecular β-sheets. These findings are also consistent with the literature: de Wit and Klarenbeek Citation[22] reported that apparent transition temperature of BSA is 66°C to 68°C (depending on the ambient pH), while Lin and Koenig Citation[21] found that BSA aggregation, protein unfolding, and intermolecular β-sheet conformation begin occurring past 60°C.
The link between the denatured BSA aggregates and the opacity of the bulk medium is provided by the UV/VIS results in , which again follow a similar trend to the graphs in and . The UV/VIS data demonstrate that as temperature is increased beyond 60°C, more insoluble BSA aggregates form and decrease the transmittance of light through the solution by acting as optical scattering agents. We expect that these insoluble aggregates are generated from the initially soluble ones, (as observed in the SEC data) which grow in size as more damage is accumulated and eventually become too large to remain dissolved.
The relationships described above form the complete mechanism that links change in the opacity of the BSA hydrogel with heat-induced denaturation of the proteins. To summarise, at the molecular level, an increasing number of the α-helices in the BSA transform into intermolecular β-sheets as the proteins accumulate thermal damage beyond 60°C. This causes the BSA molecules to form aggregates, which grow in size and eventually precipitate out of solution. These now-insoluble aggregates scatter incident light and thus decrease the optical transmittance of the medium at a macroscopically observable scale. In the case of BSA hydrogel, the optical change occurs locally because the matrix of the gel restricts the diffusion of aggregates through the medium. This local change in opacity can be measured using transmitted or backscattered light.
These results show that the opacity of a hydrogel with embedded BSA can serve as a proxy measure of the amount of thermal damage imparted to the proteins. This provides a means of monitoring heat-induced damage in BSA hydrogel quantitatively and in real time during hyperthermia or thermal ablation.
Biological relevance of the optical thermal damage metric
Having established that the opacity of BSA hydrogel provides an objective measure of the thermal damage sustained by the embedded proteins, it remains to show that this metric yields results that are comparable with the behaviour of a more biologically relevant system. To this end, the ZR75.1 human breast cancer cell survival rates illustrated in can be compared with the opacity of a BSA hydrogel exposed to similar temperature profiles.
The hydrogel opacity data used here were obtained as part of a previous study by Nandlall et al. Citation[7], although the results quoted here were not published in the referenced work. In this study a temperature-controlled set-up was used to subject identical slices of BSA polyacrylamide hydrogel to different levels of heating, with exposure temperatures ranging from 25°C to 90°C for times of up to 5 min. In each run of the experiment, the opacity and the in situ temperature of the hydrogel were monitored using a camera and an embedded thermocouple. An optical metric of thermal damage was formed by converting the images taken by the camera into 8-bit grayscale pixel intensities (JPEG format) that were normalised using an affine transformation, with 100% corresponding to undenatured gel and 0% corresponding to a gel that had been denatured at the highest temperature possible until its average grayscale pixel intensity had stabilised.
shows the normalised opacity of BSA hydrogel for the same peak temperatures and heating time (1 min) displayed in . The two figures clearly follow a similar pattern: there is little change in both the viability of the breast cancer cells and optical transmittance of the hydrogel up to 60°C, but both decrease markedly at 70°C and beyond. This trend is also seen in , , and , which respectively show UV/VIS optical transmittance, monomer loss, and intermolecular β-sheet formation in liquid BSA.
Figure 8. Normalized optical transmittance of a polyacrylamide hydrogel with embedded BSA after 1 min of heating. The experimental protocol and the normalization procedure are described in the text and in Citation[7]. The temperature indicated is that of the water bath used to heat the gel, although the internal temperature of the gel slices themselves had settled to the within 1°C of this value by the end of the heating process. The values plotted here are averaged over 3 separate experimental runs. Standard deviations are indicated with error bars.
![Figure 8. Normalized optical transmittance of a polyacrylamide hydrogel with embedded BSA after 1 min of heating. The experimental protocol and the normalization procedure are described in the text and in Citation[7]. The temperature indicated is that of the water bath used to heat the gel, although the internal temperature of the gel slices themselves had settled to the within 1°C of this value by the end of the heating process. The values plotted here are averaged over 3 separate experimental runs. Standard deviations are indicated with error bars.](/cms/asset/de48791f-d2ba-481f-a16a-c750cc78a524/ihyt_a_479451_f0008_b.gif)
The exact relationship between cell survival data and the optical transmittance of the BSA hydrogel would likely change considerably if another cell line were used, given that the maximum amount of heat damage that a cell can tolerate is generally dependent on the cell type. However, for our purposes, the similar trends observed between the breast cancer cell viability and BSA protein denaturation datasets shows that the proposed opacity-based metric of thermal damage yields results that are biologically relevant. Hence, the optical metric can be used to develop and test hyperthermia or thermal ablation protocols in controlled laboratory settings, where the goal is to measure the amount of thermal damage that the protocol would have imparted to cells without having to resort to techniques such as histology or cellular assays. As noted previously, in these scenarios the optical metric also has the significant added advantage that it can be monitored in real time, which is not the case for the other techniques.
Conclusions
Our data demonstrate a clear correlation between the degree of BSA denaturation in hydrogel and the optical transparency of the medium. Moreover, our work provides an experimentally verified explanation of the physical mechanisms that underlie this relationship by linking macroscopic variations in the opacity of the hydrogel with changes in the secondary structure distribution of the protein ensemble. Finally, our results illustrate that the opacity of BSA polyacrylamide hydrogel and the viability of a cancer cell line follow similar trends across a range of temperatures relevant to hyperthermia and thermal ablation.
In summary, our work shows that the opacity of hydrogels with embedded BSA provides a metric of accumulated thermal damage that is quantitative, real-time, and biologically relevant. These hydrogels may therefore be used for developing, testing and optimising hyperthermia or thermal ablation treatment protocols in controlled laboratory environments.
Acknowledgements
The authors would like to thank James Fisk, Roger Lewis, and Eleonora Mylonopoulou for their assistance.
Declaration of interest: The authors acknowledge the generous financial support of the Engineering and Physical Sciences Research Council of the United Kingdom (EPSRC). Sacha Nandlall's work is also supported by the National Sciences and Engineering Research Council of Canada (NSERC). Miriam Bazán-Peregrino acknowledges generous support from the Bellhouse Foundation and Magdalen College.
References
- Bancroft JD, Cook HC, Stirling RW. Manual of histological techniques and their diagnostic applications. Churchill Livingstone, LondonUK 1994
- Lazebnik M, Madsen EL, Frank GR, Hagness SC. Tissue-mimicking phantom materials for narrowband and ultrawideband microwave applications. Phys Med Biol 2005; 50: 4245–4258
- Takegami K, Kaneko Y, Watanbe T, Maruyama T, Matsumoto Y, Nagawa H. Polyacrylamide gel containing egg white as a new model for irradiation experiments using focused ultrasound. Ultrasound Med Biol 2004; 30: 1419–1422
- Bouchard L, Bronskill MJ. Magnetic resonance imaging of thermal coagulation effects in a phantom for calibrating thermal therapy devices. Med Phys 2000; 27: 1141–1145
- Lafon C, Kaczkowski PJ, Vaezy S, Noble M, Sapozhnikov OA. Development and characterization of an innovative synthetic tissue-mimicking material for high intensity focused ultrasound (HIFU) exposures. Proc IEEE Ultrasonics Symp 2001; 1295–1298
- Lafon C, Zderic V, Noble ML, Yuen JC, Kaczkowski PJ, Sapozhnikov OA, Chavrier F, Crum LA, Vaezy S. Gel phantom for use in high-intensity focused ultrasound dosimetry. Ultrasound Med Biol 2005; 31: 1383–1389
- Nandlall SD, Arora M, Schiffter HA, Coussios CC. On the applicability of the thermal dose cumulative equivalent minutes metric to the denaturation of bovine serum albumin in a polyacrylamide tissue phantom. Proc ISTU8 AIP 2009; 1113: 205–209
- Speyer G, Kaczkowski P, Brayman A, Andrew M, Kargl S, Crum LA. Quantitative assessment of thermal dose using photographic measurements of tissue discoloration. J Acoust Soc Am 2008; 123: 3223
- Berg JM, Tymoczko JL, Stryer L. Biochemistry. W. H. Freeman, New York, NY 2006
- Kampinga HH. Thermotolerance in mammalian cells: Protein denaturation and aggregation, and stress proteins. J Cell Biol 1993; 104: 11–17
- Lepock JR, Frey HE, Ritchie KP. Protein denaturation in intact hepatocytes and isolated cellular organelles during heat shock. J Cell Biol 1993; 122: 1267–1276
- Burgman PWJJ, Konings AWT. Heat induced protein denaturation in the particulate fraction of HeLa S3 cells: effect of thermotolerance. J Cell Physiol 1992; 153: 88–94
- Rylander MN, Feng Y, Bass J, Diller KR. Thermally induced injury and heat-shock protein expression in cells and tissues. Ann NY Acad Sci 2005; 1066: 222–242
- Xiang Y, Liu Y, Lee ML. Ultrahigh pressure liquid chromatography using elevated temperature. J Chromatogr A 2006; 1104: 198–202
- Arrondo JLR, Muga A, Castresana J, Goni FM. Quantitative studies of the structure of proteins in solution by Fourier-transform infrared spectroscopy. Prog Biophys Mol Bio 1993; 59: 23–56
- Hu YJ, Liu Y, Wang J, Xiao XH, Qu S. Study of the interaction between monoammonium glycyrrhizinate and bovine serum albumin. J Pharmaceut Biomed 2004; 36: 915–919
- Cui F, Fan J, Li J, Hua Z. Interactions between 1-benzoyl-4-p-chlorophenyl thiosemicarbazide and serum albumin: Investigation by fluorescence spectroscopy. Bioorgan Med Chem 2004; 12: 151–157
- Friedli GL. Interactions of deamidated soluble wheat protein with other food proteins and metals. PhD thesis, University of Surrey, UK 1996
- Barth A, Zscherp C. What vibrations tell us about proteins. Q Rev Biophys 2002; 35: 369–430
- Hirayama K, Akashi S, Furuya M, Fukuhara K. Rapid confirmation and revision of the primary structure of bovine serum albumin by ESIMS and FRIT-FAB LC/MS. Biochem Bioph Res Co 1990; 173: 639–646
- Lin VJC, Koenig JL. Raman studies of bovine serum albumin. Biopolymers 1976; 15: 203–218
- de Wit JN, Klarenbeek G. Effects of various heat treatments on structure and solubility of whey proteins. J Dairy Sci 1984; 67: 2701–2710
