Abstract
Discrepancies between hyperecho-predicted necrosed volume in ultrasound (US) images and the actual size of a thermal lesion might cause incomplete ablation or damage normal structures during high intensity focused US (HIFU) ablations. A novel dual-frequency sonication procedure is proposed to reduce this discrepancy. HIFU transducers of either 1 or 3.5 MHz were applied to transparent tissue-mimicking phantoms and ex vivo bovine liver samples. A diagnostic probe and a charge-coupled device (CCD) camera were used to record lesion formation in real time, allowing for comparison of the sizes of the hyperechoes in US images and the protein denaturing area on optical images. Bovine liver specimens were segmented to reveal the lesion's terminal sizes. Differences between actual lesion volume and hyperechoes in US images were demonstrated to be dependent on acoustic frequency and intensity. At a low frequency (1 MHz), the hyperechoes appeared to be larger than the actual volume, but the difference decreased with the duration of ablation. In contrast, at a high frequency (3.5 MHz), the hyperechoes were smaller for ablations lasting longer than 10 s. Moreover, given certain low-intensity conditions, lesions were formed without detectable hyperechoes (3.5 MHz), or hyperechoes appeared before a visible lesion was formed (1 MHz). Dual frequency sonications (low frequency followed by high frequency) produce more stable and larger lesions, and with less position shift, which might be useful for designing future ablation strategies.
Introduction
HIFU (high intensity focused ultrasound) is a therapeutic medical technique using focused ultrasound to extracorporeally heat and destroy pathogenic tissue. Over the past decade, HIFU has been applied in many different clinical investigations and has shown positive results Citation[1–4]. High-performance imaging systems, magnetic resonance imaging Citation[5–6] and ultrasound (US) scanning Citation[7–10] have been extensively studied to improve the efficacy of HIFU ablation. Ultrasonic imaging presents the advantages of low cost, high resolution and portability. Various ultrasound-based and magnetic resonance imaging (MRI) methods have been proposed for locating and monitoring lesions formed by HIFU ablation. MRI could provide real time tracking of the temperature elevation in the target region during ablation Citation[11], but faces limitations in terms of price and portability. Ultrasound-based methods aiming at quantifying the change of sound speed Citation[12–13], attenuation Citation[14], backscattering Citation[15], and tissue hardness (elastography) Citation[16] have been proposed, but also have their drawbacks. Currently, the changes of echogenicity at the target region appear to be a useful and convenient indicator of lesion location, and were used in commercial HIFU systems, e.g. Haifu Model JC (Chongqing Haifu Technology, China). Its size is assumed to correspond to the lesions created by HIFU Citation[17–18].
However, the hyperecho formation and tissue necrosis are caused by different physical mechanisms, and thus are not necessary the same in size. To analytically demonstrate the discrepancy between the hyperechoic region in US images and lesions formed by HIFU ablation, we performed a series of experiments with different ablation parameters, and compared the results in the following sections. We also designed a single-transducer, dual-frequency HIFU system that can reduce discrepancies between the actual lesion size and the hyperechoic area in US images.
Materials and methods
HIFU and imaging systems
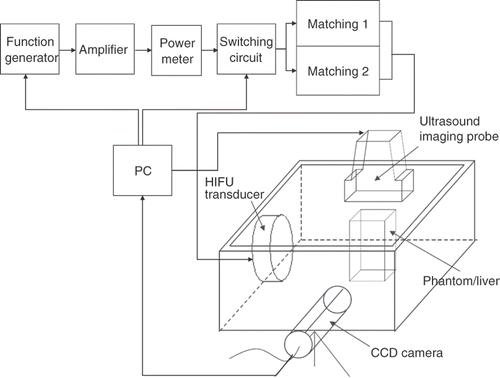
shows a schematic of the experimental set-up. The HIFU transducer, ultrasound imaging probe and a charge-coupled device (CCD) (1/3" Panasonic, 352 × 240 pixels, AVC, Taipei, Taiwan) camera were mounted in an orthogonal direction. The scanner head was positioned above the experimental sample. Two single-element focused piezoelectric transducers (1 and 3.5 MHz) were used as HIFU radiation sources. The geometric and acoustic parameters are listed in . The US field profile and peak focal pressure were calibrated using a 0.5-mm diameter needle hydrophone (SPEH-S-0500, ONDA, Sunnyvale, CA). The values of spatial peak temporal peak acoustic intensity (Isptp) at the foci of both transducers driven by different electrical power levels are listed in for comparison. For each transducer, the sonicating acoustic intensities were higher than the threshold for hyperecho generation in US images. Please note in that higher acoustic intensity was required at 3.5 MHz to produce visible hyperechoes.
Table I. Specifications of the two HIFU transducers in use.
Table II. Volume ratio (VR) of formed lesions (US/CCD camera) calculated after exposure to US at different electrical powers (and their corresponding acoustic intensities) at either (1) 1 MHz or (2) 3.5 MHz for 60-s, ex-vivo tissue-block experiments.
All experiments were performed in a 24 × 21 × 15 cm acrylic tank containing degassed water at 37°C. Radiofrequency signals from a function generator (33250 A, Agilent, Palo Alto, CA) were amplified by a power amplifier (150A250, Amplifier Research, Souderton, PA).
The single-element but dual frequency HIFU ablator was used to produce thermal lesions on tissue-mimicking phantoms, together with a home-made matching circuit which can be switched between 1 and 3.2 MHz by a LabView program on a personal computer. The frequency of 3.2 MHz was chosen as the third harmonic, due to the best output efficiency at around 3 MHz.
An US imager (TITAN, SonoSite, Bothell, WA) with a scanner head (L38/10-5, 7.5 MHz) mounted on an adjustable arm was aligned to capture the long or short axis of the HIFU lesions. A CCD camera was used to record the process of lesion formation in real time.
The transparent gel phantoms used in the current study were prepared from acrylamide/bis gel and egg white based on a previously reported recipe Citation[19–21]. The attenuation coefficient of the phantoms was 2.48 Np/m/MHz, which is a few times lower than that of most tissues Citation[22]. Our effort to increase the attenuation coefficient without compromising its transparency was unsuccessful. The thermal conductivity and the specific heat capacity were 0.59 ± 0.06 W/m/°C and 4270 ± 365 J/kg/°C, respectively, similar to the values of water Citation[23]. Moreover, the speed of sound (1544 m/s) and acoustic impedance (1.6 MRayls) are similar to the values found in soft tissue Citation[20].
Experimental series
To avoid interference between the HIFU output and US imaging, burst-mode HIFU signals (300,000 vibration cycles per second for both 1 and 3.5 MHz sonications) were used and synchronised with the imaging system using the method proposed by Vaezy et al. Citation[8]. Because of the low attenuation of phantoms and the cooling effect between HIFU bursts, the total duration of ablation was 60 s, longer than the duration per lesion used by commercial HIFU. The commercial HIFU ablation duration is normally in the range of seconds. In all experiments, the depth of US imaging was 5.5 cm. The experiments were repeated three to five times, and a lesion was made in each HIFU exposure.
Experiment 1: ex vivo tissue-block experiments
Fresh bovine liver blocks obtained commercially were ablated using either a 1 or 3.5 MHz HIFU transducer. Previous research has shown that the attenuation coefficients of bovine liver are 4.3 and 21 Np/m at 1 and 3.5 MHz, respectively Citation[22]. The exposure time was 30 s for each ablation. Because the actual lesion formation could not be known accurately by US imaging, each tissue block was slit through its central plane after ablation to allow for the comparison of the lesions’ volumes and maximal cross-sectional areas with those of the hyperechoic regions from the US images.
Experiment 2: in vivo phantom experiments
Experiments using transparent phantoms were performed to investigate the role of bubbles in HIFU lesion formation. The process of lesion formation could be monitored in real time by a CCD camera and then compared with the hyperechoic areas obtained by US imaging. The transparent tissue-mimicking phantoms were constructed from an acrylamide/bis gel containing 30% fresh albumin Citation[20–21]. The two transducers were driven at 40 to 70 W (electrical powers, around 50% transmission efficiency), with an exposure time of 60 s for each ablation. The relationship between the US images and the actual lesions was quantified based on lesions on optical and US images.
Experiment 3: dual frequency ablation
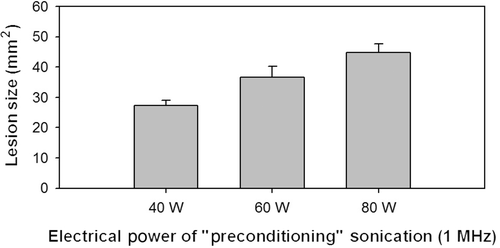
Since the lesion formation processes and results were very different for the low (1 MHz) and high (3.5 MHz) frequency conditions above (see details in the Results section), to circumvent the problem of frequency-dependent lesion formation, we designed and fabricated a computer switchable matching circuit for the 1-MHz HIFU transducer to operate either 1 or 3.2 MHz (1 MHz first followed by 3.2 MHz). Two sets of experiments were performed for lesion comparison for different sonication parameters. One is at either 1 MHz for 60 s, 3.2 MHz for 60 s, or 1 MHz for 30 s followed by 3.2 MHz for 60 s (all at 70 W), and the other is 1 MHz for 30 s at 40, 60 or 80 W followed by 3.2 MHz for 60 s (60 W). Since a LabView routine was used to switch the function generator and matching circuit, there was no delay between successive ablations. We hypothesised that the bubbles formed by 30-s low frequency sonication would serve as acoustic scatters for the following high-frequency ablation. The formed lesion would thus be enlarged because increased scatter effectively dispersed incoming acoustic energy. The same B-mode ultrasound system was used to evaluate bubble formation inside the gel phantoms.
Volume estimation and statistics
To quantify the size of lesions, both US and optical images were scaled according to the same standard. The images of each lesion were placed so that its central axis, the longest axis of a lesion, lay parallel to the horizontal axis of a rectangular coordinate system. Lesion volume was estimated by visually tracing the lesion border in the recorded images using Matlab by a single person, with the lesion border defined as the transitional line of a white lesion into the transparent unaffected gel. The typical clarity of the white lesion borders resulted in a small standard deviation of lesion size caused by tracing errors. To minimise potential errors, each lesion was traced three times and the estimated volumes were averaged. The lesions were assumed to be axially symmetric, hence their volumes (V ) could be approximated using n slices perpendicular to their central axes according to Equation 1where r is the distance from a point at the lesion border to its central axis and D is the thickness of each slice.
For each series, the volume ratio (VR) in Equation 2, defined as the ratio of hyperechoic volume in US images to that of denatured protein volume based on CCD-camera images, was used to quantify the lesion size from the B-mode US images.VR values are presented as mean and standard deviation (SD) values. Differences among groups were compared using Kruskal-Wallis test, with P < 0.05 considered indicative of statistical significance.
Lesion shift, defined as the distance between the geometric focus of the focused transducer and the position along the central axis where maximal lesion width was obtained, was also calculated to estimate the migration of lesions during ablations Citation[21].
Results
Experiment 1: ex vivo tissue-block experiments
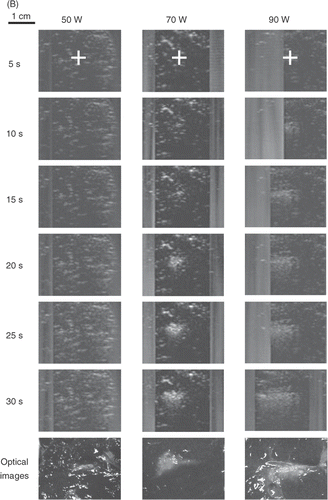
shows the ultrasound images of lesions formed by HIFU in bovine liver blocks with sonicating frequency of 3.5 MHz and electrical powers of 30, 50, and 70 W (Isptp of 815, 1022, and 1170 W/cm2, respectively). The white strips are HIFU beam captured by the US imaging system. The images in the bottom row of show the necrotic area inside the tissue blocks after ablation at 3.5 MHz for 30 s. At 30 W (3.5 MHz), no hyperecho was evident in the US images, whereas a cigar-shaped lesion was found in the cut blocks. In contrast, hyperechoic regions were readily evident at higher powers and grew with time. After 30 s of ablation, the actual lesion was larger than the hyperechoic region evident in the US images, thus the VR values were less than unity. Both of the VR values at 50 and 70 W for all time points were less than unity, and decreased with HIFU power.
Figure 2. Real-time monitoring of the lesion-formation process in bovine liver blocks for (A) a 3.5 MHz HIFU transducer at electrical powers of 30, 50, and 70 W. For each power level, B-mode US images were captured after 5, 10, 15, 20, 25, and 30 s of HIFU exposure. The last row shows the optical images of lesions after ablation was completed. Note that no hyperechoes were evident throughout ablation at 30 W. (B) Real-time monitoring of the lesion-formation process in bovine liver blocks for a 1 MHz HIFU transducer at electrical powers of 50, 70, and 90 W. For each power level, B-mode US images were captured after 5, 10, 15, 20, 25, and 30 s of HIFU exposure. Note that no hyperechoes were evident throughout ablation at 50 W. The HIFU transducer was on the left side and the US scanner head was at the top. The ‘+’ represents the focal points of the HIFU transducer. The vertical stripes on most US images, e.g. all images of 3.5 MHz and 30 W, represent the strong acoustic waves from the HIFU transducer picked up by the diagnostic probe.
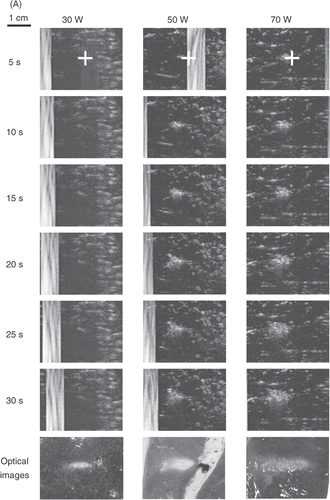
shows the results of the tissue-block ablations using a 1-MHz transducer at electrical powers of 50, 70, and 90 W (Isptp of 548, 659, and 749 W/cm2, respectively). No hyperecho was evident in the US images during ablation at 50 W, whereas a small lesion could be found in the cut blocks. The hyperechoic regions appeared at the higher powers. The VR values for 70 and 90 W increased with power and were closer to unity (). Ablation at higher frequency (3.5 MHz versus 1 MHz) produced a larger discrepancy between the area of visible hyperecho and actual lesion size.
Experiment 2: phantom experiments
and show the lesion-formation processes for HIFU ablation at 1 or 3.5 MHz monitored by US imaging and the CCD camera in transparent phantoms.
Figure 3. (A) Real-time monitoring of the lesion formation process in transparent tissue-mimicking phantoms for a 3.5 MHz HIFU transducer at electrical powers of 50 and 70 W. For each power level, the upper and lower frames are B-mode US and CCD camera images, respectively, captured after 10, 20, 30, 40, 50, and 60 s of HIFU exposure. The HIFU transducer was on the left side and the US scan head was at the top. (B) Volume ratio (VR) of lesions (US/CCD camera) formed by a 3.5 MHz HIFU transducer for different times and electrical powers. Data are mean and SD values. Dashed line equals 1.0.
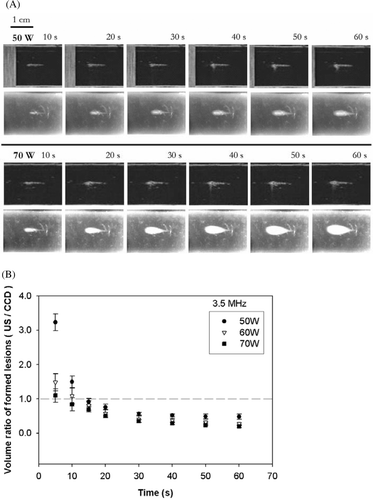
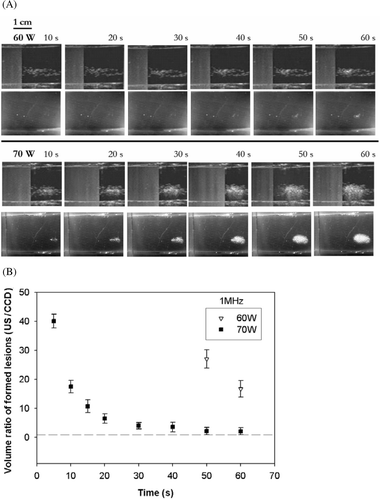
Figure 4. (A) Real-time monitoring of the lesion formation process in transparent tissue-mimicking phantoms for a 1-MHz HIFU transducer at electrical powers of 60 and 70 W. For each power level, the upper and lower frames are B-mode US and CCD camera images, respectively, captured after 10, 20, 30, 40, 50, and 60 s of HIFU exposure. The HIFU transducer was on the left side and the US scanner head was at the top. (B) VR of lesions (US/CCD camera) formed by a 1-MHz HIFU transducer at different times and electrical powers. Data are mean and SD values. Note that there is no value for 60 W before 40 s because no lesion was evident on the CCD camera images. Dashed line equals 1.0.
compares the optical appearance of a lesion in a tissue-mimicking phantom with the US appearance of hyperechoes for 3.5 MHz sonication at electrical powers of 50 to 70 W (Isptp of 1022 and 1170 W/cm2, respectively). No lesion was formed at electrical powers of 40 W or below. For each power level, the upper frames (rows 1 and 3) are the US images and the lower frames (rows 2 and 4) are the CCD-camera images at different times. shows a conspicuous decline over time in the VR values obtained at specific times, dropping below unity after 10 s. Although hyperechoes initially appeared to be larger, hyperechoes in the US images grew smaller in size than the actual lesions after 10 s, and were less than half of the actual lesion size after 30 s.
compares the lesions on optical and ultrasound images for 1 MHz sonication at 60 and 70 W (Isptp of 602 and 659, respectively). No lesion was formed at electrical powers of 50 W or below power levels at 1 MHz. The changes in VR with time are shown in . With electrical power at 60 W, a lesion was not produced until 40 s, while the hyperechoic region appeared immediately. An ‘explosion-like’ event occurred near the focus of the HIFU transducer Citation[24] and the hyperechoes that emerged rapidly became larger. The volume of bubbles in the US images was obviously larger than the lesion evident in the CCD-camera images. There was no VR value before 40 s, since no thermal lesion was visualised by the CCD camera. Once the lesion appeared in the CCD-camera images, the VR values decreased with time. At 70 W, both hyperechoes and lesions emerged at the beginning of the ablation, but the hyperechoes were still unrealistically large.
Experiment 3: dual frequency ablation
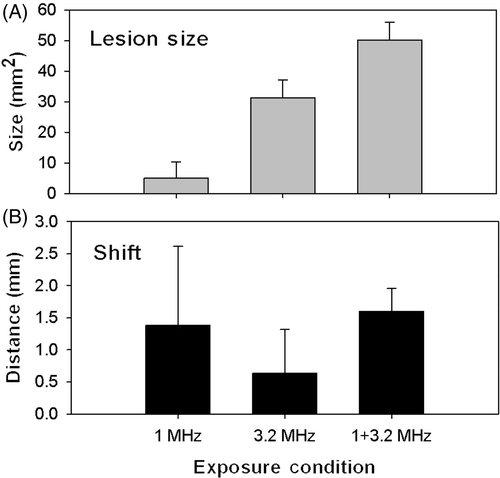
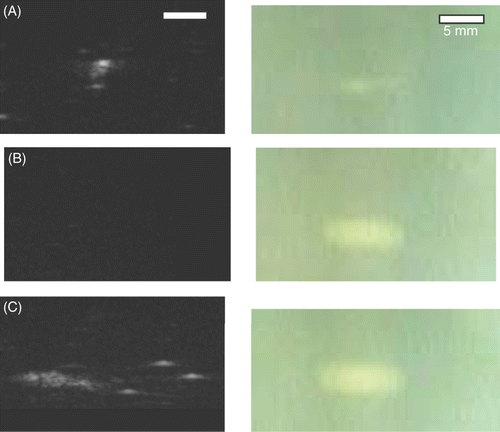
shows examples of formed lesions in US and optical images for 1, 3.2 and 1+3.2 MHz ablations. A large bubble surrounded by a few small bubbles presents as a bright hyperechoic spot surrounded by a few grey spots under 1 MHz conditions (). No hyperechoic area was found for ablation using 3.2 MHz HIFU for 60 s (), but a lesion could be clearly seen optically. However, an area of multiple hyperechoes with three hyperechoic spots was seen under dual frequency conditions (). The size of this hyperechoic area (1+3.2 MHz) corresponds well to the protein-denatured area in the tissue-mimicking phantom images taken using a CCD camera.
Figure 5. Ultrasonic (left) and optical (right) images of lesions formed by ablations using (A) 1 MHz for 60 s, (B) 3.2 MHz for 60 s, and (C) 1 MHz for 30 s followed by 3.2 MHz for another 60 s (all at 70 W). The ultrasonic image in (C) was shifted left to reveal the few large bubbles to the right of the bubble cloud.
shows ablations by HIFU (1 MHz for 30 s, and 3.2 MHz for another 60 s). No significant difference was found in the forward shift (toward the HIFU transducer) of lesions when compared with single ablation frequency (exact test, p = 0.294). It is important to note here that the first 30 s part of the dual-frequency ablation strategy (at 1 MHz) didn't produce any evidence of protein denaturing evident in the optical images. Ablations at 1 MHz for 30 s were assumed to induce microbubbles which would later enlarge the size of the finial lesion after the high-frequency ablation. Higher intensities of 1-MHz sonications were assumed to produce more microbubbles. Thus, as shown in , the higher the intensity of the initial 1-MHz ablation, the larger the final lesion sizes produced (p < 0.05).
Discussion and conclusions
Our study demonstrates that areas with hyperechogenicity in US images do not always accurately represent the protein-denatured volumes formed during HIFU ablation in either tissue-mimicking phantoms or bovine livers. That is, attempting to use hyperechoes in US images to estimate lesion size is inexact and unreliable. As mentioned above, hyperechoes in US images and lesions are formed by different physical mechanisms, with the former resulting from bubbles arising from cavitation or boiling, while the latter is attributable to protein denaturing due to heating Citation[25–27].
Since the threshold for cavitation and the extent of acoustic attenuation both relate to the frequency of incident US waves, lesion development should be different for different incident frequencies Citation[28]. One of our previous reports shows that sonication using low-frequency ultrasound produces more microbubbles by cavitation compared with those by high-frequency sonication. The formation of bubble clouds after low-frequency sonication could serve as a barrier to the further transmission of ultrasound Citation[29].
For high-frequency (3.2 or 3.5 MHz) sonications, the protein denaturing area in a tissue-mimicking phantom was usually smaller than the axial region of hyperechoes evident on B-mode images in the first few seconds (<10 s), which corresponds with previous research of ablation for 3 to 7 s using a similar transducer Citation[20]. However, for ablation over 10 s, the lesion grew rapidly with time due to heating, which resulted in VR values decreasing to below unity. Similar results were obtained in ex vivo tissue blocks ablated for 30 s at 50 and 70 W. Thus, lesion size could be easily underestimated when ablating with high-frequency HIFU for a longer duration and relying on hyperechoes in B-mode images.
Ablations at a lower frequency (i.e. 1 MHz) may anticipate a better agreement between the hyperecho and actual lesion size, except at the beginning of ablations. Since the threshold of inertial cavitation decreases with ultrasonic frequency, many more bubbles were generated at 1 MHz than at 3.5 MHz, and larger hyperechoes were observed. At that moment, the incident HIFU intensity was higher than the threshold for inducing inertial cavitation, but the duration of heat accumulation was shorter than that required for thermal lesion formation. Thus, numerous bubbles formed a bubble cloud in US images and resulted in errors in size estimates using hyperecho. Later on, the bubble cloud near the HIFU focus could serve as the centre for lesion formation, similar to lesions formed in the presence of an ultrasound contrast agent Citation[21], Citation[24].
Lesions were formed inside the bubble cloud and increased in size, eventually filling the bubble cloud, with VR thus approaching unity. However, in certain low intensity sonications, cigar-shaped lesions were produced in phantoms without the accompanying hyperechoes, such as when ablating at 45 W with 3.5 MHz HIFU and 60 W with 1 MHz HIFU under 40 s. Hyperechoes are the results of bubble activity, which could result from cavitation or boiling Citation[25]. Either due to heat accumulation being insufficient to induce boiling or below the threshold of inertial cavitation, cigar-shape lesions similar to the shape of the HIFU focus were formed by pure heat accumulation. These thermal lesions were invisible in US images. Previous research shows that the majority of a microwave-induced pure thermal lesion was invisible in US images, except for a few vapour bubbles forming along the antenna Citation[30].
Lesion shift is another problem for HIFU ablations. Under conditions of high frequencies (3.2 or 3.5 MHz) and strong power (e.g. 70 W) in phantoms, heat accumulated quickly and resulted in boiling-like activity. The subsequent ablation induced ultrasonic wave reflections on the front of the large bubbles, forcing the advance of the maximal heat accumulation towards the HIFU transducer. The continuous boiling-like activity further forced the lesion to move rapidly towards the transducer, or away from the HIFU focus. Finally, movement stopped due to a drop in pressure. Heat accumulation occurred at the end points of the boiling bubbles, and a tadpole-shaped lesion was formed. Details on the mechanisms of tadpole-shape lesion formation can be found in related research Citation[24–25]. A dual-frequency strategy could also reduce lesion shift.
This report tested a dual frequency HIFU system: two sequential ablations at low and high frequencies. Previous studies have shown that the dimensions of lesions produced by simultaneous dual-frequency US were significantly larger than those produced in single-frequency mode Citation[21], Citation[31–32]. The enhancement of lesion formation is believed to relate to the generation of microbubbles following the reduction of the cavitation threshold by the low frequency component Citation[33–34]. In this study, microbubbles were used to mark the area of protein denaturation. Presumably more heat accumulated in the region with bubbles. Better agreement of lesion size estimated by US images (using hyperechoes) could be achieved when compared with ablations performed by either high or low frequency US alone. Cavitation bubbles formed by 30 s of low frequency irradiation would serve as sound scatterers for the following high-frequency ablation. Higher intensity (1 MHz) ablation produces more bubbles. The thermal lesion was thus larger because increased scatter effectively dispersed incoming acoustic energy and heat into a larger area. Usually, the lesion occupies the area of bubble cloud or the regions of concentrated scatter, which explains the agreement of the hyperechoic region in US images with the actual protein-denatured area.
In summary, this study demonstrates that using hyperechoic regions evident in ultrasonic images to estimate the size of actual HIFU lesions is not always accurate, and disparities depend on the duration of ablation, the frequency and the acoustic intensity of the therapeutic US. Dual-frequency ablations using low frequency first, followed by high frequency, would increase prediction accuracy, and might be used in future clinical applications to ensure more complete ablation and reduce damage to surrounding normal structures.
Declaration of interest: This research was supported by grants from the National Science Council (94-2314-B-002-087) and National Taiwan University Hospital (95A14). The authors alone are responsible for the content and writing of the paper.
Reference
- Blana A, Walter B, Rogenhofer S, Wieland WF. High-intensity focused ultrasound for the treatment of localized prostate cancer: 5-year experience. Urology 2004; 63: 297–300
- Kennedy JE. High-intensity focused ultrasound in the treatment of solid tumours. Nat Rev Cancer 2005; 5: 321–327
- Agnese DM, Burak WE, Jr. Ablative approaches to the minimally invasive treatment of breast cancer. Cancer J 2005; 11: 77–82
- Wu F. Extracorporeal high intensity focused ultrasound in the treatment of patients with solid malignancy. Minim Invasive Ther Allied Technol 2006; 15: 26–35
- Hynynen K, Freund WR, Cline HE, Chung AH, Watkins RD, Vetro JP, Jolesz FA. A clinical, noninvasive, MR imaging-monitored ultrasound surgery method. Radiographics 1996; 16: 185–195
- Jolesz FA, Hynynen K, McDannold N, Tempany C. MR imaging-controlled focused ultrasound ablation: A noninvasive image-guided surgery. Magn Reson Imaging Clin N Am 2005; 13: 545–560
- Lizzi FL, Coleman DJ, Driller J, Silverman R, Lucas B, Rosado A. A therapeutic ultrasound system incorporating real-time ultrasonic scanning. Proc Ultrason Symp IEEE 1986; 981–984
- Vaezy S, Shi X, Martin RW, Chi E, Nelson PI, Bailey MR, Crum LA. Real-time visualization of high-intensity focused ultrasound treatment using ultrasound imaging. Ultrasound Med Biol 2001; 27: 33–42
- Miller NR, Bamber JC, ter Haar GR. Imaging of temperature-induced echo strain: Preliminary in vitro study to assess feasibility for guiding focused ultrasound surgery. Ultrasound Med Biol 2004; 30: 345–356
- Zhong H, Wan M, Jiang Y, Wang S. Differential ultrasonic imaging for the characterization of lesions induced by high intensity focused ultrasound. Ultrasonics 2006; 44: e285–288
- Cline HE, Hynynen K, Hardy CJ, Watkins RD, Schenck JF, Jolesz FA. MR temperature mapping of focused ultrasound surgery. Magn Reson Med 1994; 31: 628–636
- Sehgal CM, Brown GM, Bahn RC, Greenleaf JF. Measurement and use of acoustic nonlinearity and sound speed to estimate composition of excised livers. Ultrasound Med Biol 1986; 12: 865–874
- Seip R, Ebbini ES. Noninvasive estimation of tissue temperature response to heating fields using diagnostic ultrasound. IEEE Trans Biomed Eng 1995; 42: 828–839
- Ribault M, Chapelon JY, Cathignol D, Gelet A. Differential attenuation imaging for the characterization of high intensity focused ultrasound lesions. Ultrason Imaging 1998; 20: 160–177
- Zheng X, Vaezy S. An acoustic backscatter-based method for localization of lesions induced by high-intensity focused ultrasound. Ultrasound Med Biol 2010; 36: 610–622
- Thittai AK, Galaz B, Ophir J. Visualization of HIFU-induced lesion boundaries by axial-shear strain elastography: A feasibility study. Ultrasound Med Biol 2011; 37: 426–433
- Bailey MR, Couret LN, Sapozhnikov OA, Khokhlova VA, ter Haar G, Vaezy S, Shi X, Martin R, Crum LA. Use of overpressure to assess the role of bubbles in focused ultrasound lesion shape in vitro. Ultrasound Med Biol 2001; 27: 695–708
- Owen NR, Bailey MR, Hossack J, Crum LA. A method to synchronize high-intensity, focused ultrasound with an arbitrary ultrasound imager. IEEE Trans Ultrason Ferroelectr Freq Control 2006; 53: 645–650
- Takegami K, Kaneko Y, Watanabe T, Maruyama T, Matsumoto Y, Nagawa H. Polyacrylamide gel containing egg white as new model for irradiation experiments using focused ultrasound. Ultrasound Med Biol 2004; 30: 1419–1422
- Lafon C, Zderic V, Noble ML, Yuen JC, Kaczkowski PJ, Sapozhnikov OA, Chavrier F, Crum LA, Vaezy S. Gel phantom for use in high-intensity focused ultrasound dosimetry. Ultrasound Med Biol 2005; 31: 1383–1389
- Tung YS, Liu HL, Wu CC, Ju KC, Chen WS, Lin WL. Contrast-agent-enhanced ultrasound thermal ablation. Ultrasound Med Biol 2006; 32: 1103–1110
- Pohlhammer JD, Edwards CA, O'Brien JWD. Phase insensitive ultrasonic attenuation coefficient determination of fresh bovine liver over an extended frequency range. Med Phys 1981; 8: 692–694
- Divkovic GW, Liebler M, Braun K, Dreyer T, Huber PE, Jenne JW. Thermal properties and changes of acoustic parameters in an egg white phantom during heating and coagulation by high intensity focused ultrasound. Ultrasound Med Biol 2007; 33: 981–986
- Chen WS, Lafon C, Matula TJ, Vaezy S, Crum LA. Mechanisms of lesion formation in high intensity focused ultrasound therapy. Acoust Res Lett Online 2003; 4: 41–46
- Khokhlova VA, Bailey MR, Reed JA, Cunitz BW, Kaczkowski PJ, Crum LA. Effects of nonlinear propagation, cavitation, and boiling in lesion formation by high intensity focused ultrasound in a gel phantom. J Acoust Soc Am 2006; 119: 1834–1848
- Rabkin BA, Zderic V, Vaezy S. Hyperecho in ultrasound images of HIFU therapy: Involvement of cavitation. Ultrasound Med Biol 2005; 31: 947–956
- Rabkin BA, Zderic V, Crum LA, Vaezy S. Biological and physical mechanisms of HIFU-induced hyperecho in ultrasound images. Ultrasound Med Biol 2006; 32: 1721–179
- Chavrier F, Chapelon JY, Gelet A, Cathignol D. Modeling of high-intensity focused ultrasound-induced lesions in the presence of cavitation bubbles. J Acoust Soc Am 2000; 108: 432–440
- Liu HL, Chen YY, Chen WS, Shih TC, Chen JS, Lin WL. Interactions between consecutive sonications for characterizing the thermal mechanism in focused ultrasound therapy. Ultrasound Med Biol 2006; 32: 1411–421
- Chen WS, Wu CC, Fang HY, Liu HL. Differences in the lesion formation process between focused ultrasound and microwave ablations. Med Phys 2006; 33: 1346–51
- He PZ, Xia RM, Duan SM, Shou WD, Qian DC. The affection on the tissue lesions of difference frequency in dual-frequency high-intensity focused ultrasound (HIFU). Ultrason Sonochem 2006; 13: 339–344
- Kuang SL, Hu B, Jiang LX, He PZ, Xia RM, Shou WD. Confocal dual-frequency enhances the damaging effect of high-intensity focused ultrasound in tissue-mimicking phantom. Minim Invasive Ther Allied Technol 2008; 17: 285–291
- Sokka SD, Gauthier TP, Hynynen K. Theoretical and experimental validation of a dual-frequency excitation method for spatial control of cavitation. Phys Med Biol 2005; 50: 2167–2179
- Liu HL, Chen WS, Chen JS, Shih TC, Chen YY, Lin WL. Cavitation-enhanced ultrasound thermal therapy by combined low- and high-frequency ultrasound exposure. Ultrasound Med Biol 2006; 32: 759–767

