Abstract
This article is a redissemination of the previous Japanese Quality Assurance Guide guidelines. Specific absorption rate and temperature distribution were investigated with respect to various aspects including metallic implant size and shape, insertion site, insertion direction, blood flow and heating power, and simulated results were compared with adverse reactions of patients treated by radio frequency capacitive-type heating. Recommended guidelines for safe heating methods for patients with metallic implants are presented based on our findings.
Introduction
This article is a redissemination of the Japanese Quality Assurance Guide produced in March 2011 by the Japanese Society for Thermal Medicine (JSTH). The JSTH has previously provided guidelines for conducting safe heating in hyperthermia covering capacitively-coupled heating [Citation1], microwave heating [Citation2], and the protection of occupational personnel from exposure to electromagnetic radiation [Citation3]. Recently, papers regarding guidelines for effective and safe heating of deep-seated tumours [Citation4–8] have been published. Radio frequency (RF) capacitive-type deep heating is sometimes desired to treat patients having metallic stents or metallic implants for orthopaedic use. The presence of metallic stents or devices contra-indicates the application of such heating treatments, as RF currents concentrate around a metallic object, inducing hot spots. Such incidents have been reported in the course of treatments with RF capacitive or other type of heating [Citation9,Citation10].
Therefore, using the finite element method, we investigated specific absorption rate (SAR) and temperature distribution in patients, with respect to various aspects including metallic implant size and shape, insertion site, insertion direction, blood flow and heating power. Further, simulated results were compared with adverse reactions of patients treated by RF capacitive-type heating.
In the present report, recommended guidelines for safe heating methods for patients with metallic implants are presented based on our findings.
Simulation
Theory
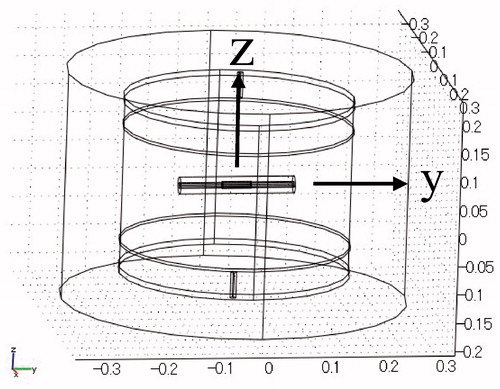
Computer-based simulations of heat generation and temperature distributions were performed using the 3D finite element method. shows the configuration of the simulation model. The mesh generator partitioned the subdomains into tetrahedral mesh elements. The mesh was created automatically according to the size of the subdomain and the curvature of the geometric boundary. The minimum mesh element size was 1.2 mm. The calculation space was 40 cm in height and 60 cm in diameter, and a column-shaped heating model 29 cm in height and 40 cm in diameter was positioned in the calculation space. The model was set to muscle. A pair of disk electrodes (40 cm in diameter) was placed to cover the entire upper and lower surfaces of the heating model. A pair of lead wires was connected to the electrodes in order to supply RF power of 8 MHz. The central axis and the centre of the heating model were defined as the z-axis and the origin of the coordinate, respectively. The centre of the stent was positioned at the centre of the heating model.
Figure 1. Configuration of the computer simulation model.
The SAR distribution was calculated using the following equations.
where, σ, ω, ε0, εr, V, ρ, and E are conductivity, angular frequency, permittivity of space, relative permittivity, potential, density, and electric field, respectively. ω is 2πf, and f is frequency. As the boundary condition, the following equation was used.
where n is the normal vector at the boundary, and J is the current density through the boundary.
The temperature distribution was calculated using the bio-heat transfer equation as follows.
where T, t, and Qext are temperature, time, and heat supply by RF power, respectively. ρ, C, k, Qmet are density, specific heat, heat conductivity, and metabolic heat of tissue, respectively. ρb, Cb, ωb, Tb are density, specific heat, flow rate, and temperature of blood, respectively.
Qext is expressed as
where SAR is the specific absorption rate and represents heat generation by RF power. The boundary condition required for calculating the temperature distribution is as follows.
Model
Biliary duct stent horizontal arrangement
Computer simulation of a biliary duct stent was performed assuming a titanium cylinder 10 mm in inner diameter, 1 mm in thickness, and 5 cm in length. The axis of the stent was placed on the y-axis. A lumen 10 mm in diameter and 20 cm in length was inserted into the stent. The centres of the stent and the lumen were set at the origin of the coordinate. In this setting, the axis of the stent was vertical to the direction of electric field.
Biliary duct stent vertical arrangement
The axis of the stent described above was placed parallel to the z-axis. In this setting, the axis of the stent was parallel to the direction of the electric field. In this placement the simulation was performed for two lengths of stent, i.e. 5 cm and 10 cm.
Oesophageal stent
Computer simulation of an oesophageal stent was performed assuming a titanium cylinder 20 mm in inner diameter, 1 mm in thickness and 10 cm in length. The axis of the stent was placed on the y-axis. A lumen 20 mm in diameter and 20 cm in length was inserted in the stent. The centres of the stent and the lumen were set at the origin of the coordinate. For tilting the stent, the stent was rotated around the x-axis, making the difference of levels between the opposite ends of the stent 0, 2, 4, and 6 cm. In setting the stent parallel to the direction of the electric field, the axis of the stent was placed on the z-axis.
Materials of the lumen
The material of the lumen was defined as vessel, muscle or air. In the case of the vessel lumen, blood at a temperature of 37 °C flows at a rate of 10 s−1 (i.e. the blood flow volume per second is 10 times the volume of the vessel lumen) in order to maintain the intravascular temperature at 37 °C.
Characteristics of materials and heating conditions
shows the characteristics of electrical and thermal characteristics for blood, muscle and air as defined for computer simulation. The initial (t = 0 min) temperatures of these materials were set at 37 °C, and RF power was supplied to a pair of electrodes. The amplitudes of the applied potential were ±50 V, and this condition corresponds to a heating power of 1319 W. After heating for 20 min, the amplitudes of the applied potential were reduced to ±30 V (corresponding to 475 W). The total heating time was 50 min.
Table 1. Electrical and thermal characteristics of blood, muscle and air.
Results
Control
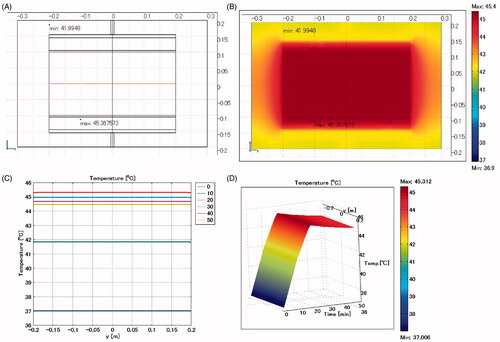
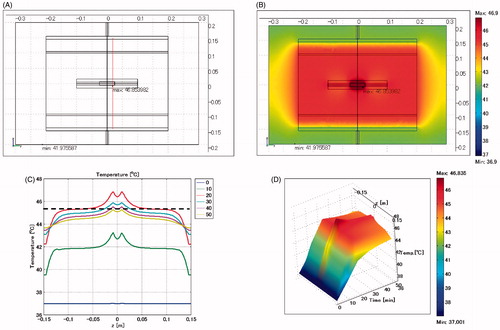
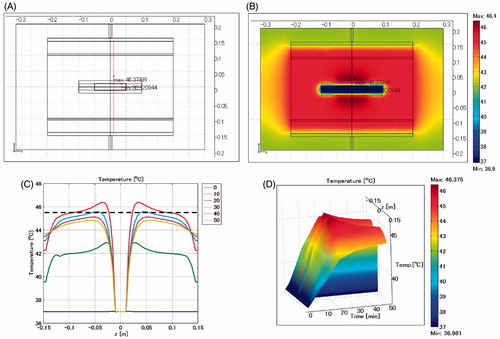
As a control model, no stent was placed in the heating material and the entire heating substance was assumed to be muscle (). shows a cross-sectional view of the model at x = 0 cm. shows the temperature distribution on the plane at x = 0 cm after heating for 20 min, indicating that the temperature of the muscle is uniform at 45.4 °C except the portion near the electrode. Although not shown in the figure, the heat generation in the muscle is uniform at SAR = 34 W/kg. shows the temporal temperature profiles on the red line in . The temperature profile is uniform: 37.0 °C at t = 0 min, 42 °C at t = 10 min, 45.4 °C at t = 20 min, 45.0 °C at t = 30 min, 44.7 °C at t = 40 min, and 44.5 °C at t = 50 min. shows the extrusion plot of the temperature distribution on the red line illustrated in . The horizontal axis indicates the heating time in minutes. When ±50 V is applied to the electrodes, the temperature rises linearly with time, reaching a peak at t = 20 min, and is then almost constant with time after the potential applied to the electrodes is changed to ±30 V.
Figure 2. Control model when a stent is not inserted. The entire heated substance is defined as muscle. (A) Cross-sectional view of the model at x = 0 cm. (B) Temperature distribution after heating for 20 min. (C) Temperature profiles on the red line shown in . Each curve is the temperature profile at the heating time (min) indicated in the insert on the right. (D) Extrusion plot of temperature distribution on the red line shown in . Horizontal axis indicates the heating time in min. Maximum SAR 34 W/kg; maximum temperature 45.4 °C.
Biliary duct stent horizontal arrangement
Lumen designated as vessel
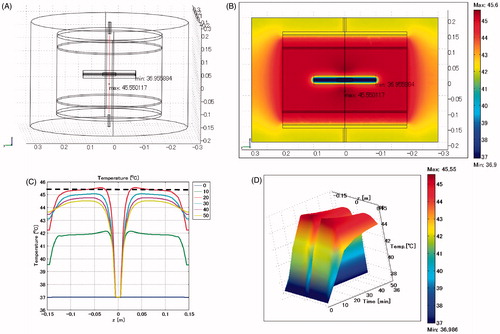
shows the biliary duct stent model positioned horizontally, and the lumen is defined as a vessel. The maximum SAR is 328 W/kg arising adjacent to the edge of the stent toward the electrode. is the configuration of the model, showing the position for calculating the temperature profile by a red line that includes the site where the maximum temperature arises. The maximum temperature is 45.6 °C, which occurs at the heating time of t = 20 min, approximately 3 cm distant from the stent. The broken line in shows the control temperature of 45.4 °C which is the temperature profile at 20 min heating shown in .
Figure 3. Biliary duct stent placed in horizontal direction. Lumen: vessel. (A) Cross-sectional view of the model at x = 0 cm. (B) Temperature distribution after heating for 20 min. (C) Temperature profiles on the red line shown in . The broken line is the control, which indicates the temperature profile after heating for 20 min shown in . (D) Extrusion plot of temperature distribution on the red line shown in . Maximum SAR 328 W/kg; maximum temperature 45.6 °C.
Lumen designated as muscle
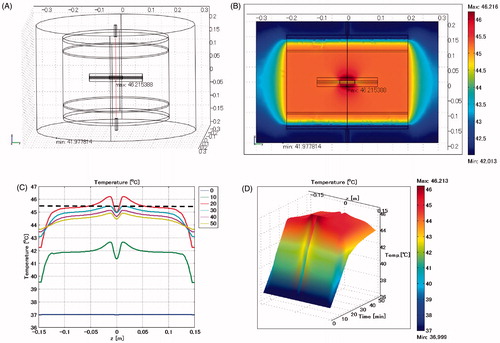
shows the temperature distribution when the biliary duct stent is positioned horizontally and the lumen is defined as muscle. The maximum SAR is 392 W/kg arising adjacent to the edge of the stent towards the electrode. The maximum temperature is 46.2 °C, which occurs at the heating time of t = 20 min, approximately 1 cm distant from the stent.
Figure 4. Biliary duct stent placed in horizontal direction. Lumen: muscle. (A) Cross-sectional view of the model at x = 0 cm. (B) Temperature distribution after heating for 20 min. (C) Temperature profile on the red line shown in . The broken line is the control, which indicates the temperature profiles after heating for 20 min shown in . (D) Extrusion plot of temperature distribution on the red line shown in . Maximum SAR 392 W/kg; maximum temperature 46.2 °C.
Lumen designated as air
shows the temperature distribution when the biliary duct stent is positioned horizontally and the lumen is defined as air. The maximum SAR is 649 W/kg arising adjacent to the edge of the stent towards the electrode. The maximum temperature is 46.9 °C, which occurs at the heating time of t = 20 min, approximately 5 mm distant from the stent.
Figure 5. Biliary duct stent placed in horizontal direction. Lumen: air. (A) Cross-sectional view of the model at x = 0 cm. (B) Temperature distribution after heating for 20 min. (C) Temperature profiles on the red line shown in . (D) Extrusion plot of temperature distribution on the red line shown in . Maximum SAR 649 W/kg; maximum temperature 46.9 °C.
Biliary duct stent vertical arrangement
Lumen designated as vessel
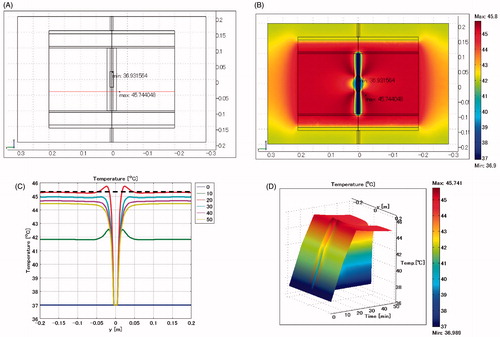
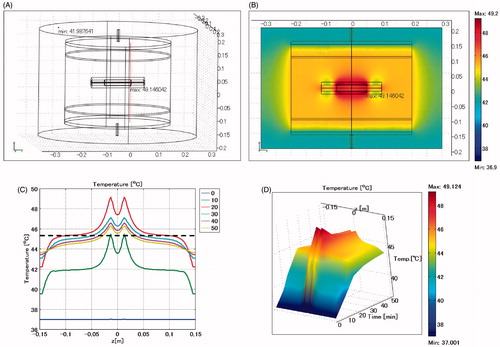
shows the temperature distribution when the biliary duct stent is positioned vertically and the lumen is defined as a vessel. The maximum SAR is 2027 W/kg arising adjacent to the edge of the stent. The maximum temperature is 45.7 °C, which occurs at the heating time of t = 20 min, approximately 2 cm distant from the stent.
Figure 6. Biliary duct stent placed in vertical direction. Lumen: vessel. (A) Cross-sectional view of the model at x = 0 cm. (B) Temperature distribution after heating for 20 min. (C) Temperature profiles on the red line shown in . (D) Extrusion plot of temperature distribution on the red line shown in . Maximum SAR 2027 W/kg; maximum temperature 45.7 °C.
Lumen designated as air
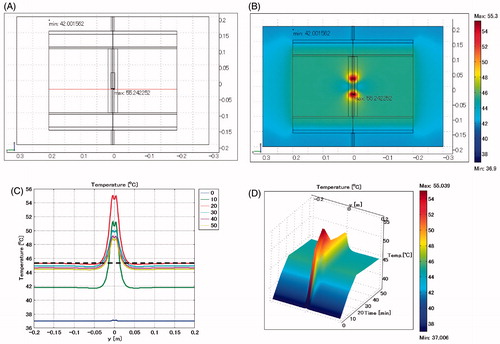
shows the temperature distribution when the biliary duct stent is positioned vertically and the lumen is defined as air. The maximum SAR is 2525 W/kg arising adjacent to the edge of the stent, which is approximately 75 times the SAR in the homogenous muscle phantom. The maximum temperature is 55.2 °C which occurs at the heating time of t = 20 min, near the edge of the stent.
Figure 7. Biliary duct stent placed in vertical direction. Lumen: air. (A) Cross-sectional view of the model at x = 0 cm. (B) Temperature distribution after heating for 20 min. (C) Temperature profile on the red line shown in . (D) Extrusion plot of temperature distribution on the red line shown in . Maximum SAR 2525 W/kg; maximum temperature 55.2 °C.
Effect of stent length
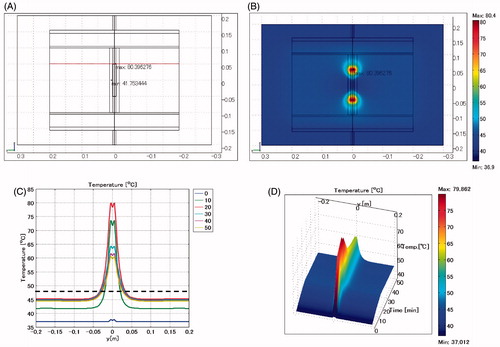
shows the temperature distribution when the length of the biliary duct stent is changed to 10 cm and is positioned vertically. The lumen is defined as air. The maximum SAR is 5557 W/kg arising adjacent to the edge of the stent. The maximum temperature of 80.4 °C occurs near the edge of the stent.
Figure 8. Biliary duct stent placed in vertical direction. Length: 10 cm. Lumen: air. (A) Cross-sectional view of the model at x = 0 cm. (B) Temperature distribution after heating for 20 min. (C) Temperature profiles on the red line shown in . (D) Extrusion plot of temperature distribution on the red line shown in . Maximum SAR 5557 W/kg; maximum temperature 80.4 °C.
Summary for biliary duct stent
summarises the excessive temperature rise when the biliary duct stent is placed in the muscle and heated under various conditions. When the stent is placed in the horizontal direction, the maximum SAR is almost 10 times that in the control having no stent. However, the excessive temperature rise in the case of stent insertion is only 1 °C compared with the control.
Table 2. Excessive temperature rise when placing a biliary duct stent in the muscle and heating under various conditions.
When the stent is placed in the vertical direction the maximum SAR is approximately 70 times that in the control. The excessive temperature increases by almost 10 °C when blood flow is not present; however, excessive temperature rise does not occur due to cooling effects of the blood flow.
When the stent is placed in the vertical direction and its length is increased from 5 cm to 10 cm, maximum SAR becomes approximately 160 times that of the control, and an extreme temperature rise occurs.
Oesophageal stent horizontal arrangement
Lumen designated as vessel
shows the temperature distribution when the oesophageal stent is positioned horizontally, and the lumen is defined as a vessel. The maximum SAR is 433 W/kg arising adjacent to the edge of the stent towards the electrode. The maximum temperature is 46.4 °C, which occurs at the heating time of t = 20 min, approximately 2 cm distance from the stent.
Figure 9. Oesophageal stent placed in horizontal direction. Lumen: vessel. (A) Cross-sectional view of the model at x = 0 cm. (B) Temperature distribution after heating for 20 min. (C) Temperature profiles on the red line shown in . (D) Extrusion plot of temperature distribution on the red line shown in . Maximum SAR 433 W/kg; maximum temperature 46.4 °C.
Lumen designated as air
shows the temperature distribution when the oesophageal stent is positioned horizontally and the lumen is defined as air. The maximum SAR is 950 W/kg arising adjacent to the edge of the stent towards the electrode. The maximum temperature is 49.1 °C, near the edge of the stent.
Figure 10. Oesophageal stent placed in horizontal direction. Lumen: air. (A) Cross-sectional view of the model at x = 0 cm. B: Temperature distribution after heating for 20 min. (C) Temperature profiles on the red line shown in . (D) Extrusion plot of temperature distribution on the red line shown in . Maximum SAR 950 W/kg, maximum temperature 49.1 °C.
Placement of stent at an angle
In order to simulate the tilting of the stent, the stent is rotated around the x-axis, making the difference in levels between the opposite ends of the stent 2, 4, or 6 cm.
Lumen designated as vessel
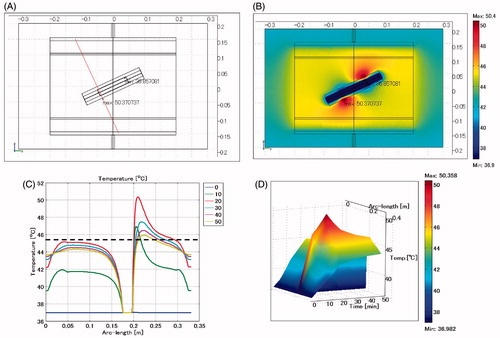
shows the temperature distribution when the oesophageal stent is placed at an angle and the lumen is defined as a vessel. The difference in levels between the opposite ends of the stent is 4 cm. The maximum SAR is 1576 W/kg arising adjacent to the edge of the stent toward the electrode. The maximum temperature is 50.4 °C, approximately 1 cm distance from the edge of the stent.
Figure 11. Oesophageal stent. Difference of levels: 4 cm. Lumen: vessel. (A) Cross-sectional view of the model at x = 0 cm. (B) Temperature distribution after heating for 20 min. (C) Temperature profiles on the red line shown in . (D) Extrusion plot of temperature distribution on the red line shown in . Maximum SAR 1576 W/kg, maximum temperature 50.4 °C.
Lumen defined as air
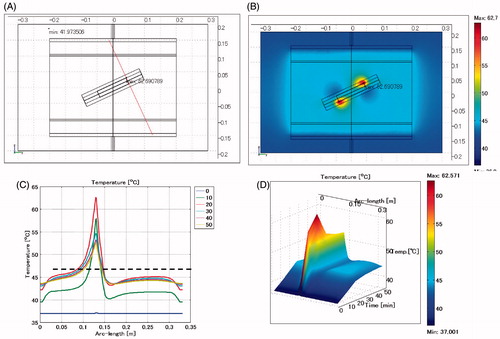
shows the temperature distribution when the oesophageal stent is placed at an angle and the lumen is defined as air. The difference in levels between the opposite ends of the stent is 4 cm. The maximum SAR is 2678 W/kg arising adjacent to the edge of the stent toward the electrode. The maximum temperature is 62.7 °C, near the edge of the stent.
Figure 12. Oesophageal stent. Difference of levels: 4 cm. Lumen: air. (A) Cross-sectional view of the model at x = 0 cm. (B) Temperature distribution after heating for 20 min. (C) Temperature profile on the red line shown in . (D) Extrusion plot of temperature distribution on the red line shown in . Maximum SAR 2678 W/kg, maximum temperature 62.7 °C.
Summary for oesophageal stent
summarises the excessive temperature rise when the oesophageal stent is placed in the muscle and treated in various heating conditions. When the lumen material is defined as air, the maximum SAR increases in accordance with the angling of the stent central axis towards the vertical direction. When the central axis of the stent is in the vertical direction, the maximum SAR becomes 130 times that of the control, and the temperature rises excessively by 31 °C compared with the control.
Table 3. Excessive temperature rise when using an oesophageal stent.
When the lumen material is defined as a vessel, the maximum SAR increases in accordance with angling of the stent central axis toward the vertical direction. However, the temperature rise is limited to only 7 °C due to the cooling effect of blood flow.
Summary of simulation
The temperature rise near the stent differed depending on the shape of the stent, the direction of the stent relative to the electric field, and the type of lumen material. The edges of the temperature profiles in , , and did not fall, due to less thermal dissipation by the air, which has low heat capacity and low heat conductivity, while the edges of the temperature profiles in , , , , , and fell due to the considerable thermal dissipation by the copper, which has high heat capacity and large heat conductivity and does not generate heat energy. summarises the excessive temperature rise relative to the heating conditions. When the stent was placed in the horizontal direction, no notable excessive temperature rise appeared regardless of the presence of blood flow or the shape of the stent. However, in the case of no blood flow, a remarkable temperature rise occurred with the tilting of the central axis of the stent to the vertical.
Table 4. Excessive temperature rise under various heating conditions.
In the case of a patient having an oesophageal stent with a lumen filled with air, an excessive temperature rise can occur near the stent, leading to a very dangerous condition for the patient.
Excessive temperature rise in clinical practice
and , respectively, show the adverse reactions observed when patients with stents were treated with capacitive-type heating at Aino Hospital, and the University Hospital of Occupational and Environmental Health, in Japan. The following are suggested from and . 1) no adverse reaction occurs when a patient having a biliary duct stent is treated with RF capacitive-type heating, and 2) serious adverse reactions may occur when a patient having an oesophageal stent is treated with RF capacitive-type heating.
Table 5. Adverse reactions when capacitive-type heating was applied in patients having a stent (Aino Hospital).
Table 6. Adverse reactions when capacitive-type heating was applied in patients having stents (Hospital of the University of Occupational and Environmental Health Japan).
Conclusion
From the computer simulation results and actual adverse reactions noted in clinical heating treatment, an excessive temperature rise will occur when 1) electric fields are concentrated on the stent, and 2) there is less cooling effect due to a lack of blood flow.
As a result of this investigation, the following guidelines are recommended for use in the safe heating in capacitive-type heating treatment situations.
Summary of recommended guidelines
Recommended guidelines for safe heating treatment using the 8 MHz capacitive-type external heating method for patients having a metallic stent are as follows.
Patients with a stent in a deep location can be heated at low risk when the stent is positioned parallel to the capacitive electrode and has a diameter of less than 1 cm and length less than 5 cm.
Patients with an oesophageal stent must not undergo a treatment.
Patients with a vascular stent can be heated with low risk when blood flow exists in the vascular vessel, but may be at high risk if the vascular vessel is occluded.
Patients with a biliary duct stent are at low risk when bile flows in the lumen of the stent, but might be at high risk when there is no such flow.
Patients with a stent placement other than those described above are at low risk when liquid flow exists in the stent, but might be at high risk in the absence of any such liquid flow in the lumen of the stent or if the lumen is filled with gas.
When the direction of the stent is parallel to the capacitive electrode, heating can be done at low risk, regardless of the presence of a liquid flow in the stent.
If the stent direction is perpendicular to the capacitive electrode, high risk of excessive heating around the metallic stent arises, regardless of the presence of a liquid flow in the stent. Moreover, in cases with no liquid flow in the stent, severe excessive heating will be induced around the stent.
The greater the stent length or diameter, the greater the risk of excessive heating as described in item 7 above. The use of a stent longer than 10 cm or larger than 2.5 cm in diameter should be strictly avoided.
RF power is supplied to produce a temperature rise of 1 °C/min at the start of heating in usual treatment. For patients with a stent, however, at the start of a first heating treatment the supply of RF power must be increased gradually from 0 W while simultaneously carefully observing the state of the patient.
The above recommended guidelines are general, and the risks of excessive heating vary with the particular conditions of each patient, such as the insertion location of the stent, the flow rate of liquid in the stent, the existence of gas in the stent, and the shape, length, diameter and direction of the stent.
Declaration of interest
The authors report no conflicts of interest. The authors alone are responsible for the content and writing of the paper.
References
- Kikuchi M, Amemiya Y, Egawa S, Onoyama Y, Kato H, Kanai H, et al. Guide to the use of hyperthermic equipment. 1. Capacitively-coupled heating. Int J Hyperthermia 1993;9:187–203
- Kikuchi M, Amemiya Y, Egawa S, Onoyama Y, Kato H, Kanai H, et al. Guide to the use of hyperthermic equipment. 2. Microwave heating. Int J Hyperthermia 1993;9:341–360
- Kikuchi M, Amemiya Y, Egawa S, Onoyama Y, Kato H, Kanai H, et al. Guide for the protection of occupationally-exposed personnel in hyperthermia treatment from the potential hazards to health. Int J Hyperthermia 1993;9:613–624
- Ohguri T, Yahara K, Moon SD, Yamaguchi S, Imada H, Terashia H, et al. Deep regional hyperthermia for the whole thoracic region using 8MHz radiofrequency-capacitive heating device: Relationship between the radiofrequency-output power and the intra-oesophageal temperature and predictive factors for a good heating in 59 patients. Int J Hyperthermia 2011;27:20–26
- Shen H, Li X-D, Wu C-P, Yin Y-M, Wang R-S, Shu Y-Q. The regimen of gemcitabine and cisplatin combined with radio frequency hyperthermia for advanced non-small cell lung cancer: A phase II study. Int J Hyperthermia 2011;27:27–32
- Kang MK, Kim MS, Kim JH. Clinical outcomes of mild hyperthermia for locally advanced rectal cancer treated with preoperative radiochemotherapy. Int J Hyperthermia 2011;27:482–490
- Bruggmoser G. Some aspects of quality management in deep regional hyperthermia. Int J Hyperthermia 2012;28:562–569
- Canters RAM, Paulides MM, Franckena MF, van der Zee J, van Rhoon GC. Implementation of treatment planning in the routine clinical procedure of regional hyperthermia treatment of cervical cancer: An overview and the Rotterdam experience. Int J Hyperthermia 2012;28:570–581
- de Bruijne M, Wielheesen DH, van der Zee J, Chavannes N, van Rhoon GC. Benefits of superficial hyperthermia treatment planning: Five case studies. Int J Hyperthermia. 2007;23:417–429
- Lee ER, Sullivan DM, Kapp DS. Potential hazards of radiative electromagnetic hyperthermia in the presence of multiple metallic surgical clips. Int J Hyperthermia. 1992;8:809–817