Abstract
Laser-induced thermotherapy (LITT) is a hyperthermic procedure recently employed to treat cancer in several organs. The amount of coagulated tissue depends on the temperature distribution around the applicator, which plays a crucial role for an optimal outcome: the removal of the whole neoplastic tissue, whilst preventing damage to the surrounding healthy tissue. Although feedback concerning tissue temperature could be useful to drive the physician in the adjustment of laser settings and treatment duration, LITT is usually performed without real-time monitoring of tissue temperature. During recent decades, many thermometric techniques have been developed to be used during thermal therapies. This paper provides an overview of techniques and sensors employed for temperature measurement during tissue hyperthermia, focusing on LITT, and an investigation of their performances in this application. The paper focuses on the most promising and widespread temperature monitoring techniques, splitting them into two groups: the former includes invasive techniques based on the use of thermocouples and fibre-optic sensors; the second analyses non-invasive methods, i.e. magnetic resonance imaging-, computerised tomography- and ultrasound-based thermometry. Background information on measuring principle, medical applications, advantages and weaknesses of each method are provided and discussed.
Introduction
Techniques based on hyperthermia are largely employed in clinical practice to treat cancer [Citation1]. These treatments induce a temperature increment within a body district for tumour ablation. During recent decades, laser-induced thermo therapy (LITT) is spreading as a technique to induce localised hyperthermia. LITT is a minimally invasive surgical technique, in which the radiation emitted by a laser source is guided by a fibre optic within the tissue to be treated. The laser energy absorption leads to a localised heating able to induce cellular death. Currently, LITT is employed to treat tumours in several organs, such as, liver, lungs, prostate, brain [Citation2] and, more recently, pancreas [Citation3,Citation4]. Temperature values reached within the tissue play a crucial role in LITT outcome, and the spatial temperature distribution defines the volume of coagulation, thus the amount of tissue undergoing thermal damage. Therefore the monitoring of temperature increase during LITT provides useful feedback in order to adjust laser dosimetry, and results can be pivotal for effective therapy aimed at completely removing the neoplastic volume without thermal damage to the surrounding healthy tissue. The monitoring of temperature has been considered essential in all hyperthermic treatments, and since the 1970s some investigations focused on this issue [Citation5]. Christensen defines an accurate measurement of the achieved temperature ‘a crucial ingredient of any hyperthermia procedure’ [Citation6]; Cetas et al. also considered the monitoring of temperature distribution essential to widespread hyperthermia procedures [Citation7,Citation8]. The research effort devoted to the development of temperature monitoring during thermal therapies, and with particular regard to LITT, allowed the introduction of several techniques along the last 30 years. The first invasive approaches monitored the temperature in only one or a few points around the fibre applicator, utilising temperature sensors such as thermocouples [Citation9], thermistors, and fibre-optic sensors [Citation10]. During the 1970s and 1980s other approaches based on infrared thermometry [Citation8] or on medical imaging techniques such as ultrasound tomography [Citation11], MRI [Citation12], and CT scan [Citation13], were considered attractive because of their non-invasiveness.
This paper shows an overview of the techniques used to monitor tissue temperature during LITT, which could be also useful in clinical practice to provide the physician with tissue temperature feedback information. The main part of these techniques has been introduced to monitor temperature in other widespread therapies such as, among others, radiofrequency ablation. In particular we will focus on the use of the most widely adopted temperature sensors in LITT (i.e. thermocouples), on fibre-optic based sensors, and lastly, on non-invasive techniques, i.e. MRI thermometry, CT scan thermometry and ultrasound-based thermal imaging, which are attractive because LITT is a minimally invasive thermal therapy.
The paper is divided into subsections where essential descriptions of the measuring principles of the different techniques are presented along with the main applications in temperature monitoring during hyperthermic procedures, focusing on LITT. An analysis of the performances of the different techniques, their main advantages and drawbacks, and the main concerns related to the particular field of application are discussed.
Invasive approaches for temperature monitoring during LITT
In this section, three of the most widely used invasive approaches for temperature monitoring during hyperthermia are described. The need to introduce the sensing element within the organ is the main drawback of these methods, which require direct contact with the measurement site. Furthermore, since the information about the outcome of LITT is related to the distribution of tissue temperature, a number of sensors are required. The above-mentioned features contribute to the classification of these techniques as invasive approaches, even though efforts are dedicated to the minimisation of the number of probes necessary to the temperature map estimation.
Temperature monitoring by thermocouples
Thermocouples are widely used because of some valuable characteristics: they are mostly cost-effective, quite accurate and have a wide measurement range, moreover, the small size and the rapid response make them suitable for localised monitoring of temperature with fast changes. On the other hand, the main concerns in their use during LITT are related to the invasiveness of the measurement and to the metallic constitution of thermocouples. Their metallic conductors highly absorb the radiation emitted by laser, and this phenomenon causes a local increase of temperature, entailing a significant overestimation of the actual tissue temperature. In spite of this ‘artefact’, thermocouples are the most widely used sensors for temperature measurement during LITT. Moreover, the use of unshielded thermocouples allows small size and short response time, although an increase of fragility; the use of shielded thermocouples overcomes the fragility at the expense of an increase of the response time and size.
The issues related to temperature monitoring by thermocouples have been investigated since the 1970s by Christensen during hyperthermia induced by RF and microwaves [Citation6], and afterwards by LITT [Citation14].
Thermocouple: background and applications in LITT
As is well known, a thermocouple consists of two different metal wires joined in two junctions. The electromotive force of the open circuit is a non-linear function of the temperature difference between the two junctions. During LITT, the two conductors, usually embedded in a thin needle, strongly absorb the laser radiation, inducing an error in the temperature measurement. In addition to the invasiveness, the main concern in the use of thermocouples during LITT is the measurement error mentioned, resulting in a significant overestimation of the actual surrounding tissue temperature [Citation9].
Use of thermocouples is reported in several studies dedicated to temperature monitoring during LITT in different tissues, among others, retina [Citation15], during laser angioplasty [Citation16], liver [Citation17], and benign prostatic hyperplasia [Citation18]. This section does not aim to describe all the studies reporting the use of thermocouples during LITT, but to highlight the main advantages and concerns related to their use.
A deep investigation of the overestimation caused by the strong absorption of laser light by thermocouple was carried out by Anvari et al., who showed that the increase of temperature due to the direct absorption of laser radiation by thermocouple is almost instantaneous [Citation19]. Therefore, they proposed to correct this measurement error by splitting the temperature increase into two phenomena: the former with short response time is caused by the artefact mentioned, the second one with a longer response time is actually caused by the tissue temperature increase. A few years later, Manns et al. analysed the overestimation of temperature caused by the direct radiation absorption of the thermocouple in water, intralipid, and porcine tissue at different distances from the optical fibre applicator [Citation14]. The same research group adopted the above-mentioned correction for temperature monitoring during LITT of breast cancer [Citation20,Citation21,Citation22]. Reid et al. [Citation23] analysed temperature differences measured by thermocouples and fluoroptic probes at different distances from a cylindrical applicator emitting laser radiation at 810 nm. They applied laser light to different materials (i.e. air, water, and agar-albumin phantom), and recorded a maximum temperature difference of about 10 °C between the values measured by thermocouple and flouroptic sensor during the laser application in the agar-albumin phantom. Recently, van Nimwegen et al. also performed temperature monitoring with thermocouples during Nd:YAG laser treatment on canine prostate. They also showed a relevant artefact due to the direct absorption, and erased the temperature increase with a short response time to correct it [Citation24].
As described, the artefact can cause a substantial overestimation of the actual tissue temperature, in particular close to the fibre applicator, which can reach almost 20 °C [Citation14]; therefore, its correction becomes crucial.
Since the artefact presents a shorter response time than the temperature increase of the tissue, as shown in , it can be corrected by subtracting the sudden temperature increase or decrease which happens when the laser is turned on or off, respectively. The correction is based on a simple model describing the temperature trend measured by thermocouple, Tm, during the tissue cooling after the laser is turned off [Citation24] as in Equation 1.
where A1 is a constant, B1 · e−C1t and D1 · e−E1t are the gradual tissue cooling and rapid thermocouple cooling, respectively. Since the time constant 1/E1 is shorter than 1/C1, it is possible to subtract the component due to thermocouple direct absorption (D1 · e−E1t). By using this approach, tissue temperature after the laser switch off is A1 + B1 · e−C1t. Other authors have proposed a method to correct the artefact taking into account the heating phase [Citation14]. They consider the temperature trend to constitute two terms: the former is exponential and represents the error due to the thermocouple direct light absorption; the second is linear and caused by the light absorption of tissue, as in Equation 2.
where A2, B2 and C2 are constants.
Figure 1. Trend of temperature measured during LITT by thermocouples. (A) Thermocouple artefact when laser is turned on and turned off [Citation24]. (B) Temperature increase measured by thermocouples (TC) at different distances from the applicator: TC1 at 2 mm, TC2 at 4 mm, TC3 at 6 mm, and TC4 at 10 mm [Citation19].
![Figure 1. Trend of temperature measured during LITT by thermocouples. (A) Thermocouple artefact when laser is turned on and turned off [Citation24]. (B) Temperature increase measured by thermocouples (TC) at different distances from the applicator: TC1 at 2 mm, TC2 at 4 mm, TC3 at 6 mm, and TC4 at 10 mm [Citation19].](/cms/asset/7de175b2-fc10-4dc6-9f8d-c4e1eb9c8593/ihyt_a_832411_f0001_b.jpg)
A technique to perform a more accurate correction of the artefact is based on the repetition of laser switching on and off in order to measure the amplitude of the artefact by averaging its value on several trials ().
Summing up, the main concern related to the use of thermocouples during LITT is the artefact caused by the strong absorption of the thermocouple at the wavelength usually adopted in LITT (near-infrared); obviously, the closer the distance to the applicator, the higher is the overestimation due to the direct light absorption. Furthermore, the invasiveness of measurements based on thermocouples does not allow the monitoring of the temperature in a large number of points because of the clinical trauma.
Temperature monitoring by fibre-optic sensors
Many kinds of fibre-optic sensors (FOS) are used for temperature measurements. The widespread use of FOS, and in particular of fibre Bragg grating (FBG) sensors, has been delayed by the high equipment costs and by the relatively poor interest of the medical community. However, over the last two decades, the medical community’s interest in FOS has grown because of the cost reduction of key optical components and the increase in component quality.
Current literature presents two predominant typologies of FOS for thermometry during LITT: FBG sensors and fluoroptic probes. Both the FBG and the fluoroptic sensors are quite invasive, because they perform temperature measurement by contact. A further drawback of fluoroptic sensors is related to artefacts, in particular when the sensing element is encapsulated in black-pigmented coating. As far as it concerns the FBG sensors, a couple of weaknesses are related to the need of expensive tools to detect the optical signal, and the sensitivity to strain; therefore, temperature measurements during in vivo trials can be influenced by movement of organs due to respiration. On the other hand, FBGs show the valuable characteristic of immunity from electromagnetic interferences, which avoids measurement error due the high electromagnetic field during measurement in LITT; moreover, they have a rapid response due to their small size. Both fluoroptic probes and FBGs are MRI compatible, and this feature makes them suitable to be employed as reference sensors in MRI-based thermometry.
Fibre Bragg gratings: background and application in LITT
FBGs are periodical perturbations of the refraction index of an optical fibre [Citation25,Citation26] photo-inscribed within the core of the fibre. The working principle of FBGs is based on the detection of a wavelength shift (ΔλB), due to change of temperature or strain. The Bragg wavelength (λB) is expressed by Equation 3.
where neff is the effective refractive index of the fibre core, and Λ is the period of index modulation. When a broadband light source propagates within the fibre, a narrowband spectral component centred at λB is reflected by the grating. A perturbation of the measurand causes a λB shift (ΔλB), which can be considered an indirect measurement of temperature or strain. In particular, ΔλB depends on temperature changes (ΔT) because of the thermal expansion of fibre material (changes of Λ), and on the temperature dependence of neff; whereas dependence of ΔλB on strain (ε) is due to physical elongation of the sensor and corresponding variation of Λ, and the change in neff due to photoelastic effect.
When FBGs are employed as temperature sensors, the contribution of ε changes on ΔλB should be neglected with respect to ΔT. When the measurand is T, the thermal response of silica fibre is dominated by the changes of neff with T (about 95% of the observed shift).
FBGs have been introduced in the biomedical field over the last 20 years [Citation27,Citation28,Citation29] due to their useful features, such as the electromagnetic inert nature, the small size, the biocompatibility, the non-toxicity and chemical inertness, the capability to be encapsulated into thin and flexible optical fibres. A number of gratings can be easily embedded into a single fibre, since the nominal λB is different, and they can be interrogated by the same optical spectrum analyser. This is an attractive feature, because distributed FBG sensor can be realised by housing an array of multiple gratings within the same fibre.
The first in vivo study employing FBGs for temperature monitoring during hyperthermia was performed by Rao et al. [Citation30], who developed a novel FBG temperature sensor system: the strain-free probe, which was designed by enclosing the FBG sensor array in a protection sleeve (diameter of 0.5 mm). The system showed a resolution of 0.1 °C and an accuracy of 0.2 °C over a temperature range between 30 °C and 60 °C. The same group of researchers tested the performance of a similar FBG-based temperature sensor inside a Nuclear Magnetic Resonance (NMR) machine with a magnetic field of 4.7 T. The probe revealed a resolution of 0.1 °C and an accuracy of 0.5 °C, for temperatures ranging from 25 °C to 60 °C [Citation31]. The first in vivo trials with this novel probe were carried out by Webb et al. on diseased livers and healthy kidneys of rabbits undergoing hyperthermia [Citation32]; a good agreement with temperature measurements performed by a reference fluoroptic probe was found. Other works were designed to perform temperature profile monitoring in ex vivo and in vivo animal models [Citation33] and human models [Citation34] during hypothermia.
As reported above, FBGs are sensitive to temperature but also to strain, therefore in previous works they were housed within a probe to prevent the gratings from undesirable strains. Recently, the feasibility of inserting FBGs in direct contact with tissue undergoing hyperthermia, without protective capsule, has been investigated. Saccomandi et al. [Citation35] assessed that FBGs do not experience any appreciable mechanical strain which could entail an error in temperature measurement because of the relaxation of ex vivo tissue under its weight. Ex vivo tissue was kept at constant room temperature for 800 s and experienced a Δλ corresponding to a ΔT lower than 0.1 °C, hence the influence of tissue strain on temperature measurements has been assumed negligible.
The same research group employed six FBG sensors with sensitive length of 1 cm for temperature distribution monitoring in ex vivo pancreatic porcine tissue undergoing LITT, at several laser settings (power of 3 W and 6 W, energy of 1000 J) and a distances of 5 mm, 10 mm and 15 mm in symmetrical configuration.
When in vivo temperature monitoring is performed, the presence of possible movements can cause measurement errors, hence the encapsulation of FBGs with a protective sleeve is recommended. Although the use of FBGs in hyperthermia procedures should be further examined, they represent an efficient sensor to be employed in MRI-guided LITT, thanks to their immunity to electromagnetic fields, and to perform temperature distribution monitoring, thanks to the feasibility of embedding a number of gratings within a single fibre. The possibility of developing small-sized FBGs allows measurement to be performed with high spatial resolution (i.e. 1 mm). Some drawbacks are related to the cost of the optical spectrum analyser, and to the invasiveness of inserting the fibres into the body part undergoing LITT.
Fluoroptic sensors: background and applications in LITT
Fluoroptic sensor technology, patented by Luxtron, now LumaSense Technologies (Santa Clara, CA, USA), is based on the fluorescence decay time of a special thermo-sensitive rare-earth phosphor (such as magnesium fluorogermanate activated with tetravalent manganese), located at the end of a fibre-optic cable [Citation36]. The decay time of the phosphor is a function of temperature of the phosphor itself. An excitation light pulse generated by a source propagates through the fibre, and excites the phosphor layer at its extremity. The fluorescent signal produced by the exciting phosphor is sent back within the same fibre. After the excitation, the fluorescent signal decays with an exponential law which depends on the temperature of the phosphor. The correlation between the decay time and the temperature of the fluorophore allows an estimate of the temperature at the end of the fibre [Citation37], .
Figure 2. (A) Fluorescent decay time of phosphor sensor. Decay time is the time between the initial measurement of signal level S1 and the signal level S1/e. (B) Phosphor temperature as a function of temperature [Citation36].
![Figure 2. (A) Fluorescent decay time of phosphor sensor. Decay time is the time between the initial measurement of signal level S1 and the signal level S1/e. (B) Phosphor temperature as a function of temperature [Citation36].](/cms/asset/d9e28a4d-43ac-40b2-9068-eee86a3faaef/ihyt_a_832411_f0002_b.jpg)
The valuable features of fluoroptic sensors are (1) the wide range of measurement, typically from −25 °C to 300 °C, (2) the accuracy of 0.2 °C, (3) the immunity to electromagnetic interferences, (4) the inertness and biological compatibility, (5) the chance to realise a multi-sensor system by sharing the pulsed excitation source among several channels [Citation36].
The characteristics of the phosphor do not depend on the intensity of excitation, therefore this type of sensor is versatile for many applications and sensor designs. Furthermore, since the excitation light signal and the fluorescent decay signal travel along the same optical path, the size of the fibre-optic probe and sensing tip can be reduced; a diameter less than 0.5 mm can be an attractive feature in medical research applications.
Fluoroptic temperature sensors are widely used in LITT, especially in MRI-guided hyperthermia. This is mainly due to MRI compatibility. Since the estimation of temperature distribution within a tissue undergoing LITT can also be performed by MR imaging, fluoroptic probes are also employed to provide the reference temperature in MRI thermometry calibration [Citation38,Citation39]. Nevertheless, efforts are made to characterise the performances of fluoroptic sensors in thermometry during laser irradiation because of the presence of measurement error caused by the self-heating of fluoroptic sensors [Citation38]. This artefact mainly depends on the black pigments in the coating of fluoroptic probe [Citation40]. Reid et al. assessed that measurement error induced by self-heating of the fluoroptic probe in presence of laser irradiation cannot be neglected if the distance between the laser applicator and the sensor is less than 4 mm [Citation23].
In conclusion, fluoroptic sensors are suitable for temperature monitoring within tissues undergoing LITT, although the influence of black-pigmented encapsulation on artefacts must be taken into account, particularly if the sensor is placed close to the laser applicator.
Non-invasive approaches for temperature monitoring during LITT
Some research groups have focused their attention on the development of methods based on medical imaging techniques for temperature monitoring. The interest growth in these new methods is motivated by their non-invasiveness and on the chance to obtain a temperature map around the applicator. These considerations apply to all the thermal therapies, but strengthen when extended to laser ablation. LITT is a minimally invasive technique, and it could be performed by means of endoscopic guides in some areas (e.g. liver and pancreas [Citation4]), therefore the use of non-invasive thermometry would be desirable. The aim is to avoid the insertion of several sensors in addition to the optical applicator, and therefore minimise the dimension of operative tools to be introduced within the body. In this section three promising non-invasive approaches adopted for temperature monitoring during LITT are illustrated. In particular, in the following subsections describe the fundamentals, advantages and drawbacks of the CT-, MR-, and ultrasound-based thermometry.
CT-based thermometry
In recent years considerable research effort has been devoted to the development of CT-based thermometry for monitoring tissue temperature during hyperthermia treatment [Citation41]. In the late 1970s, Bydder and Kreel conducted a study regarding the influence of temperature on the calibration procedure of CT scanners, and the changes in water CT number with temperature were experimentally assessed [Citation42]. A few years later Fallone et al. [Citation13] used the CT scanner to perform a non-invasive temperature estimation and proposed the introduction of this technique during hyperthermia treatment. Despite the valuable characteristics of non-invasiveness, technical difficulties mainly related to the reproducibility and spatial resolution of CT scanners discouraged the widespread use of this technique except for calibration purposes [Citation43]. Therefore, CT-based thermometry sank into oblivion, and only recent improvements in CT scanner performances have encouraged investigations of the feasibility of this method to provide feedback in hyperthermia dosimetry, and some ex vivo and in vivo studies have been performed [Citation44]. Undoubtedly, the patient’s exposure to X-ray radiation is the most important issue in the use of CT scanners. On the other hand, we want to note that the mostly palliative character of hyperthermia treatment in patients with limited life expectancy and the acceptable radiation exposure of healthy organs which are adjacent to the organ undergoing LITT also need to be considered in the analysis of feasibility of CT-based thermometry, as also reported by Bruners et al. [Citation41]. These characteristics with the non-invasiveness make the use of CT-based thermometry during LITT attractive in some particular cases.
CT-based thermometry: background and applications in LITT
Although a mathematical analysis of CT working principles is far beyond this review, a basic understanding of the essential physics of CT image formation is necessary to describe the thermometry. An image obtained by CT scan is composed of pixels (picture elements), which display the average X-ray attenuation properties of the tissue in the corresponding voxel (volume elements). A series of X-rays pass through the patient, and the transmitted rays reach the detectors after modulation. The intensity of transmitted X-rays depends on the linear attenuation coefficient, μ. A single image is obtained by the reconstruction of transmitted X-rays passing through the patient at a large number of orientations, called projections or views. Each pixel corresponds to raw data, representing the linear attenuation coefficient, which is processed and finally converted into the CT number, also called the Hounsfield unit (HU). The CT number is obtained by the following relationship.
where μW is the attenuation coefficient of water, and μ(x, y) is the average linear attenuation coefficient in the (x, y) voxel.
The μ(x, y) value depends on the phenomenon of interaction between tissue and X-ray. During CT scans this phenomenon is mainly due to the Compton scattering because of the high photon energy used. Therefore, the temperature dependence of physical parameters which influence the phenomenon of Compton scattering is the basis of the CT thermometry. A simplified description of the temperature influence on CT can be performed by considering that μ tracks linearly with the tissue physical density (ρ).
The change of μ depends on the phenomenon of thermal expansion; in fact, the density of a material at a generic temperature, T, can be expressed as in Equation 5.
being ρ(T0) the material density at a reference temperature (T0), α the volumetric expansion coefficient, and ΔT = T − T0. Since the linear relationship between CT and ρ, considering Equation 4 and Equation 5, and after performing a linearisation based on Taylor series expansion in αΔT [Citation45], we obtain Equation 6.
where ΔCT = CT(T) − CT(T0) is the difference between the CT variation, when temperature changes from T0 to T.
Some investigations have been carried out on the feasibility of CT thermometry in temperature monitoring during hyperthermia. In the early 1980s, Fallone et al. [Citation13] published for the first time the CT decrease with T of biological tissue (i.e. muscle). The CT changes of muscle were induced by an external water bath in a range from 20 °C to 60 °C, and the thermal sensitivity was about −0.45 HU °C−1. It also showed that the reproducibility of the area averaged CT number decreases with the area of the selected region of interest (ROI), and finally they predicted that CT thermometry was able to discriminate fractions of degrees Celsius with spatial resolution in the order of 1 cm. Since the 1980s, other studies focused on the evaluation of CT thermometry feasibility for temperature mapping during hyperthermia [Citation46] or other applications [Citation45], but also during recent years the improvement of CT scanner performance has generated widespread research activity in CT thermometry and the chance to introduce this technique into hyperthermia monitoring [Citation44]. Bruners et al. performed temperature mapping during RF hyperthermia on ex vivo swine livers, and they obtained a thermal sensitivity ranging from −0.35 HU °C−1 to −0.44 HU °C−1; they also reported results on in vivo trials, showing concerns related to artefacts, which distort the measurement of CT number [Citation41]. Pandeya et al. studied the CT thermal sensitivity in ex vivo swine livers, by heating the tissue with a hot air flux from 20 °C to 95 °C. They showed a sensitivity of about −0.54 HU °C−1 [Citation47]. Pandeya et al. also studied the CT thermal sensitivity in ex vivo bovine livers, by heating the tissue with RF from 20 °C to 98 °C. They showed a sensitivity of about −0.60 HU °C−1 [Citation48]. The same research group assessed the feasibility of CT thermometry during LITT by performing experiments on ex vivo bovine liver. They showed a thermal sensitivity of −0.65 HU °C−1 in a temperature range from 18 °C to 85 °C [Citation49]. Among recent studies, the most detailed analysis of the influencing factors on the performances of CT thermometry were performed by Bruners et al. on phantoms [Citation50]. They heated the phantoms by using a temperature-controlled water bath. By analysing the influence of some CT scan parameters on the standard deviation of CT numbers, they found that the standard deviation decreased with the increase of tube current–time product, tube voltage and slice thickness, and with the decrease of collimation thickness. They also assessed the thermal sensitivity of water, sunflower oil and contrast agent dilutions, an almost linear relationship between CT and temperature for the different fluid samples.
The ideal requirements for non-invasive temperature monitoring during hyperthermic ablation therapies include an accuracy of 1–2 °C, a spatial resolution of 1–2 mm, and an acquisition time lower than 10–30 s [Citation51]. Experiments on water, some other fluids, and on ex vivo biological tissues [Citation52] are promising and appear to match the mentioned requirements. Furthermore, a CT scanner does not need special devices with respect to non-invasive thermometry based on MRI, and when used to monitor temperature during LITT, the concerns related to the metallic artefacts are overcome; on the other hand, further studies are needed to assess the feasibility of this technique, in particular in vivo trials should increase the standard deviation of averaged CT number on a ROI, moreover the dose must be taken into account.
Ultrasound-based thermometry
Ultrasound imaging for temperature estimation in soft tissue dates from 1979, when a group of the University of Arizona [Citation11,Citation53] carried out the first in vitro and in vivo experiments to assess the feasibility of this technique in canine organs (liver, kidney, brain, skeletal muscle, spleen and fat). The encouraging outcome of this non-invasive approach, and the availability of ultrasound probes in many research centres, motivated interest about ultrasound-based thermometry, also promoting patents, from the early 1980s onwards [Citation54].
Ultrasound-based thermometry: theoretical background and application in LITT
In ultrasound imaging, a high-frequency sound wave (commonly ranging from 2 MHz to 15 MHz) is transmitted into the body by an ultrasound probe. When the wave interacts with the tissue, an amount of wave energy is reflected back to the probe: the time delay between the transmitted ultrasound and the received one is an indirect measurement of the characteristics of the medium it passed through. The image is formed by echoes generated by reflection of ultrasound waves at the boundaries of tissues. Each echo is displayed at a particular coordinate of the image, depending on its relative position within the body cross-section [Citation55].
Several ultrasound parameters were investigated for temperature estimation, such as frequency-dependent attenuation, change in backscattered power and shift in ultrasound frequency signal; the last one is the most widely used principle for temperature monitoring in the medical field [Citation56]. In particular, the time of echo for ultrasound in a homogenous medium is expressed as Equation 7.
where t(T0) is the time delay of echo at position z and at temperature T0, and vs(T0) is the speed of sound in the tissue at temperature T0. In the presence of a temperature change ΔT, a time shift, Δt, in the ultrasound signal occurs, due to both the thermal expansion of the medium and the change of sound speed. Since the influence of thermal expansion is negligible with respect to the change of sound speed and the dependency of time shift with depth can be removed, the relationship between ΔT and Δt can be expressed as Equation 8.
where k1 is a tissue constant that can be experimentally determined, and d(Δt)/dt is the derivative of the time shift, also called normalised time shift.
Thermal images representing the heating of tissue during laser ablation are computed by a motion algorithm estimating the Δt in consecutive ultrasound frames. Once the normalised time shift is obtained, this is converted into a temperature map.
The temperature dependence of propagation speed has been investigated by a research group from the University of Wisconsin, in canine ex vivo tissue, placed within a water bath, at several temperatures in the range from 20 °C to 95 °C. They reported an increase of propagation speed of about 20 m/s for temperatures ranging from 20 °C to 60 °C, and a decrease of 15 m/s in the range 60 °C to 95 °C [Citation57]. Although depending on temperature, the propagation speed is not influenced by tissue coagulation during treatment. In fact, no changes in propagation speed are observed before or after hyperthermia in the same tissue specimens at 37 °C.
Although widely investigated for non-invasive temperature estimation during hyperthermia induced by ultrasound applicator [Citation58,Citation59], during radiofrequency ablation [Citation60], and photothermal therapy [Citation61], only a few studies discussed the feasibility of ultrasound thermal imaging during LITT. In particular, Lemor et al. proposed ultrasound diagnostic imaging for estimation of temperature and tissue structural changes [Citation62] during LITT. In vivo and ex vivo animal livers underwent LITT and a 5-MHz scanning probe was used to obtain the images. Temperature distribution was monitored taking into account the temperature dependency of the speed of sound, whereas tissue denaturation was monitored considering the variation of attenuation coefficient. Reference temperature sensors (i.e. Pt-100) were employed for calibration purposes. During in vivo trials, the researchers experienced the presence of artefacts in ultrasound images because of breathing and pulse movements.
The temperature resolution in ultrasound thermal imaging is strictly related to the motion algorithm adopted. The spatial resolution is mainly influenced by the kernel size employed in the motion algorithm, and by ultrasound frequency. An ultrasound pulse with higher bandwidth results in images with better spatial resolution at the expense of penetration depth.
In this approach a relevant aspect is related to the presence of physiological motion or unexpected variation in acoustic tissue properties which could cause artefacts in ultrasound thermal imaging. Nevertheless, artefacts can be removed and compensated by images post-processing.
The main advantages of ultrasound thermal imaging are (1) the employment of non-electromagnetic and non-ionising waves, (2) the non-invasiveness of the method, (3) the visualisation of a map of temperature, useful to adjust laser dosimetry, also in real time, and (4) the widespread availability of ultrasound technology that could be a valid alternative to the high costs related to other established techniques (e.g. MRI or CT thermometry).
MRI-based thermometry
The first study about the relationship of MR parameters with temperature was carried out by Bloembergen et al. [Citation63] in 1948, and since 1983 MRI-based thermometry has been considered as a non-invasive approach to internal temperature estimation, when Parker et al. [Citation64] observed variations in local temperature within water and blood samples. A few years later, Jolesz et al. [Citation65] developed the technique of MRI-guided LITT and investigated the capability of MR images to visualise and distinguish the region of tissue damaged by laser energy deposition. MRI-based thermometry emerged as a natural consequence of the LITT development, because of the use of MRI-compatible instrumentation (i.e. optical fibres guiding laser beams).
The big research effort to assess the feasibility of temperature monitoring through changes of some MRI parameters has shown that T1 relaxation time and proton resonance frequency (PRF) are the most attractive [Citation66]. The T1 relaxation time dependence on temperature shows the main advantage of high sensitivity at low field; however, it is strongly tissue dependent and the presence of lipid can cause significant artefacts, which can be minimised by lipid suppression techniques [Citation67]. The PRF shift method overcomes the strong dependence on tissue. A further valuable characteristic is the linearity of its relationship with temperature; its main concern is due to motion artefacts [Citation66].
For deeper analyses, the reviews of Plewes and Kucharczyk [Citation68] about the physics of MR, and by Rieke and Pauly about MR thermometry [Citation67] are recommended among others.
Temperature dependence of T1 relaxation time of water protons: background and application in LITT
As is well known, after the transmission and the successive interruption of a radio frequency signal to the medium, proton spin reacquires the initial position and direction. Two temporal parameters, i.e. spin-lattice relaxation time T1 and the transversal relaxation time T2, quantify the mechanisms of relaxation of the spin proton to recover the equilibrium status, and give information about the structure of the tissue. T2 relaxation time is less attractive than T1 because its temperature dependence is reduced in respect to T1 [Citation12] and can be masked by other factors [Citation69]. Therefore, we report in detail only the description of T1-based MRI thermometry.
Spin-lattice relaxation in biological tissues results from dipolar interactions of macromolecules and water molecules, which is due to their translational and rotational motion. The temperature dependence of this motion causes changes to T1, which increases with temperature. The relationship between T1 of water protons and temperature is described by Equation 9 [Citation64].
where Ea(T1) is the activation energy of the relaxation process, k is the Boltzmann constant and T is the absolute temperature. Within a certain temperature range of interest for hyperthermia purposes (i.e. 30–70 °C), the relationship between T1 and temperature can be considered mostly linear.
The quality of T1-based thermal mapping depends on the accuracy in measuring T1. Lipid suppression should be used because the presence of lipids, which have a different T1 change with temperature, is a potential source of artefacts. Non-linear effects can occur if the tissue properties change, e.g. due to coagulation. Furthermore, since the T1 change due to temperature depends on the tissue type (e.g. 1–2% °C−1 in liver, 1.4% °C−1 in bovine muscle, and 0.97% °C−1 in fat), the previous knowledge of the thermal coefficient of each tissue is essential. Because of these issues, T1 changes are often used to get a qualitative measurement of the temperature distribution [Citation67]. Nevertheless, the above described technique is easily implemented, exhibits high sensitivity to low field strength and low sensitivity to motion.
A deep analysis of T1-weighted images, compared with the technique of PRF shift, described in the following, is under investigation by Vogl et al. [Citation70,Citation71], who performed MR-guided LITT on liver metastasis, and on liver-mimicking acrylamide gel phantom.
Temperature dependence of PRF shift of water proton: background and application in LITT
The temperature sensitivity of the PRF was first assessed by Hindman in 1966 [Citation72], and only about 30 years later this approach was further examined by Ishihara et al. [Citation73] for hyperthermia purposes.
The chemical shift is the resonance frequency shift of a nucleus, with respect to a reference element. The resonance frequency of a nucleus in a molecule depends on the external magnetic field B0 and the shielding constant which, in turn, depends on the chemical environment. The hydrogen nuclei in water molecules are shielded from the external field by the electrons of the molecule. This phenomenon can be expressed as Equation 10.
where ω is the resonance frequency of the nucleus, Bloc is the magnetic flux density at the nucleus, B0 is the external magnetic flux density, s is the shielding coefficient, and γ is the gyromagnetic ratio of hydrogen.
A hydrogen nucleus in a free water molecule is shielded more efficiently by the electron cloud than a nucleus in a water molecule, which forms hydrogen bonds with neighbouring molecules. The formation of hydrogen bonds distorts the electronic configuration of the molecule and reduces the electronic shielding. Temperature influences the hydrogen bonds in water and, as a consequence, also the electronic shielding. A schematic of the above-described phenomena is shown in :
Figure 3. Schematic of the phenomena explaining the sensitivity of electronic shielding s with tissue temperature.
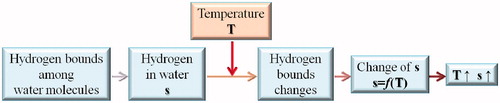
The electronic shielding, s, increases linearly with water temperature in the range of interest for hyperthermia. Temperature sensitivity of electronic shielding is constant over the temperature range from −15 °C to 100 °C, and equals to about −0.01 ppm °C−1.
The temperature dependence of PRF brought two different techniques, spectroscopy imaging [Citation73] and phase shift mapping [Citation74,Citation75]. In the first case, the temperature variation causes a shift of the resonance frequency, measurable as difference of peaks on the water spectrum; it has the advantage to not require other tools for temperature estimation, although its use is limited by the low spatial and temporal resolution. Accordingly, the second and widely used approach, the change of temperature (ΔT) is related to the phase of image by Equation 11.
where α1 [ppm °C−1] is the PRF change coefficient, TE is the echo time of the gradient echo pulse sequence and φbase is the initial phase of the image, at reference temperature.
Olsrud et al. [Citation74] evaluated the accuracy of the phase shift imaging of PRF by performing several trials on phantoms and ex vivo porcine liver, with a 1.5 T MRI scanner, confirming that the relationship between ΔT and PRF is linear for agarose phantom and water (the temperature dependence of PRF values is about −0.0085 ppm °C−1, in the temperature range from 25 °C to 75 °C), while it deviates from linearity in the case of pig liver because of the non-homogenous medium. In vivo experiments on animal models undergoing LITT have been carried out, among others, by Peters et al. [Citation76] and Puccini et al. [Citation39]. In the first study, canine prostate was laser irradiated, and MR thermometry based on PRF shift was performed. The reference temperature was measured by fluoroptic probes; authors found a spatially independent thermal coefficient of −0.0104 ppm °C−1, and demonstrated the influence of orientation of laser applicator with respect to the direction of B0 on thermal images. The second research presents the comparison of the measurements performed by fluoroptic sensors with PRF shift thermometry on bovine and porcine laser ablated liver. The main difference of MR thermometry data with respect to fluoroptic measurements was 2.5 °C.
Certainly, PRF shift is now considered the most promising technique in the field of MR thermometry because of the tissue type independence of PRF shift for aqueous tissues, the linear dependence between electronic shielding and temperature, and the higher precision in mapping temperature changes (uncertainty of 0.22 °C) with respect to other parameters [Citation77]. Nevertheless, some concerns are related to the small sensitivity to temperature change of lipid PRF shift that can cause errors of thermal mapping for fat tissue. This issue can be overcome by lipid suppression, or by the use of specific sequences. The main issue that restrains the spread of PRF in clinical application is the respiratory motion, and several techniques for its suppression are still widely discussed and under validation [Citation67,Citation75,Citation78].
The deep analysis of the MR-based methods concludes that there is no unique parameter exhibiting the highest sensitivity and efficiency in temperature monitoring. For example, T1 relaxation can be performed with low field (also less than 0.5 T), it shows a slight motion sensitivity and it is easy to be implemented, although with the drawback of being tissue-type dependent. The last issue is overcome by PRF in aqueous tissues (with the exception of lipid tissues), that shows, furthermore, a linear dependence in temperature range between −15 °C and 100 °C, high temperature sensitivity and fast acquisition.
Conclusion
The introduction of tools able to measure the tissue temperature during thermal therapies could be useful to lead the physician to adjust the optimal laser dosimetry.
In this review we wanted to give an idea concerning the most promising approaches used to monitor temperature during hyperthermia procedures; in particular, we focused on the performances of different techniques of thermometry during LITT. Several methods have been analysed and their advantages and weaknesses have been discussed; it clearly emerges that finding the optimal approach is still challenging.
Thermal sensors such as thermocouples and optical probes are widespread, although they have some drawbacks. The main issues are related to the invasiveness of measurement, which restrains their employment in in vivo trials, and puncture measurement, which limits the possibility of obtaining a complete temperature map in the tissue. Furthermore, thermocouples are not recommended to be used during hyperthermic MRI-guided treatments because they are not MRI compatible. Nevertheless, thermocouples have some advantages: they are a well-known technology, and the artefacts due to the self-heating of metallic probes are known and investigated. The issue of immunity to electromagnetic fields can be solved by optical sensors such as FBGs and fluoroptic probes. Fluoroptic probes are prone to artefacts, in particular close to the laser applicator (less than 4 mm); FBGs show other advantages, such as small size, allowing temperature measurements to be performed with high spatial resolution. This feature is crucial, since the spatial temperature gradient is high in laser irradiated tissue (it can exceed 50 °C mm−1 in the proximity of the applicator tip); on the other hand their sensitivity to strain can cause artefacts due to patient respiration, and they require expensive analysing tools.
The issues of invasiveness and material compatibility with particular environments where the procedures of LITT should be performed are overcome by the techniques of image-based thermometry. Moreover, these approaches perform volumetric estimation of thermal distribution within treated districts. In particular, CT-based, MRI-based and ultrasound-based thermometry appear to be promising non-invasive methods, particularly for in vivo measurements. Image-based thermometry is commonly affected by measurement errors caused by patient motion during in vivo applications; this issue is under investigation in several studies, and solutions to suppress these artefacts are being implemented. The main, crucial aspect related to in vivo CT-based thermometry could be regarded as the radiation dose. On the other hand, although still not widespread in LITT applications, ultrasound-based imaging has the main advantage of employing non-ionising radiation, as well as the affordability with respect to MRI. Despite the high cost, in MR-based thermometry several MR parameters are temperature dependent. Great effort should be dedicated to choosing the optimal parameter to monitor, depending on the nature of the tissue, the presence of motion, and the field value of the MR system. MR thermometry allows the monitoring of LITT effects with quite a short temporal resolution (less than 5 s). In image-based thermometry the spatial resolution is limited by the size of pixels, the signal-to-noise ratio and by the type of tissue, because the estimation of temperature is related to the temperature sensitivity of the properties of the tissue involved. An exception could be made for PRF shift, which is mostly tissue-type independent (about −0.01 ppm °C−1 for aqueous tissues).
Definitively, the methods of temperature monitoring during LITT presented in this review show several features which could be promising in this field. However, the chance of visualising the procedure in real time [Citation79] and contemporarily estimating the temperature distribution within the treated organ obtained by image-based thermometry is quite desirable.
Declaration of interest
The authors report no conflicts of interest. The authors alone are responsible for the content and writing of the paper.
References
- Huang-Wen H, Chihng-Tsung L. Review: Therapeutical applications of heat in cancer therapy. J Med Bio Eng 2011;32:1–11
- Müller G, Roggan A. Laser-Induced Interstitial Thermotherapy. Washington, DC: SPIE Optical Engineering Press, 1995
- Saccomandi P, Schena E, Di Matteo FM, Pandolfi M, Martino M, Rea R, et al. Laser interstitial thermotherapy for pancreatic tumor ablation: Theoretical model and experimental validation. Conf Proc IEEE Eng Med Biol Soc 2011;5585–8
- Di Matteo F, Martino M, Rea R, Pandolfi M, Rabitti C, Masselli GMP, et al. EUS-guided Nd:YAG laser ablation of normal pancreatic tissue: A pilot study in a pig model. Gastrointest Endosc 2010;72:358–63
- Bowman RR. A probe for measuring temperature in radio-frequency-heated material. IEEE Trans Microw Theory 1976;24:43–5
- Christensen DA. Thermal dosimetry and temperature measurements. Cancer Res 1979;39:2325–7
- Cetas TC, Connor WG. Thermometry considerations in localized hyperthermia. Med Phys 1978;5:79–91
- Cetas TC, Connor WG, Manning MR. Monitoring of tissue temperature during hyperthermia therapy. Ann NY Acad Sci 1980;335:281–97
- Cain CP, Welch AJ. Thin-film temperature sensors for biological measurements. IEEE Trans Biomed Eng 1974;21:421–3
- Christensen DA. A new nonperturbing temperature probe using semiconductor band edge shift. J Bioeng 1977;1:541–5
- Nasoni RL, Bowen T, Connor WG, Sholes RR. In vivo temperature dependence of ultrasound speed in tissue and its application to noninvasive temperature monitoring. Ultrason Imag 1979;1:34–43
- Parker DL. Applications of NMR imaging in hyperthermia: An evaluation of the potential for localized tissue heating and noninvasive temperature monitoring. IEEE Trans Biomed Eng 1984;31:161–7
- Fallone BG, Moran PR, EB Podgorsak. Noninvasive thermometry with a clinical X-ray CT scanner. Med Phys 1982;9:715–21
- Manns F, Milne PJ, Gonzales-Cirre X, Denham DB, Parel JM, Robinson DS. In situ temperature measurements with thermocouple probes during laser interstitial thermotherapy (LITT): Quantification and correction of a measurement artifact. Laser Surg Med 1998;23:94–103
- AJ Welch. Measurement and prediction of thermal injury in the retina of the rhesus monkey. IEEE Trans Biomed Eng 1984;31:633–44
- Verdaasdonk RM, Holstege FC, Jansen D, Borst C. Temperature along the surface of modified fiber tips for Nd:YAG laser angioplasty. Laser Surg Med 1991;11:213–22
- Germer CT, Albrecht D, Roggan A, Isbert C, Buhr HJ. Experimental study of laparoscopic laser-induced thermotherapy for liver tumours. Brit J Surg 1997;84:317–20
- Muschter R, Whitfield H. Interstitial laser therapy of benign prostatic hyperplasia. Eur Urol 1999;35:147–54
- Anvari B, Motamedi M, Torres JH, Rastegar S, Orihuela E. Effects of surface irrigation on the thermal response of tissue during laser irradiation. Laser Surg Med 1994;14:386–95
- Robinson DS, Parel JM, Denham DB, Gonzales-Cirre X, Manns F, Milne PJ, et al. Interstitial laser hyperthermia model development for minimally invasive therapy of breast carcinoma. J Am Coll Surg 1998;186:284–92
- Salas N, Manns F, Milne PJ, Denham DB, Minhaj AM, Parel JM, et al. Thermal analysis of laser interstitial thermotherapy in ex vivo fibro-fatty tissue using exponential functions. Phys Med Biol 2004;49:1609–24
- Milne PJ, Parel JM, Manns F, Denham DB, Gonzalez-Cirre X, Robinson DS. Development of stereotactically guided laser interstitial thermotherapy of breast cancer: In situ measurement and analysis of the temperature field in ex vivo and in vivo adipose tissue. Laser Surg Med 2000;26:67–75
- Reid AD, Gertner MR, Sherar MD. Temperature measurement artefacts of thermocouples and fluoroptic probes during laser irradiation at 810 nm. Phys Med Biol 2001;46:N149–57
- Van Nimwegen SA, L’Eplattenier HF, Rem AI, van der Lugt JJ, Kirpensteijn J. Nd:YAG surgical effects in canine prostate tissue: Temperature and damage distribution. Phys Med Biol 2009;54:29–44
- Rao YJ. In-fiber Bragg grating sensors. Meas Sci Technol 1997;8:355–75
- Kersey AD, Michael AD, Heather JP, LeBlanc M, Koo KP, Askins CG, et al. Fiber grating sensors. J Lightwave Technol 1997;15:1442–63
- Mishra V, Singh N, Tiwari U, Kapur P. Fiber grating sensors in medicine: Current and emerging applications. Sens Actuators A Phys 2011;167:279–90
- Silvestri S, Schena E. Optical-fiber measurement systems for medical applications. In: Predeep P, editors. Optoelectronics: Devices and Applications. Rijeka, Croatia: InTech, 2011, pp. 205–24
- Rao YJ. Recent progress in applications of in-fibre Bragg grating sensors. Opt Laser Eng 1999;31:297–324
- Rao YJ, Hurle B, Webb DJ, Jackson DA, Zhang L, Bennion I. In-situ temperature monitoring in NMR machines with a prototype in-fibre Bragg grating sensor system. Conf Proc OSA Optical Fibre Sensors 1997;646–9
- Rao YJ, Webb DJ, Jackson DA, Zhang L, Bennion I. Optical in-fibre Bragg grating sensor system for medical applications. J Biomed Opt 1998;31:38–44
- Webb DJ, Hathaway MW, Jackson DA, Jones S, Zhang L, Bennion I. First in vivo trials of a fiber Bragg grating based temperature profiling system. J Biomed Opt 2000;5:45–50
- Samset E, Mala T, Ellingsen R, Gladhaug I, Søreide O, Fosse E. Temperature measurement in soft tissue using a distributed fiber Bragg grating sensor system. Minim Invasiv Ther 2001;10:89–93
- Gowardhan B, Greene D. Cryotherapy for the prostate: An in vitro and clinical study of two new developments; Advanced cryoneedles and a temperature monitoring system. BJU Int 2007;100:295–302
- Saccomandi P, Schena E, Caponero MA, Di Matteo FM, Martino M, Pandolfi M, et al. Theoretical analysis and experimental evaluation of laser induced interstitial thermotherapy in ex vivo porcine pancreas. IEEE Trans Biomed Eng 2012;59:2958–64
- Wickersheim KA, Sun MH. Fiberoptic thermometry and its applications. J Microwave Power 1987;22:85–94
- Grattan KTV, Zhang ZY. Introduction. In: Grattan KTV, Zhang ZY, editors. Fiber Optic Fluorescence Thermometry. New York, NY: Springer, 1995, pp. 1–34
- Hübner F, Bazrafshan B, Roland J, Kickhefel A, Vogl TJ. The influence of Nd:YAG laser irradiation on Fluoroptic® temperature measurement: An experimental evaluation. Laser Med Sci 2013;28:487–96
- Puccini S, Bär NK, Bublat M, Kahn T, Busse H. Simulation of thermal tissue coagulation and their value for the planning and monitoring of laser-induced interstitial thermotherapy (LITT). Magnet Reson Med 2003;49:351–62
- Davidson SRH, Vitkin IA, Sherar MD, Whelan WM. Characterization of measurement artefacts in fluoroptic temperature sensors: Implications for laser thermal therapy at 810 nm. Laser Surg Med 2005;36:297–306
- Bruners P, Pandeya GD, Levit E, Roesch E, Penzkofer T, Isfort P, et al. CT-based temperature monitoring during hepatic RF ablation: Feasibility in an animal model. Int J Hyperther 2012;28:55–61
- Bydder GM, Kreel L. The temperature dependence of computed tomography attenuation values. J Comput Assist Tomogr 1979;3:506–10
- Cetas TC. Will thermometric tomography become practical for hyperthermia treatment monitoring? Cancer Res 1984;44:S4805–8
- Mahnken AH, Bruners P. CT thermometry: Will it ever become ready for use? Int J Clin Pract 2011;65S171:1–2
- Homolka P, Gahleitner A, Nowotny R. Temperature dependence of HU values for various water equivalent phantom materials. Phys Med Biol 2002;47:2917–23
- Jenne JW, Bahner M, Spoo J, Huber P, Rastert R, Simiantonakis I, et al. CT online monitoring of HIFU therapy. Ultrason 1997;1997:1377–80
- Pandeya GD, Greuter MJW, Schmidt B, Flohr T, Oudkerk M. Assessment of thermal sensitivity of CT during heating of liver: An ex vivo study. Brit J Radiol 2012;85:e661–5
- Pandeya GD, Ganga D, Greuter MJW, De Jong KP, Schmidt B, Flohr T, et al. Feasibility of noninvasive temperature assessment during radiofrequency liver ablation on computed tomography. J Comput Assist Tomogr 2011;35:356–60
- Pandeya GD, Klaessens JHGM, Greuter MJW, Schmidt B, Flohr T, Van Hillegersberg R, et al. Feasibility of computed tomography based thermometry during interstitial laser heating in bovine liver. Eur Radiol 2011;21:1733–8
- Bruners P, Levit E, Penzkofer T, Isfort P, Ocklenburg C, Schmidt B, et al. Multi-slice computed tomography: A tool for non-invasive temperature measurement? Int J Hyperthermia 2010;26:359–65
- Frich L. Non-invasive thermometry for monitoring hepatic radiofrequency ablation. Minim Invasiv Ther Allied Technol 2006;15:18–25
- Schena E, Saccomandi P, Giurazza F, Caponero MA, Mortato L, Di Matteo FM, et al. Experimental assessment of CT-based thermometry during laser ablation of porcine pancreas. Phys Med Biol 2013;58:5705--16
- Bowen T, Connor WG, Nasoni RL, Pifer AE, Sholes RR. Measurement of the temperature dependence of the velocity of ultrasound in soft tissue. In: Linzer M, ed. Ultrasonic Tissue Characterization II. Washington, DC: National Bureau of Standards, 1979, pp. 57–61
- van Dongen KW, Verweij MD. A feasibility study for non-invasive thermometry using non-linear ultrasound. Int J Hyperthermia 2011;27:612–24
- Hoskins P, Martin K, Thrush A. Diagnostic Ultrasound: Physics and Equipment, 2nd ed. New York: Cambridge University Press, 2010
- Pearce J, Valvano JW, Emelianov S. Temperature measurement. In: Welch AJ, van Gemert AJC, editors. Optical Thermal Response of Laser Irradiated Tissue. New York, NY: Springer, 2011, pp. 434–44
- Techavipoo U, Varghese T, Chen Q, Stiles TA, Zagzebski JA, Frank G. Temperature dependence of ultrasonic propagation speed and attenuation in excised canine liver tissue measured using transmitted and reflected pulses. J Acoust Soc Am 2004;115:2859–65
- Ueno S, Hashimoto M, Fukukita H, Yano T. Ultrasound thermometry in hyperthermia. Proc IEEE Ultrason Symp 1990;1990:1645–52
- Haney MJ, O’Brien WD Jr. Ultrasonic tomography for differential thermography. Acoust Imag 1982;12:589–97
- Varghese T, Zagzebski JA, Chen Q, Techavipoo U, Frank G, Johnson C, et al. Ultrasound monitoring of temperature change during radiofrequency ablation: Preliminary in-vivo results. Ultrasound Med Biol 2002;28:321–9
- Shah J, Aglyamov SR, Sokolov K, Milner TE, Emelianov SY. Ultrasound imaging to monitor photothermal therapy – Feasibility study. Opt Express 2008;16:3776–85
- Lemor RM, Kleffner BV, Tretbar S, Schmitt RM. Ultrasound temperature and attenuation monitoring for controlling the laser induced thermo therapy. Acoust Imag 2002;25:395–400
- Bloembergen N, Purcell EM, Pound RV. Relaxation effects in nuclear magnetic resonance absorption. Phys Rev 1948;73:679–712
- Parker DL, Smith V, Sheldon P, Crooks LE, Fussell L. Temperature distribution measurements in two-dimensional NMR imaging. Med Phys 1983;10:321–5
- Jolesz FA, Bleier AR, Jakab P, Ruenzel PW, Huttl K, Jako GJ. MR imaging of laser-tissue interactions. Radiology 1988;168:249–53
- McDannold N. Quantitative MRI-based temperature mapping based on the proton resonant frequency shift: Review of validation studies. Int J Hyperthermia 2005;21:533–46
- Rieke V, Pauly KB. MR thermometry. J Magn Reson Imaging 2008;27:376–90
- Plewes DB, Kucharczyk W. Physics of MRI: A primer. J Magn Reson Imaging 2012;35:1038–54
- Graham SJ, Bronskill MJ, Henkelman RM. Time and temperature dependence of MR parameters during thermal coagulation of ex vivo rabbit muscle. Magn Reson Med 1998;39:198–203
- Vogl TJ, Straub R, Zangos S, Mack MG, Eichler K. MR-guided laser-induced thermotherapy (LITT) of liver tumours: Experimental and clinical data. Int J Hyperthermia 2004;20:713–24
- Bazrafshan B, Hübner F, Farshid P, Hammerstingl R, Paul J, Vogel V, et al. Temperature imaging of laser-induced thermotherapy (LITT) by MRI: Evaluation of different sequences in phantom. Lasers Med Sci 1984;31:161–7
- Hindman JC. Proton resonance shift of water in gas and liquid states. J Chem Phys 1966;44:4582–92
- Ishihara Y, Calderon A, Watanabe H, Ishihara Y, Calderon A, Watanabe H, et al. A precise and fast temperature mapping using water proton chemical shift. Magn Reson Med 1995;34:814–23
- Olsrud J, Wirestam R, Brockstedt S, Nilsson AM, Tranberg KG, Ståhlberg F, et al. MRI thermometry in phantoms by use of the proton resonance frequency shift method: Application to interstitial laser thermotherapy. Phys Med Bio 1998;43:2597–613
- Rieke V, Vigen KK, Sommer G, Daniel BL, Pauly JM, Butts K. Referenceless PRF shift thermometry. Magn Reson Med 2004;51:1223–31
- Peters RD, Chan E, Trachtenberg J, Jothy S, Kapusta L, Kucharczyk W, et al. Magnetic resonance thermometry for predicting thermal damage: An application of interstitial laser coagulation in an in vivo canine prostate model. Magn Reson Med 2000;44:873–83
- Wlodarczyk W, Hentschel M, Wust P, Noeske R, Hosten N, Rinneberg H, et al. Comparison of four magnetic resonance methods for mapping small temperature changes. Phys Med Biol 1999;44:607–24
- Kickhefel A, Rosenberg C, Roland J, Viallon M, Gross P, Schick F, et al. A pilot study for clinical feasibility of the near-harmonic 2D referenceless PRFS thermometry in liver under free breathing using MR-guided LITT ablation data. Int J Hyperthermia 2012;28:250–66
- Feng Y, Fuentes D. Model-based planning and real-time predictive control for laser induced thermal therapy. Int J Hyperthermia 2011;27:751–61