Abstract
Objectives: The objective of this study was to develop and test computer algorithms to export micro computed tomography (microCT) images and to generate tumour geometry and specific absorption rate (SAR) distribution for heat transfer simulation in magnetic nanoparticle hyperthermia. Methods: Computer algorithms were written to analyse and export microCT images of 3D tumours containing magnetic nanoparticles. MATLAB® and ProE® programs were used to generate a prototype of the tumour geometry. The enhancements in the microCT pixel index number due to presence of nanoparticles in the tumours were first converted into corresponding SAR values. The SAR data were then averaged over three-dimensional clusters of pixels using the SAS® program. This greatly decreased the size of the SAR file, while in the meantime it ensured that the amount of total energy deposited in the tumour was conserved. Both the tumour geometry and the SAR file were then imported into the COMSOL® software package to simulate temperature elevations in the tumour and their surrounding tissue region during magnetic nanoparticle hyperthermia. Results: A linear relationship was obtained to relate individual pixel index numbers in the microCT images to the SAR values under a specific magnetic field. The generated prototype of the tumour geometry based on only 30 slices of microCT images resembled the original tumour shape and size. The tumour geometry and the simplified SAR data set were successfully accepted by the COMSOL software for heat transfer simulation. Up to 20 °C temperature elevations from its baseline temperature were found inside the tumours, implying possible thermal damage to the tumour during magnetic nanoparticle hyperthermia.
Introduction
To overcome limitations of traditional hyperthermia methods, magnetic nanoparticle hyperthermia has emerged in recent years as a promising heating method, due to its ability to confine adequate thermal energy in tumours. This approach uses iron-based magnetic nanoparticles (∼10 nm diameter) to generate heat when subjected to an alternating magnetic field [Citation1–13]. Previous investigations in magnetic nanoparticle hyperthermia for cancer treatments have demonstrated that particle size, particle coating, and magnetic field strength and frequency determine its heat generation capacity. However, once the nanoparticles are manufactured, the spatial distribution of the nanoparticles deposited in tissue dominates the spatial temperature elevation during heating [Citation14–15]. Therefore, understanding the distribution of magnetic nanoparticles in tumours is critical to developing theoretical models to predict the temperature distribution in tumours during hyperthermia treatment. An accurate description of the nanoparticle distribution and the tumour geometry will greatly enhance simulation accuracy of the heat transfer process in tumours, crucial for designing an optimal treatment protocol that can prevent occurrence of heating under-dosage in the tumour and overheating in the healthy tissue [Citation6].
Unfortunately, the major unknown is the distribution of nanoparticles accumulated in tumours after systemic or intratumoral delivery. Since the accumulation is passive in a systemic delivery, it is not clear how dispersed nanoparticles are after an intravenous injection. The concentration of nanoparticles in tumours may vary from one region to another due to variations of permeability of local vasculature and blood perfusion rate. For a tumour with a poor vascular supply, delivering nanoparticles would take a long time for passive accumulation. On the other hand, in an intratumoral delivery it is expected that the nanoparticle deposition strongly depends on the injection strategy and transport properties of the porous tumours [Citation5,Citation13]. The opaque tissue prevents optical penetration into deep tissue region; therefore, it is often difficult to visualise nanoparticle deposition in tumours. All previous temperature field simulations during heating were based on simple description of nanoparticle distribution, such as a uniform [Citation16] or a Gaussian distribution [Citation5], as well as modelling tumours as homogeneous structures. Their accuracy is questionable since they all deviate significantly from actual nanoparticle deposition patterns observed in real tumours [Citation13].
Recently, a micro computed tomograph (microCT) imaging technique was proposed as a non-invasive, non-destructive method for investigating nanoparticle distribution in tumours. Although microCT (∼µm) does not allow direct visualisation of individual nanoparticles (∼nm), the accumulation of nanoparticles in tissue would result in a region with a much higher density than the rest of the tissue and the density variations can be detected by a microCT system [Citation13,Citation17]. Previous studies by our group have illustrated the feasibility of imaging and quantifying detailed 3D nanoparticle distribution in both gels and tumours [Citation13,Citation17]. From the obtained high-resolution microCT images, it was evident that nanoparticles were not always confined in a spherical region near the injection site and they migrated inhomogeneously to the periphery region of the tumour. Nanoparticle deposition patterns were not well controlled from one tumour to another. It was demonstrated that a fast infusion of ferrofluid (>10 µL/min) to the tumours often resulted in uncontrollable nanoparticle deposition patterns [Citation13]. The irregular shape of the nanoparticle deposition pattern cannot be explained by the traditional porous medium theory with constant transport properties. Another challenge encountered was how to achieve repeatable and controllable nanoparticle distribution, leading to reliable optimal designs of safe and effective heating protocols. The observation that the nanoparticle spreading patterns varied from one tumour to another suggests variations of tumour inner porous structures in the studied group. It is also possible that the high infusion pressure may have generated additional micro-cracks in the tumour during the infusion, especially when the infusion rate was high.
Previous attempts by our group have been conducted to directly import the microCT image files into numerical simulation software packages such as COMSOL® (Stockholm, Sweden). Those attempts failed due to intensive memory requirements to directly import the microCT images. Although commercial software packages exist to handle detailed entities inside tumours, they are very expensive to purchase. In addition, having very small entities at the micrometre level inside the tumour geometry may impose challenges to a numerical simulation software to accept the generated geometry and cause singularities during meshing in finite element simulation.
The objective of this study was to develop and test computer algorithms to export microCT images and to generate tumour geometry and specific absorption rate (SAR) distribution for heat transfer simulation in magnetic nanoparticle hyperthermia. The algorithms simplified the vast data obtained from microCT scans to develop a 3D tumour model containing a realistic SAR distribution due to presence of magnetic nanoparticles. The generated 3D tumour model was expected to resemble the actual 3D tumour geometry in microCT scans. The variations in density (greyscale values of individual pixels) in the microCT images were converted into the SAR values based on calibrations under a specific magnetic field. The tumour geometry and the SAR file were then tested whether they are acceptable by the COMSOL software package for heat transfer simulations.
Methods
MicroCT scan of PC3 tumours
The microCT images of three tumours were collected from previous animal experiments performed by our group [Citation13]. Specifically, the tumours used in the previous study were PC3 prostatic tumours implanted into the flanks of BALB/c Nu/Nu male mice. The mice were purchased from the National Cancer Institute. Each mouse was inoculated in both flanks with 107 PC3 human prostate cancer cells via a sterile 26-gauge needle injection at the University of Maryland, Baltimore (UMB). Once the tumours reached a diameter of at least 10 mm, the mouse was brought to the Bioheat Transfer Laboratory at University of Maryland Baltimore County (UMBC) for the nanoparticle hyperthermia experiment. The mouse was anaesthetised with sodium pentobarbital solution (40 mg/kg, intraperitoneally (i.p.)), and placed on a water-jacketed heating pad to maintain a normal body core temperature monitored by a thermocouple inserted into the rectum. Water-based ferrofluids (EMG700 series, Ferrotec, Nashua, NH) with a concentration of 5.8% by volume and a particle size of 10 nm were loaded in a syringe pump (Genie Plus, Kent Scientific, Torrington, CT) to control the flow rate (5 µL/min) and the amount of the injection (0.1 cc). A 26-gauge Hamilton needle (Fischer Scientific, Springfield, NJ) was used for injecting the ferrofluid into one of the tumours. Based on the density of magnetite (5240 kg/m3) and the given ferrofluid concentration, each 0.1 cc of ferrofluid contains approximately 25.2 mg of iron.
After the experiments, the mouse was euthanised via sodium pentobarbital overdose (160 mg/kg, i.p.), and the tumour was resected and scanned in a microCT imaging system (Skyscan®1172, Micro Photonics, Inc., Allentown, PA). The tumour was placed in a low-density Styrofoam container, and mounted on the platform of the imaging system with the help of a stage holder. A medium resolution scan of 17 µm (pixel size) was selected at 100 kV and 100 µA without a filter. The total CT scan time was typically less than 20 min. The images acquired from the microCT scan were then reconstructed using the NRecon® software package provided by Micro Photonics. Scan parameters and reconstruction parameters were kept the same for all the scanned tumours in the study. The reconstructed images were analysed using the CTan® software package (SkyScan, Aartselaar, Belgium). The total region of interest (ROI) was selected by interpolating the local ROI (ROI of individual slice) throughout the selected tissue region. This procedure helped accurately estimate the tumour boundaries and its volume and also reduced the total amount of data. In the scanned images and reconstructed image, the brightness is represented by the pixel index numbers between 0 and 255. A typical microCT scan of a tumour may result in a total of 523 individual images with an image size of 1052 × 1944 pixels. The pixel index number for the tumour tissue ranged from 45 to 55, based on scanning results of tumours without ferrofluid injections. Therefore, a region with a pixel index number between 55 and 255 was considered as pixel locations with density enhancement due to presence of nanoparticles [Citation13].
Determination of the Relationship between the Pixel Index Number and SAR
It was evident that the nanoparticle concentration was not uniform in tumours after intratumoral injections, therefore it was difficult to identify a tumour region containing nanoparticles with a uniform and known concentration. Although mixing the ferrofluid with agarose powder to form a gel specimen may allow precise calculations of its nanoparticle concentration, it has been demonstrated from our previous experiments that the gel specimen cannot completely mimic real tumour tissue in terms of its x-ray absorption properties [Citation18].
In this study, we assumed that the SAR value was proportional to the nanoparticle concentration, and a linear relationship existed between the nanoparticle concentration and the microCT pixel index number [Citation18]. Our microCT study has shown that the microCT pixel index number was below 55 when the nanoparticle concentration in the tumours was zero. To generate a linear relationship, a pixel index number associated with a known nanoparticle concentration needed to be determined. In this study, a water-based ferrofluid (EMG700 series) with a concentration of 5.8% by volume and a particle size of 10 nm was placed inside our microCT system to determine its average pixel index number under the same X-ray settings. After the microCT scan, the ferrofluid was placed inside an alternating magnetic field induced by a two-turn coil with a current of 200 A at a frequency of 190 kHz [Citation13], and the initial temperature elevations in the ferrofluid were recorded to determine the SAR value based on Equation 1.
where ρ is density of the ferrofluid (1290 kg/m3), c is the specific heat of the ferrofluid (4100 J/kg·K), and the partial derivative represents the initial (t = 0) temperature elevation rate. This method was based on the assumption of negligible heat conduction in the specimen before heating occurs. With the measured SAR value and its pixel index number in the microCT scan for a known nanoparticle concentration of 5.8%, any pixel index number in a microCT image can be converted into a SAR value, representing the nanoparticle-induced volumetric heat generation rate (W/m3) subject to the same alternating magnetic field.
Generation of the tumour geometry and SAR file
Due to the limitation of the computer memory, the 3D tumour model was generated based on 13–30 slices of the original microCT images. MATLAB® (Natick, MA) codes were written to identify the tumour boundary in each image, to smooth the boundary line, and to convert greyscale values inside the tumour boundary as uniform. The Pro Engineer software (PTC Inc., Needham, MA) was then used to stack all the modified slices together to generate a ‘prototype’ of the 3D tumour with uniform properties inside. In theory, the more slices used, the more the ‘prototype’ should look like the 3D tumour visualised in the microCT system.
From our preliminary study, we found that a typical microCT image on a cross-section of a tumour had a resolution of 1026 pixels per cm, and the file size was at least 75 MB per cross-sectional image. Depending on the microCT scan settings, there could be approximately 500 cross-sectional images for each tumour. Such a high resolution was unnecessary because meshes generated for numerical simulation of heat transfer have a much lower density of elements. Also, the size of the SAR data would have exceeded the capability of the COMSOL software to handle the data input.
In this study, the pixel index numbers of individual microCT images were converted first to the SAR values at individual pixel locations, using the linear relationship described in the previous section. To reduce the size of the SAR file, we averaged the SAR values over a three-dimensional cluster of pixels. This greatly decreased the size of the SAR file, while in the meantime it ensured that the amount of the total energy deposited in the tumour was not affected by the averaging procedures. The cluster size could be adjusted to yield a reasonable size of a SAR file without sacrificing the accuracy of the numerical simulation. The vast SAR data were processed to generate a single file that gave the SAR values in the form of a 3D matrix using the software SAS® (SAS Institute, Cary, NC), which is widely employed for data analysis and statistics. In the current study we used a cluster having a volume of 1.76 × 10⁻³ mm3 (7 pixels by 7 pixels by 7 pixels).
Simulation of temperature elevations in tumours
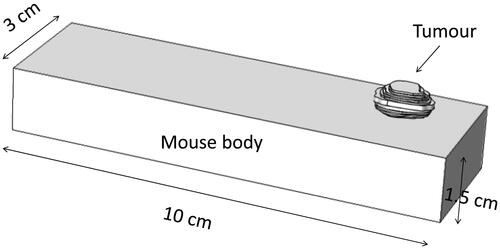
shows the geometry of a tumour attached to a mouse body, represented by a rectangular column. The rectangular column mimics the geometric dimensions of a realistic mouse body. The Pennes bioheat equation is used to simulate the steady state temperature field inside the mouse body and the tumour, and is written as in Equation 2.
where k is thermal conductivity, ρ is density, c is specific heat, and qm is metabolic heat generation rate. The nanoparticle-induced volumetric heat generation rate (SAR) was only applied to the tumour region. The tumour surface and the mouse body were subject to a natural convection boundary condition (T∞ = 25 °C, h = 3.7 W/m2 K) except on the bottom surface of the mouse body. A heating pad was typically used in our experiments to maintain a normal mouse body temperature during anaesthesia; therefore, the boundary condition of the mouse bottom surface was a prescribed temperature of 37 °C.
Figure 1. Simulation domain in the COMSOL software, including a mouse body and an implanted tumour.
The tumour geometry and mouse body were imported into the COMSOL software for numerical simulation of temperature elevations during magnetic nanoparticle hyperthermia. The differential equations were solved using the finite element solver of COMSOL Multiphysics 4.3. The mesh was finer inside the tumour with a growth factor of 1.1 starting from the tumour boundary towards the normal tissue. The total number of the tetrahedral elements using the fine mesh setting was 146 062. The mesh sensitivity was checked via increasing the mesh setting to extremely fine meshing with an increase in the total number of elements to 644 035. The four-fold increase in the mesh elements resulted in a difference of less than 0.1 °C in the resultant temperature field in the tumours.
Results
The measured SAR value for the ferrofluid with a nanoparticle concentration of 5.8% was calculated as 9.8 × 10⁵ W/m3 when the specimen was subject to the magnetic field induced by the two-turn coil. After the microCT scan of the specimen of ferrofluid, the average pixel index number was 123 under the same X-ray power settings. Therefore, Equation 3 was obtained to convert individual pixel index numbers to the SAR values.
For a pixel location with a pixel index number smaller than 55, the SAR value was zero. Equation 3 was used later to generate an SAR file for heat transfer simulation.
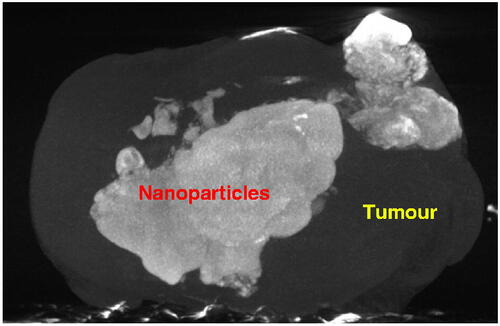
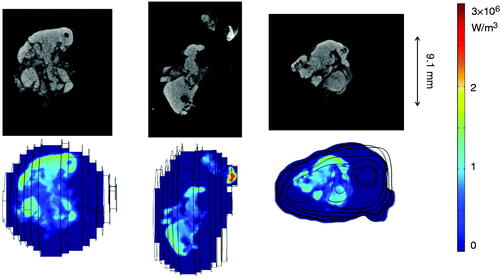
shows the 3D microCT image of a tumour. The tumour boundary is evident in the figure. The white cloud in the image represents the pixel locations where the density was significantly higher than the tumour tissue density. Since the density elevation was due to the presence of the magnetic nanoparticles, the cloud can be viewed as pixel locations with nanoparticle depositions.
Figure 2. Maximum intensity projection (MIP) of a microCT scan of a tumour.
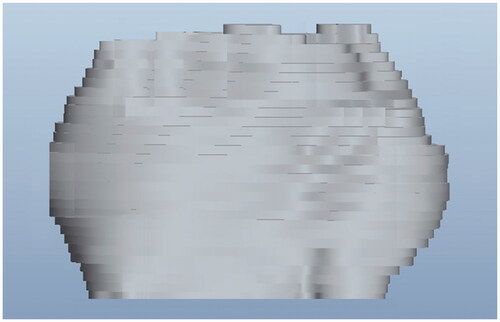
The generated 3D ‘prototypes’ of the same tumour are illustrated in and . The prototype in is constructed based on 13 slices of the microCT scan, while the one in is generated from 30 slices. The prototype with more image slices bears a stronger resemblance to the real tumour.
Figure 3. Approximation of a tumour geometry constructed in ProE® from 13 microCT slices.
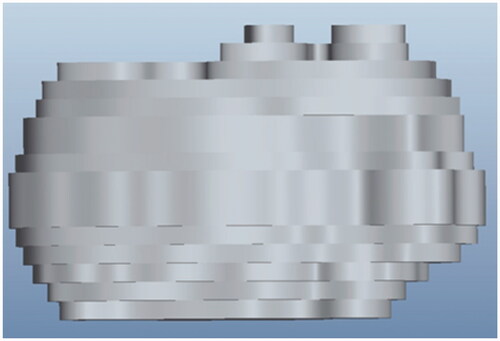
Figure 4. Prototype of the same tumour constructed in ProE® from 30 microCT slices.
The SAR distribution inside the generated tumours can be visualised using the COMSOL software. gives three representative slices of the microCT scans and their corresponding SAR distribution contours inside the COMSOL geometry of one of the tumours. The SAR distributions look very similar to the white cloud in the microCT images. The SAR values vary from 1.5 × 10⁴ to 2.9 × 10⁶ W/m3. Note that the average SAR value is similar to the order of magnitude generated by the ferrofluid before its injection into the tumour (9.8 × 10⁵ W/m3). In some tumour areas the nanoparticle concentration was larger than the ferrofluid concentration since their SAR values are higher than 9.8 × 10⁵ W/m3. The SAR contours obtained are consistent with the experimental observation that the distribution volume of the nanoparticles was smaller than the injection volume of the ferrofluid [Citation13].
Figure 5. Greyscale microCT image slices (top panels) and the SAR distribution in the COMSOL software (bottom panels).
With both the tumour geometry and the SAR file imported to the COMSOL software, a heat transfer simulation was carried out to determine the steady-state temperature field inside the tumour when the tumour was subject to the same alternating magnetic field as our previous heating experiment [Citation13]. Since the entire tumour geometry was generated as if it consisted of one single material, the same physical and physiological parameters were applied to the entire tumour. The advantage of this was to eliminate small entities inside the geometry that could cause problems during meshing. gives the thermal and physiological properties of both the tumour and mouse body, found from previous studies [Citation19,Citation20].
Table I. Physical and physiological properties of the tumour and mouse body.
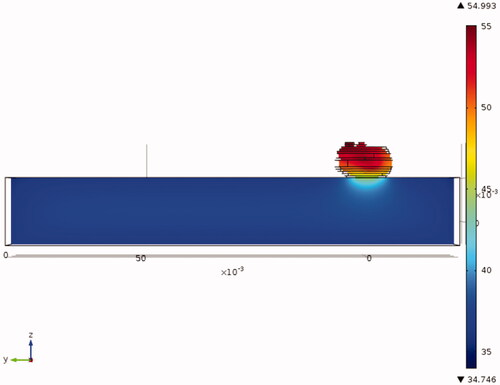
provides the temperature field in a tumour with the nanoparticle injection. The temperature field in the mouse body was relatively uniform, varying from approximately 35 °C on its boundary surfaces to 37 °C towards the centre. Most temperature elevations occurred in the tumour region due to nanoparticle-generated heating. The interface between the mouse body and the tumour illustrated significant heat removal from the hot tumour region to the warm mouse body.
Figure 6. Temperature contours in the tumour and the mouse body in the COMSOL simulations.
The comparison of the temperature fields in the three tumours with nanoparticle deposition is shown in . We found that the maximal temperature inside the tumour without nanoparticle deposition was only approximately 35 °C, due to the small size of the protruding tumour. With the heat generation by the nanoparticles subject to the magnetic field, the tumour temperatures were elevated from their baseline values. The maximal temperature occurred at a tumour region depending on the nanoparticle deposition distribution. The maximal temperatures observed for the three tumours varied from approximately 51 °C to 55 °C, a 16–20 °C increase from their baseline of 35 °C. The minimal temperature occurred at the interface between the tumour and the mouse body, varying from 41 °C to 45 °C.
Figure 7. Steady-state temperature distributions in the three tumours.
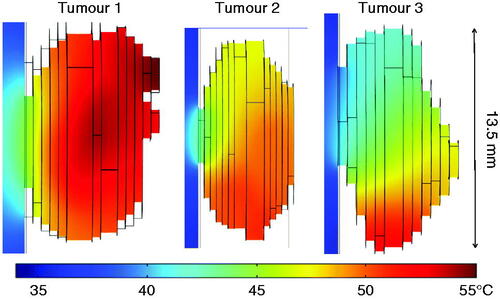
summarises the temperature elevations in the three constructed tumours from the microCT scans. The baseline temperature fields were very similar; however, the temperature elevations are quite different. The amount of the total energy deposited by the nanoparticles was also calculated, varying from 0.62 W in tumour 1 to 0.33 W in tumour 2. The maximal temperature after steady state was found to be 55 °C in tumour 1. There is a direct correlation between the achieved maximal and average temperatures and the amount of the total energy deposited into the tumours.
Table II. Energy deposition rate and temperature elevations in the three tumours.
Discussion
While hyperthermia therapies using microwave, RF, and ultrasound are commercially available and have been used in some clinical studies, magnetic nanoparticle hyperthermia is not a standard treatment for cancer patients, despite its great potential and numerous advantages. A number of challenges need to be addressed before it reaches the level of first-line clinical studies. Magnetic nanoparticle hyperthermia is limited by the lack of study of controlling the nanoparticle distribution and temperature elevations in tumours. The uncertainty of nanoparticle deposition distribution in tumours may lead to inadequacy in killing tumour cells and/or damage to healthy tissue. Survival of some cells in the tumour periphery or the necrotic core may lead to tumour recurrence or metastasis to other parts of the body, which is costly and often with poor treatment outcomes.
Although some research groups have performed both experimental studies and theoretical simulations to understand how nanoparticles spread in tumours, very little effort has been focused on how to include heterogeneous tumour structures in their investigations. Our previous study using microCT has shown that nanoparticle distribution in tumours following an intratumoral injection is highly non-uniform and the variety of nanoparticle deposition patterns suggests that the heterogeneous porosity of tumours might be a dominant factor. Therefore, it is important to take into consideration the effect of heterogeneous transport properties of real tumours on the accuracy of the heat transfer models, since it will affect induced temperature elevations and its consequent thermal damage distribution in tumours.
As illustrated by this study, accuracy of heat transfer simulations can be improved by utilising the available computational resources to import the acquired 3D microCT images of tumour geometries and detailed nanoparticle concentration distribution to commercial software packages. A heat transfer model based on image-generated tumour geometry and SAR distribution, in theory, should greatly improve model predicting power, and has the potential of leading to individualised treatment designs for various tumour sizes and types in the future. For individual tumours, the tumour temperature field and its elevation history can be simulated based on the generated SAR distribution. It has the potential to design the heating protocol before the actual heating treatment. As shown in previous studies, the optimal heating protocol can be determined based on the Arrhenius integral or the EM43, an alternative parameter derived from the Arrhenius integral [Citation21–25]. The EM43, the thermal isoeffective dose, converts the temperature levels and heating duration into an equivalent number of minutes at 43 °C to induce thermal damage to a specific tumour cell type [Citation22,Citation23]. A summary by Dewhirst et al. [Citation24]. shows a wide range of EM43 values for various tissue types, suggesting complicated biological and chemical factors that may contribute to the wide variation in estimating the threshold of thermal damage. The temperature elevation predicted in the model is the steady-state temperature field. With modification, the model can be revised to simulate the temperature transients during heating. Therefore, it has the potential to use the transient temperature elevations to evaluate thermal damage history. The total heating time in our previous experiments was 15 min. It is possible that 15 min is sufficient to induce permanent thermal damage to local tumour cells when exposed to temperatures above 55 °C. However, non-lethal thermal damage may occur at the tumour interface with the mouse body when the steady-state temperature is only 41 °C with a heating duration of 15 min. Another advantage of performing theoretical heat transfer simulations of tumours is to determine the 3D temperature field, while experimental studies only have temperatures measured at limited locations. It is believed that the theoretical simulation will identify tumour locations with minimal temperature elevations from its baseline temperatures. If the objective is to induce permanent thermal damage in the entire tumour, the simulated 3D transient temperatures can be used to design optimal heating protocols, such as identifying a minimal heating time to induce permanent thermal damage to the entire tumour. Understanding tumour locations with minimal temperature elevation can be used for future experimental studies to identify temperature monitoring sites.
The research in this study will provide experimental data for future advancement in theoretical modelling of bio-transport. With the advancement of computational and storage resources in the past decade, it has become feasible to model heat transport in tissue based on realistic organ geometry and vasculature identified via advanced imaging technology, although reasonable simplification of the vast amount of image data is still needed. Current theoretical simulation of nanoparticle transport in tumours is based on a multi-scale modelling approach [Citation26–28]. It is evident that the multi-scale modelling approach addressing interaction among individual nanoparticles, the fluid, and the tissue matrix, is an important improvement from the traditional porous medium theory. The accuracy of those models relies on the description of the porous structures of tumours. However, the unknowns in the multi-scale models are the transport properties as well as the heterogeneity of the properties. Experimental studies have demonstrated that the heterogeneous porous structure in tumours induces unpredictable nanoparticle spreading patterns observed in the tumour experiments. It is believed that the observed particle deposition patterns reflect the effects of heterogeneous tumour porous structures and infusion parameters on the nanoparticles spreading in tumours during intratumoral injection. Access to a 3D microCT imaging facility will enhance the ability to better visualise and quantify nanoparticle deposition in tumours. The current study, which bypasses theoretical simulation of nanofluid/nanoparticle spreading in heterogeneous tumours, has illustrated the effects of uncertain tumour structures on the mass transport and temperature distribution in tumours. It is envisioned that the first-hand quantitative imaging of nanoparticle spreading patterns collected can be used in the future to test assumptions and simplifications in multi-scale modelling, to extract transport properties and distribution, and to ultimately advance understanding of nanoparticle transport in tumours with heterogeneous porous structures.
This study only attempted to develop computational algorithms to ensure a smooth transfer of data from microCT images to a commercial finite element software package for heat transfer simulation. The algorithms have been tested in several sets of tumour images collected by our lab. There are several limitations in the current study. Exporting and analysing the microCT image data still require significant efforts to allow smooth connections between software packages. Despite smoothing the tumour boundary in individual images and getting rid of singularities inside via assigning the inside as a material with uniform properties, we still found that the generated tumour may not always be accepted by the COMSOL software due to difficulty in meshing. In addition, although we have scanned mouse body geometry [Citation29], we had difficulty importing the 3D mouse body and merging it with a tumour geometry with an irregular shape in the COMSOL software. Therefore, the mouse body was greatly simplified and represented by a rectangular column in this study. However, since the major heat generation occurs in the tumour, the inaccurate representation of the mouse body may not have affected the temperature elevations in the tumour. We note that COMSOL software is one of several commercially available finite element simulation software packages. We have used COMSOL software because of institutional access and readily available options of working across multiple physics simultaneously. Available interface options between COMSOL and MATLAB provide an easy way of running customised optimisation, since the COMSOL file can be converted into MATLAB codes; therefore, in-house codes can be developed for specific research applications. Some researchers have also used ANSYS® (Pittsburgh, PA) to perform 3D bioheat simulations and found that ANSYS is equally good in handling imaging processing [Citation30,Citation31]. Depending on the image processing capabilities, in the future, appropriate commercial software will be tested when they are available.
Another limitation of this study was to use the ferrofluid solution to calibrate the linear relationship between the SAR value and the microCT pixel index number, since the composition of the ferrofluid may be different from the actual tumour tissue, although 80% of tissue is water. An idealised situation was to use a specimen of real tumour having a uniform and known nanoparticle concentration. Unfortunately, it turned out to be very difficult to obtain such a sample. Our study was only the first step to ensure a smooth transfer of a large amount of microCT imaging data to a commercial heat transfer simulation software package with reasonable accuracy. Future studies are warranted to continue to improve the calibration process.
It is important to validate any theoretical simulation via experimental measurements. Our laboratory performed heating experiments three years ago to measure the temperatures inside the PC3 tumours implanted in mice [13]. The measured temperature elevations along a central tumour path varied a lot, from 8 °C to 35 °C in the tumours. Therefore, our simulated temperature elevations from 10 °C to 18 °C along similar paths were still within the range of the experimental results. However, direct comparisons to the experimental results were difficult to conduct, since the current theoretical simulation was a retrospective study involving dissected tumours from the mice. There were several key items unavailable for us to make a direct comparison. Since the tumour was dissected from the mice, it was unclear which side of the tumour was originally attached to the mice, and how deep the tumour was embedded in the mouse. In our theoretical simulation, the tumour was embedded in the mouse body using the orientation of the tumour as it was placed in the microCT scanning chamber. As shown in our theoretical simulation, heat removal to the relatively cold mouse body was a key factor that affected the temperature elevations in the tumour. In addition, the blood perfusion rate inside the tumours was not measured during the experiments. The blood perfusion rate used in the simulation was obtained from a previous study [19] by other research groups under normothermic conditions. The model also did not take into consideration the possibility that the local vasculature might be damaged during the heating. The effect of inter-particle interactions at high local nanoparticle concentrations on their heating ability could also be a factor contributing to the accuracy of the model. These uncertainties have added difficulty for direct validation of the model.
In summary, we have developed computational algorithms to simplify the large amount of microCT data of tumours. The feasibility of using the algorithms to generate tumour prototypes similar to its original shape and size has been demonstrated in the study. We have also developed an algorithm to simplify the large amount SAR information contained in the microCT images and ensured that the simplified version can be accepted by a numerical software package. The simulated temperature field using the generated tumour geometry and simplified SAR distribution is reasonable and correlates well with the amount of the total thermal energy deposited into the tumours.
Declaration of interest
This study was supported in part by an NSF research grant CBET-1335958 and by the GAANN Scholarship Program (DoE P200A100124) at UMBC. The research was performed in partial fulfilment of the requirements for the PhD degree from UMBC by Alexander LeBrun. The authors alone are responsible for the content and writing of the paper.
References
- Du L, Zhou J, Wang X, Sheng L, Wang G, Xie X, et al. Effect of local hyperthermia induced by nanometer magnetic fluid on the rabbit VX2 liver tumor model. Prog Nat Sci 2009;19:1705–12
- Gazeau F, Lévy M, Wilhelm C. Optimizing magnetic nanoparticle design for nanothermotherapy. Nanomedicine (Lond) 2008;3:831–44
- Jordan A, Scholz R, Wust P, Fahling H, Felix R. Magnetic fluid hyperthermia (MFH):Cancer treatment with AC magnetic field induced excitation of biocompatible superparamagnetic nanoparticles. J Magn Magn Mater 1999;201:413–19
- Salloum M, Ma R, Weeks D, Zhu L. Controlling nanoparticle delivery in magnetic nanoparticle hyperthermia for cancer treatment: Experimental study in agarose gel. Int J Hyperthermia 2008;24:337–45
- Salloum M, Ma R, Zhu L. An in-vivo experimental study of temperature elevations in animal tissue during magnetic nanoparticle hyperthermia. Int J Hyperthermia 2008;24:589–601
- Salloum M, Ma R, Zhu L. Enhancement in treatment planning for magnetic nanoparticle hyperthermia: Optimization of the heat absorption pattern. Int J Hyperthermia 2009;25:311–23
- Zhu L. Recent developments in biotransport. ASME J Thermodynam Sci Eng Appl 2010;2:040801
- Bruners P, Braunschweig T, Hodenius M, Pietsch H, Penzkofer T, Baumann M, et al. Thermoablation of malignant kidney tumors using magnetic nanoparticles: An in vivo feasibility study in a rabbit model. CardioVasc Intervent Radiol 2010;13:127–34
- Hilger I, Hergt R, Kaiser WA. Towards breast cancer treatment by magnetic heating. J Magn Magn Mater 2005;293:314–19
- Jordan A, Scholz R, Wust P, Fahling H, Krause J, Wlodarczyk W, et al. Effects of magnetic fluid hyperthermia (MFH) on C3H mammary carcinoma in vivo. Int J Hyperthermia 1997;13:587–605
- Jordan A, Wust P, Fahling H, John W, Hinz A, Felix R. Inductive heating of ferromagnetic articles and magnetic fluids: Physical evaluation of their potential for hyperthermia. Int J Hyperthermia 1993;9:51–68
- Johannsen M, Thiesen B, Gneveckow U, Taymoorian K, Waldofner N, Scholz R, et al. Thermotherapy using magnetic nanoparticles combined with external radiation in an orthotropic rat model of prostate cancer. Prostate 2006;66:97–104
- Attaluri A, Ma R, Qiu Y, Li W, Zhu L. Nanoparticle distribution and temperature elevations in prostatic tumors in mice during magnetic nanoparticle hyperthermia. Int J Hyperthermia 2011;27:491–502
- Jordan A, Scholz R, Wust P, Fahling H, Felix R. Magnetic fluid hyperthermia (MFH): Cancer treatment with AC magnetic field induced excitation of biocompatible superparamagnetic nanoparticles. J Magn Magn Mater 1999;201:413–19
- Wust P, Gneveckow U, Johannsen M, Bohmer D, Henkel T, Kahmann F, et al. Magnetic nanoparticles for interstitial thermotherapy-feasibility, tolerance and achieved temperatures. Int J Hyperthermia 2006;22:673–85
- Lv, Y, Deng, Z, Liu, J. 3-D Numerical study on the induced heating effects of embedded micro/nanoparticles on human body subject to external medical electromagnetic field. IEEE J Nanobiosci 2005;4:284–94
- Attaluri A, Ma R, Zhu L. Using microCT imaging technique to quantify heat generation distribution induced by magnetic nanoparticles for cancer treatments. ASME J Heat Transfer 2011;133:011003
- LeBrun A, Conn N, Attaluri A, Manuchehrabadi N, Huang Z, Ma R, et al. Quantification of microCT image intensity and nanoparticle concentration in agarose gel. Paper presented at the ASME 2012 3rd Micro/Nanoscale Heat and Mass Transfer International Conference, MNHMT2012-75025, Atalanta, GA, April 2012
- Tompkins DT, Vanderby R, Klein SA, Beckman WA, Steeves RA, Frey DM, et al. Temperature-dependent versus constant-rate blood perfusion modeling in ferromagnetic thermoseed hyperthermia: Results with a model of the human prostate. Int J Hyperthermia 1994;10:517–36
- Gore JP, Xu LX. Thermal imaging for biological and medical diagnostics. In: Vo-Dinh T, ed. Biomedical Photonics Handbook. Boca Raton, FL: CRC Press; 2003. pp 17
- Moritz AR, Henriques FC. The relative importance of time and surface temperature in the causation of cutaneous burns. Am J Pathol 1947;23:695–720
- Diederich CJ. Thermal ablation and high-temperature thermal therapy: Overview of technology and clinical implementation. Int J Hyperthermia 2005;21:745–53
- Sapareto SA, Dewey WC. Thermal dose determination in cancer therapy. Int J Radiat Oncol Biol Phys 1984;10:787–800
- Dewhirst MW, Viglianti BL, Lora-Michiels, M., Hanson M, Hoopes PJ. Basic principles of thermal dosimetry and thermal thresholds for tissue damage from hyperthermia. Int J Hyperthermia 2003;19:267–94
- Hayashi K, Markel MD. Thermal capsulorrhaphy treatment of shoulder instability: Basic science. Clin Orthop 2001;390:59–72
- Su D, Ma R, Salloum M, Zhu L. Multiscale study of nanoparticle deposition on cell surface during an injection process. Med Biol Eng Comput 2010;48:853–63
- Su D, Ma R, Zhu L. Numerical study of nanofluid infusion in deformable tissues in hyperthermia cancer treatment. Med Biol Eng Comput 2011;49:1233–40
- Su D, Ma R, Zhu L. Numerical study of liquid composite molding using a smoothed particle hydrodynamics method. Special Topics Rev 2011;2:205–16
- Manuchehrabadi N, Chen Y, LeBrun A, Ma R, Zhu L. Theoretical simulation of temperatures in tumors using Monte Carlo method and comparison to experimental measurements during laser photothermal therapy. Paper preented at the ASME 2013 Summer Bioengineering Conference, SBC2013-14330, Sunriver, Oregon, June, 2013
- He X, McGee S, Coad JE, Schmidlin F, Iaizzo PA, Swanlund DJ, et al. Investigation of the thermal and tissue injury behaviour in microwave thermal therapy using a porcine kidney model. Int J Hyperthermia 2004;20:567–93
- Nan Q, Zheng WY, Fan ZT, Liu YJ, Zeng Y. Analysis to a critical state of thermal field in microwave ablation of liver cancer influenced by large vessels. Int J Hyperthermia 2010;26:34–8