Abstract
Purpose: The aim of this study was to show the potential of magnetic resonance electrical impedance tomography (MREIT) conductivity imaging in terms of its capability to detect ablated lesions and differentiate tissue conditions in liver radiofrequency (RF) ablation. Materials and methods: RF ablation procedures were performed in bovine livers using a LeVeen RF needle electrode. Ablation lesions were created using a power-controlled mode at 30, 50, and 70 W for 1, 3, and 5 min of exposure time, respectively. After the ablation, the liver was cut into several blocks including the ablated lesion, and positioned inside a phantom filled with agarose gel. Electrodes were attached on the side of the phantom and it was placed inside the MRI bore. For MREIT imaging, multi-spin-echo pulse sequence was used to obtain the magnetic flux density data according to the injection currents. Results: The conductivity of ablation lesions was significantly changed with the increase of exposure time (pKW < 0.01, Kruskal-Wallis test). With RF powers of 30 and 50 W, significant differences between the coagulation necrosis and hyperaemic rim were observed for more than 5 min and 3 min, respectively (pMW < 0.01, Mann-Whitney test). At 70 W, all cases showed significant differences except 3 min (pMW < 0.01). The positive correlation between the exposure time and tissue conductivity was observed in both two ablation areas (pSC < 0.01, Spearman correlation). Conclusions: This ex vivo feasibility study demonstrates that current MREIT conductivity imaging can detect liver RF ablation lesions without using any contrast media or additional MR scan.
Introduction
Radiofrequency (RF) ablation is a widely used technique for the treatment of liver tumours such as hepatocellular carcinoma and metastasis [Citation1–3]. Numerous studies have evaluated RF ablation as a successful therapeutic modality providing reliable outcomes [Citation4,Citation5]. The evaluation of ablative lesions is one of the most critical research topics related to the prediction of local recurrence after RF ablation [Citation6]. Contrast-enhanced computed tomography (CT) and magnetic resonance imaging (MRI) are widely used modalities in evaluating ablated lesions by comparing the differences before and after RF ablation [Citation7]. However, it has been reported that there are several fundamental difficulties in the determination of ablation lesion. In contrast-enhanced CT and MR images, the ablated lesions are not clearly visualised due to the weak contrast in the coagulation area which includes different tissue characteristics. Moreover, the ablated lesions are usually surrounded by enhanced rims caused by hyperaemia. This makes it difficult for the detection of local recurrence [Citation7,Citation8]. Recently, temperature-sensitive MR imaging such as proton resonance frequency (PRF) shift, diffusion coefficient, T1 relaxation time, magnetisation transfer, proton density, and temperature-sensitive contrast agents are widely used for the monitoring of heat-based thermal ablation [Citation9–11].
It is well known that the major factors causing changes in the electrical conductivity are molecular composition, cellular structure, concentration and mobility of ions in intra- and extra-cellular fluids, and other related factors [Citation12,Citation13]. Several studies have reported that malignant tissue showed a higher conductivity than surrounding normal tissue [Citation14]. In addition, some studies have demonstrated significant differences in conductivity between normal and neoplastic tissues at radiofrequencies in various tumour models [Citation15–17]. Recently, Haemmerich et al. [Citation18] reported that the measured electrical conductivity was significantly increased in both normal and tumour tissues after RF ablation. Thus, the conductivity distribution of tissues and organs may provide meaningful diagnostic information related to physiological and pathological conditions. However, previous studies have been focused on the measurement of electrical tissue conductivity using tissue samples. There have been no reported imaging studies which provide the conductivity distributions of the human body before and after RF ablation. Magnetic resonance electrical impedance tomography (MREIT) is one of the unique imaging modalities capable of visualising a high-resolution conductivity distribution of the human body in a non-invasive manner [Citation19]. Combining a constant current source to an existing MRI scanner, MREIT may provide new contrast information that is not available from other imaging modalities [Citation20–22].
The purpose of this study is to show the potential of MREIT techniques following RF ablation in terms of the capability to detect ablated lesions and differentiate tissue conditions according to the different ablation exposure times and RF power levels. Here we separated the thermal relationship to conductivity by performing the MREIT imaging experiment over 1 h after the RF ablation procedure, by which time the tissue samples had reached thermal equilibrium.
Materials and methods
RF ablation
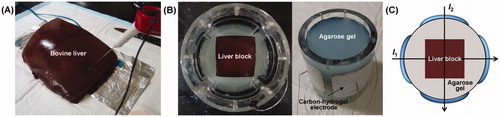
A RF 2000 (RadioTherapeutics, Sunnyvale, CA, USA) generator with LeVeen expandable electrodes was used for ex vivo liver RF ablation. The RF ablation procedure was performed in seven bovine livers purchased from a local butcher. Each of them arrived at our laboratory on the morning of the experiment and the elapsed times from butchery were almost the same for all the cases. To avoid interexaminer differences, all experiments were performed by one examiner. A 15-gauge, 3-cm diameter expandable 10-hook needle electrode was inserted directly into the liver parenchyma (). In all seven bovine livers, ablation lesions were created in a linear interrupted fashion using a power-controlled mode at 30, 50, and 70 W for 1, 3, and 5 min of exposure time, respectively. After RF ablation, the liver was cut immediately into 7 × 7 × 7 cm3 blocks for MREIT imaging experiment and cross-sectional images. All 70 liver blocks (63 ablated and 7 non-ablated) were fixed in 10% neutral buffered formalin and stained for histopathological examination.
Figure 1. Experimental set-up for ex vivo liver RF ablation using MREIT. (A) RF ablation procedure in the bovine liver. (B) Top and side views of a conductivity phantom including the ablated liver block. (C) Four carbon-hydrogel electrodes are attached on the middle of the cylindrical surface to inject currents I1 and I2 along two different directions.
Phantom preparation
A cylinder-shaped acrylic phantom 13 cm in diameter and 16 cm in height was used for the MREIT imaging experiment. Inside the phantom, the resected liver block including the ablated lesion was positioned in the centre of the phantom. The phantom was filled with conductive material (agarose gel of 1.0 S/m conductivity) for supporting the position of the liver block (). Four carbon-hydrogel electrodes (HUREV, Wonju, Korea) were attached on the sides of the phantom and currents I1 and I2 were sequentially injected from two different directions through two pairs of opposing electrodes (). Following phantom preparation time of over 40 min, the phantom was placed inside the bore of a 3T MRI scanner (Achieva TX, Philips Medical Systems, Best, the Netherlands). By this time the phantom and liver tissue blocks had reached thermal equilibrium at room temperature. Since the electrical conductivities are closely related to the temperature variations in the order of 2% °C−1 [Citation23], we excluded the thermal relationship to conductivity by performing the imaging experiment at thermal equilibrium. Moreover, as our MREIT technique provides conductivity distribution at low frequency below 100 Hz, we concentrated on the low frequency conductivity which is known to be a physiologically interesting frequency range [Citation13,Citation23].
Imaging experiment
Conventional T1-weighted and T2-weighted MR imaging was performed to confirm the morphological changes associated with RF ablation. Using a custom-designed constant current source, the first current I1 was injected between one opposing pair of electrodes. The injected current was 7 mA with a total pulse width of 81 ms. After obtaining the first magnetic flux density (Bz) data set for I1, the second injection current I2 with the same amplitude and pulse width was injected through the other pair of opposing electrodes to obtain the second data set. The quality of conductivity images depends primarily on the noise level in the measured Bz image. The noise levels in Bz are closely related to the MR magnitude signal to noise ratio (SNR) and the injected currents [Citation19]. To better apply this technique in vivo, advanced MR imaging methods and multi-channel high-sensitivity RF coils may be employed to minimise noise level and reduce the imaging current. In this MREIT imaging, spin-echo based multi-echo pulse sequence was used to obtain the MR magnitude and magnetic flux density (Bz) images. This sequence used multiple refocusing pulses and was synchronised to the injection currents with alternating polarity. It maximised the width of the injection currents and minimised the noise standard deviation of the measured Bz data [Citation24,Citation25]. The imaging parameters used were repetition time/echo time (TR/TE) = 800/15, 30, 45, 60 ms (4 echoes), field of view (FOV) 180 × 180 mm2, slice thickness 3 mm, number of excitations (NEX) 6, matrix size 128 × 128, and number of slices 8. The total imaging time to obtain the magnetic flux densities (Bz,1 and Bz,2) by I1 and I2 was 25 min.
Conductivity image reconstruction and data analysis
The single-step harmonic Bz algorithm implemented in CoReHA (conductivity reconstructor using harmonic algorithms) was used for the multi-slice conductivity image reconstructions [Citation26,Citation27]. The harmonic Bz algorithm estimates the conductivity for a given slice by incorporating the harmonic relation between the 2-dimentional ▿σ and the Laplacian of Bz. When we assume σ = σ0, the forward solver calculates the voltage data and then can estimate the conductivity from the ▿σ. This process is repeated until the true conductivity is achieved [Citation19]. CoReHA provides GUI-based functions for all data processing routines needed to produce conductivity images from measured k-space data sets. Note that the algorithm is capable of producing equivalent isotropic scaled conductivity images. All conductivity images presented in this paper should be interpreted as scaled conductivity images providing only contrast information.
Following the work of McGahan and Dodd [Citation28], we determined the coagulation necrosis and hyperaemic rim regions of interest from digital photographs of the liver blocks and co-registered these with the pixels of the MREIT conductivity images. The area of hyperaemic rim was averaged from the outer boundary to the inside of ablated lesion over 4 pixels or 6 mm. The remaining inner area was defined as coagulation necrosis. For the quantitative analysis, we measured scaled conductivity in the normal tissue and the coagulation necrosis, hyperaemic rim of ablation lesion, respectively. Together with the imaging experiment after the ablation, we directly extracted each tissue samples and measured the actual conductivity values with an impedance analyser (SI1260A, AMETEK, Farnborough, Hampshire, UK) to support the consistency with the imaging experimental results.
Statistical analysis
Since the present MREIT imaging technique only provided contrast information of tissue conductivity, the relative conductivity contrast ratio (rCCR) (%) between normal and ablated liver tissues was introduced as a quantitative criterion in the reconstructed conductivity images. Based on the measured conductivity values from normal tissue, rCCRs represent a percentage difference in the abnormal tissues.
where σabnormal and σnormal represent the conductivity values of ablated lesion and normal tissue in the liver, respectively. Since the conductivity changes showed high sensitivity in both normal and tumour tissues after RF ablation [Citation17,Citation18], the variations of rCCR by different RF powers and exposure times may provide distinct tissue conditions regarding the concentration and mobility of ions in intra- and extra-cellular fluids. The positive rCCR values represent the increase of conductivity, and negative mean the decrease of conductivity in the ablated lesion due to the variations of ion mobility and cellular fluid.
Two rCCR values were obtained from all seven liver samples, one rCCR for the coagulation necrosis and the other rCCR for the hyperaemic rim, compared to normal tissue. All values were expressed as mean ± standard deviation, and plotted a bar graph as a function of time to compare the time series progression of different tissue components. Statistical analysis was performed using commercially available software (SPSS, version 14.0 for Windows, Chicago, IL). The ablation lesions in each of the three different exposure times were compared with use of the Mann-Whitney test [Citation29,Citation30]. The Kruskal-Wallis test was used to compare the significant differences among the exposure times in both the coagulation necrosis and hyperaemic rim [Citation29]. Additionally, Spearman correlation analysis was used in both the coagulation necrosis and hyperaemic rim to determine the relationship between an exposure time and rCCR value [Citation29,Citation30]. A p value less than 0.05 was regarded as statistically significant. Three different symbols of p values, pMW, pKW, and pSC were used for indicating the Mann-Whitney test, Kruskal-Wallis test, and Spearman correlation analysis, respectively.
Results
Conductivity imaging experiment
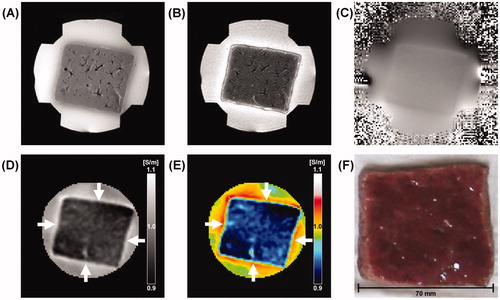
shows typical MREIT images of normal liver tissue before radiofrequency (RF) ablation. The conventional T1-, T2-weighted MR images of normal liver tissue show liver parenchyma and blood vessels without any pathological abnormalities (). The magnetic flux density (Bz) in is the fundamental data used for the reconstruction of conductivity. The Bz image visualises the z-axis distribution of magnetic flux density according to the current injected horizontally into the liver block. Compared with the surrounding agarose gel with high conductivity value, the reconstructed conductivity and colour-coded images of normal liver tissue represent a relatively lower homogeneous conductivity (). The rectangle-shaped region (white arrows) of a higher conductivity around the periphery of the liver tissue is ion diffusion and chemical reaction between the liver tissue and agarose gel of NaCl and CuSO4. The chemical reaction between the liver tissue and agarose polymer produces Cu(OH)2 precipitation. After finishing the experiment, we could indeed observe that Cu2+ penetrated into the liver producing a rectangle-shaped region of pale blue Cu(OH)2 precipitation.
Figure 2. Typical MREIT images of normal liver tissue before RF ablation. (A, B) T1-, T2-weighted MR images of a liver tissue. (C) A magnetic flux density image induced by the horizontal injection current. (D, E) Reconstructed conductivity and colour-coded conductivity images of normal liver tissue. (F) Photograph of normal liver tissue at the same imaging slice. The conductivity images of normal liver tissue show a relatively lower homogeneous distribution compared to surrounding agar material. The white arrows indicate the ion diffusion and chemical reactions between the liver tissue and agarose gel.
shows typical MREIT images of ablated liver tissue following 3 min of RF ablation at 50 W. The reconstructed conductivity and colour-coded images () clearly show the ablated lesion which is not apparent in the anatomical T1-, T2-weighted MR images (). In this slice, a hyperaemic rim of 6 mm or 4 pixels and coagulation necrosis of 34 mm max were identified as regions of interest on a digital photograph (). The average rCCRs of a total of seven liver blocks increased in both the coagulation necrosis (white arrow) and hyperaemic rim (black arrow) of 3.07% and 2.36%, respectively (). In particular, the rCCR of the coagulation necrosis shows significantly higher than that of the hyperaemic rim (, pMW < 0.01). Compared with the cross-sectional pictures (), our conductivity images were well matched to the tissue conditions after RF ablation.
Figure 3. Typical MREIT images of ablated liver tissue with a power of 50 W following 3 min of exposure time. (A, B) T1-, T2-weighted MR images of ablated liver tissue. (C) A magnetic flux density image induced by the horizontal injection current. (D, E) Reconstructed conductivity and colour-coded conductivity images of ablated liver tissue showing a significantly increased contrast and well-defined lesions. (F) A photograph of ablated liver tissue at the same imaging slice. The arrows indicate the coagulation necrosis (white arrow) and the hyperaemic rim (black arrow).
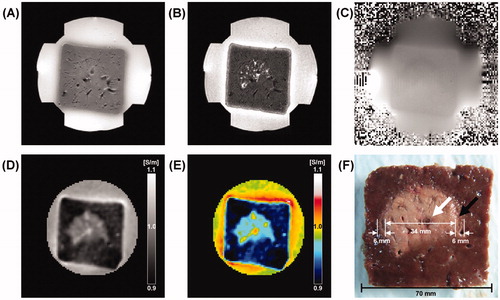
Table I. Relative conductivity contrast ratios (%) of liver tissues after RF ablation. Ablation lesions were created in a linear interrupted fashion using a power-controlled mode at 30, 50, and 70 W for 1, 3, and 5 min of exposure time, respectively.
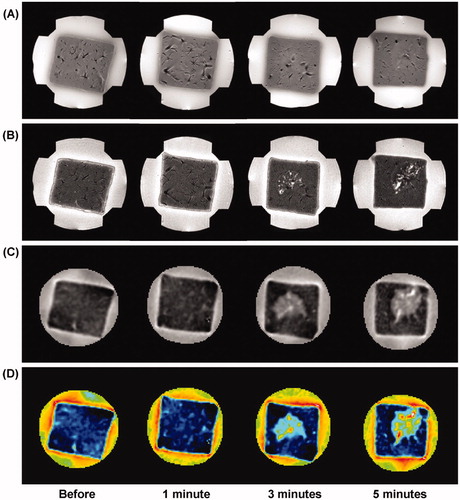
represents a time-course variation of liver tissue before and after RF ablation following the 1, 3, and 5 min of exposure time with the same RF power of 50 W. The conductivity images reveal increased contrast and well-defined lesions with more than 3 min of exposure time. In particular, the rCCR of the coagulation necrosis was significantly higher than that of the hyperaemic rim for more than 3 min of exposure time (, pMW < 0.01). There was no significant change in the conductivity image within 1 min of exposure time (pMW = 0.097).
Figure 4. Time-course variation of liver tissue before and after RF ablation at 50 W. (A) T1-weighted, (B) T2-weighted, (C) reconstructed conductivity, and (D) colour-coded conductivity images obtained before and after 1, 3, and 5 min ablation time, respectively. Reconstructed conductivity images show significantly increased contrast and well-defined lesions for more than 3 min of exposure time.
shows the results of MREIT images following the three different RF powers with the same exposure time of 5 min. According to the degree of ablation by the induced power, the reconstructed conductivity images obtained from the ablated lesion show increased contrast and well-defined lesions in all RF powers. The conductivity images of ablated tissue show an increasing contrast in proportion to the RF ablation powers. The rCCR of the coagulation necrosis was significantly higher than that of the hyperaemic rim in all RF power settings (, pMW < 0.01). The relatively decreased conductivity contrast in the centre of the coagulation area for the case with RF power of 70 W (white arrow) represents charred tissue or tissue loss by thermal injury.
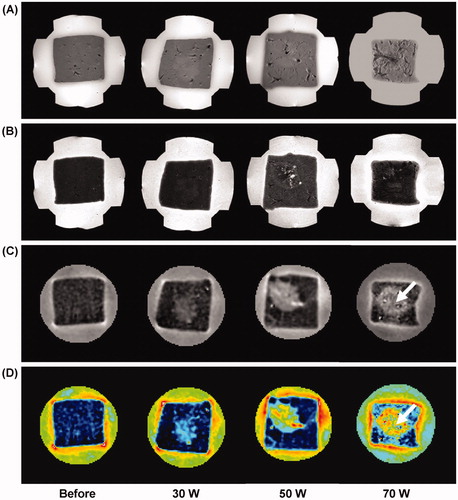
Figure 5. Power-dependent variation of liver tissue before and after RF ablation with the same exposure time of 5 min. (A) T1-weighted, (B) T2-weighted, (C) reconstructed conductivity, and (D) colour-coded conductivity images from the ablation lesions using a power-controlled mode at 30, 50, and 70 W, respectively. Reconstructed conductivity images show significantly increased contrast and well-defined lesions in all cases. The arrow indicates the charred tissue caused by thermal injury.
Analysis of conductivity images
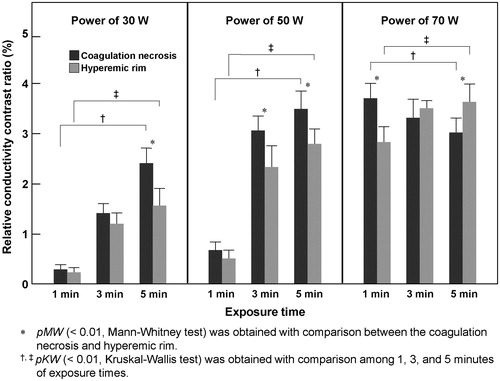
and summarise the quantitative analysis of ex vivo MREIT conductivity images in the liver RF ablation. The average rCCRs of seven liver blocks were significantly changed according to the increase of exposure time of ablation in both the coagulation necrosis and hyperaemic rim (pKW < 0.01). In the case of RF power at 30 and 50 W, significant differences of rCCR between the coagulation necrosis and hyperaemic rim were observed from the tissue samples that underwent RF ablation for more than 5 min and 3 min of exposure time, respectively (pMW < 0.01). On the contrary, rCCRs of power at 70 W showed a different pattern. Significant differences of rCCRs were observed in all cases except 3 min of exposure time (pMW < 0.01). Since the charred tissues having a low conductivity occurred in the centre of coagulation necrosis, the difference was not significant in the 3 min case (pMW > 0.05). The overall relationship between the exposure times and rCCRs showed positive correlation in both ablation lesions (pSC < 0.01). However, the coagulation necrosis at the RF power of 70 W showed significant negative correlation due to the decrease of conductivity from the charred tissue (, pSC < 0.01).
Figure 6. The bar graph shows the relative conductivity contrast ratio (%) of liver tissues by different exposure times and RF powers after RF ablation. Based on the conductivity value of normal liver tissue, the average rCCR of ablation lesion obtained from a total of seven liver blocks.
Histological findings
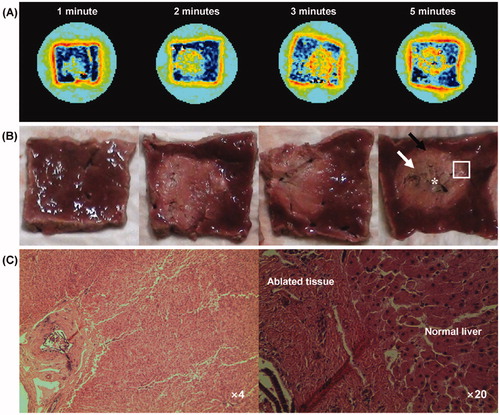
shows the MREIT conductivity images and cross-sectional pictures at the corresponding imaging slice, and microscopic findings (H&E stain, ×4, ×20) obtained from the ablation lesions (rectangle region) with the power of 70 W for 1, 2, 3 and 5 min of exposure time of ablation, respectively. The conductivity images reveal increased contrast and well-defined lesions in all cases (). A cross-sectional picture of the 5 min case indicates carbonisation (asterisk), coagulation necrosis (white arrow) and the hyperaemic rim (black arrow) (). Compared with the cross-sectional pictures, the present conductivity images visualised the characteristics of liver RF ablation lesion and were well matched to the tissue conditions after RF ablation. The ablation zones in the liver on the H&E stain showed the presence of central coagulation necrosis surrounded by a hyperaemic rim ().
Figure 7. (A) Colour-coded conductivity images at the RF power of 70 W for 1, 2, 3 and 5 min of exposure time, respectively. (B) Photography shows the cross-section of ablated liver tissue at the corresponding conductivity imaging slice. The arrows indicate the carbonisation (asterisk), coagulation necrosis (white arrow) and the hyperaemic rim (black arrow). (C) Microscopic findings of ablated liver tissue obtained from the rectangle region (H&E stain, ×4 and ×20).
Discussion
Radiofrequency (RF) ablation is a typical heat-based ablation technique for the non-invasive treatment of liver cancer [Citation1–5]. It is well known that RF ablation causes thermal injury due to resistive heating and consequently leads to coagulation necrosis [Citation18]. The thermal injury in the liver tissue may cause changes in cellular structure, concentration and mobility of ions in intra- and extra-cellular fluids, and other related factors. These features could be detected by the MREIT technique which is one of the tissue property imaging techniques that provides electrical conductivity information.
Previous in vitro studies that measured conductivity using the impedance analyser system demonstrated that the electrical conductivity was significantly increased in both normal and tumour tissues after RF heating [Citation18,Citation31]. As the first conductivity imaging study of RF ablation, our MREIT conductivity images show increased contrast and well-defined lesions in all cases. Note that all conductivity values shown in this study precluded thermal effects as the images were acquired at thermal equilibrium of the tissue sample, 40 min after RF ablation. The conductivity values in ablation lesions including the coagulation necrosis and hyperaemic rim show significant changes with proportion to the exposure time of RF ablation in all RF powers. These changes are related to the tissue coagulation after RF heating [Citation18]. Since the cellular membrane of living cells acts as an electrical insulator at low frequencies, and this membrane is damaged during cell death, the region of cell necrosis represents higher conductivity than normal tissue [Citation17,Citation18]. These results are promising and suggest there is value in advancing the MREIT technique to the stage of human experiments with the view to developing a useful tool for lesion detection.
In performing RF ablation, alternating current (AC) in the low-power settings causes agitation of the ions in its surrounding tissue. The ionic agitation causes frictional heat that extends into adjacent tissues by conduction. The resistive heat subsequently causes coagulation necrosis with higher conductivity value than normal liver tissue. However, at high-power settings the structure of biomolecules are quickly destroyed through desiccation and charring of the tissue, and heat production is minimal. The conductivity of the charred tissue gradually decreases due to the cell destruction [Citation28,Citation32,Citation33]. In our results, conductivity images may provide evidence for the relationship between the tissue conditions and RF ablation parameters.
Coagulation necrosis and hyperaemic rim were significantly differentiated by the degree of exposure time and RF power. In the low power setting, ablation lesions are mainly composed of the coagulation necrosis and hyperaemic rim. The conductivity value of the hyperaemic rim was lower than the coagulation necrosis. This is likely to be due to the different tissue characteristics. It stems from the fact that the hyperaemic rim is a mixture of normal liver and peripheral haemorrhage with substantially low conductivity, while coagulation tissue has a higher relative conductivity value [Citation13,Citation18,Citation28]. On the contrary, in the high power setting, ablation lesions are composed of the coagulation necrosis, hyperaemic rim, and charred tissue according to the degree of the exposure time. The conductivity value of the charred tissue in the centre of the coagulation area is low due to the cell destruction [Citation13,Citation18]. This tissue condition causes gradual decrease of conductivity value in the coagulation necrosis. This is reflected by the observation that the hyperaemic rim showed positive correlation between the exposure time and conductivity value, while the coagulation necrosis had negative correlation. Thus, the present MREIT technique is able to image the characteristics of ablated tissue based on the electrical conductivity by injecting external current inside the biological tissue.
It should be noted that the measured electrical conductivity of the liver tissue is significantly increased in both normal and tumour tissues after RF ablation [Citation15–17]. The variation of electrical conductivity was considerably higher in tumour tissues due to the high variation including, for example, cell differentiation, necrosis and blood supply [Citation18,Citation31]. Therefore, it is promising that MREIT conductivity imaging may provide new contrast information of RF ablation in both normal and tumour tissues.
There are several limitations in this preliminary study. First, the imaging experiments were only performed on the normal liver samples of single species; additional studies in various tissue characteristics are required to confirm this difference. Second, the electrical conductivity of ex vivo tissue is slightly different from in vivo state due to the complicated tissue responses to heating in living organs [Citation34]. Therefore, in vivo electrical conductivity of liver tissue may differ from the data presented here. Third, most importantly, the temperature-related conductivity changes during the ablation are not evaluated. Since the conductivity was measured at thermal equilibrium, we could not determine a thermal effect on ablation.
In order to be useful in a clinical environment, the ablation lesion would need to be assessed within the image acquisition time of a few minutes. Recent image-guided ablations were performed by the monitoring of the ongoing ablation and using the image-based information to control energy deposition [Citation28,Citation35]. To reduce the MREIT imaging time while maintaining or improving the image quality, we are now performing numerous approaches including pulse sequence (such as GRE, EPI, and SSFP), k-space sampling strategies, and multi-channel RF coils. If these are combined together, the imaging time might be decreased to clinically viable durations.
Conclusion
This feasibility study demonstrates that MREIT imaging based on the conductivity distribution of tissues can monitor liver RF ablation without using any contrast media or additional MR scan. The reconstructed conductivity images are clearly correlated with the duration and strength of the RF ablation. However, the static information of conductivity is not enough for clinical use. To better apply this technique in the clinical environment, real-time monitoring of tissue conductivity is essential. By applying the recent technical progress in general MRI technology, we expect that in vivo disease model animal and human imaging can provide useful conductivity information of tissues in situ for diagnosis and modelling studies.
Declaration of interest
This work received financial support from the National Research Foundation of Korea (NRF) grant funded by Korea government (MSIP and MEST), grant no. 2010-0018275, 2013R1A2A2A04016066, 2012R1A1A2008477. The authors alone are responsible for the content and writing of the paper.
References
- Rossi S, Di Stasi M, Buscarini E, Quaretti P, Garbagnati F, Squassante L, et al. Percutaneous RF interstitial thermal ablation in the treatment of hepatic cancer. Am J Roentgenol 1996;167:759–68
- Livraghi T, Goldberg SN, Lazzaroni S, Meloni F, Ierace T, Solbiati L, et al. Hepatocellular carcinoma: Radio-frequency ablation of medium and large lesions. Radiology 2000;214:761–8
- Thaker AA, Razjouyan F, Woods DL, Haemmerich D, Sekhar K, Wood BJ, et al. Combination therapy of radiofrequency ablation and bevacizumab monitored with power Doppler ultrasound in a murine model of hepatocellular carcinoma. Int J Hyperthermia 2012;28:766–75
- Goldberg SN, Gazelle GS, Solbiati L, Livraghi T, Tanabe KK, Hahn PF, et al. Ablation of liver tumors using percutaneous RF therapy. Am J Roentgenol 1998;170:1023–8
- Lencioni R, Cioni D, Bartolozzi C. Percutaneous radiofrequency thermal ablation of liver malignancies: Techniques, indications, imaging findings, and clinical results. Abdom Imaging 2001;26:345–60
- Kim Y, Rhim H, Cho OK, Koh BH, Kim Y. Intrahepatic recurrence after percutaneous radiofrequency ablation of hepatocellular carcinoma: Analysis of the pattern and risk factors. Eur J Radiol 2006;59:432–41
- Mori K, Fukuda K, Asaoka H, Ueda T, Kunimatsu A, Okamoto Y, et al. Radiofrequency ablation of the liver: Determination of ablative margin at MR imaging with impaired clearance of ferucarbotran – Feasibility study. Radiology 2009;251:557–65
- Limanond P, Zimmerman P, Raman SS, Kadell BM, Lu DS. Interpretation of CT and MRI after radiofrequency ablation of hepatic malignancies. Am J Roentgenol 2003;181:1635–40
- de Senneville BD, Mougenot C, Quesson B, Dragonu I, Grenier N, Moonen CT. MR thermometry for monitoring tumor ablation. Eur Radiol 2007;17:2401–10
- Rieke V, Butts Pauly K. MR thermometry. J Magn Reson Imaging 2008;27:376–90
- Bruners P, Pandeya GD, Levit E, Roesch E, Penzkofer T, Isfort P, et al. CT-based temperature monitoring during hepatic RF ablation: Feasibility in an animal model. Int J Hyperthermia 2012;28:55–61
- Geddes LA, Baker LE. The specific resistance of biological material: A compendium of data for the biomedical engineer and physiologist. Med Biol Eng 1967;5:271–93
- Gabriel S, Lau RW, Gabriel C. The dielectric properties of biological tissues: II. Measurements in the frequency range 10 Hz to 20 GHz. Phys Med Biol 1996;44:2251–69
- Fricke H, Morse S. The electric capacity of tumours of the breast. J Cancer Res 1926;10:340–76
- Smith SR, Foster KR, Wolf GL. Dielectric properties of VX-2 carcinoma versus normal liver tissue. IEEE Trans Biomed Eng 1986;33:522–4
- Surowiec AJ, Stuchly SS, Barr JB, Swarup A. Dielectric properties of breast carcinoma and the surrounding tissues. IEEE Trans Biomed Eng 1988;35:257–63
- Haemmerich D, Staelin ST, Tsai JZ, Tungjitkusolmun S, Mahvi DM, Webster JG. In vivo electrical conductivity of hepatic tumours. Physiol Meas 2003;24:251–60
- Haemmerich D, Schutt DJ, Wright AS, Webster JG, Mahvi DM. Electrical conductivity measurement of excised human metastatic liver tumours before and after thermal ablation. Physiol Meas 2009;30:459–66
- Woo EJ, Seo JK. Magnetic resonance electrical impedance tomography (MREIT) for high-resolution conductivity imaging. Physiol Meas 2008;29:R1-R26
- Oh SH, Lee BI, Park TS, Lee SY, Woo EJ, Cho MH, et al. Magnetic resonance electrical impedance tomography at 3 Tesla field strength. Magn Reson Med 2004;51:1292–6
- Hamamura MJ, Muftuler LT, Birgul O, Nalcioglu O. Measurement of ion diffusion using magnetic resonance electrical impedance tomography. Phys Med Biol 2006;51:2753–62
- Kim HJ, Kim YT, Minhas AS, Jeong WC, Woo EJ, Seo JK, et al. In vivo high-resolution conductivity imaging of the human leg using MREIT: The first human experiment. IEEE Trans Med Imaging 2009;28:1681–7
- Oh TI, Kim HJ, Jeong WC, Chauhan M, Kwon OI, Woo EJ. Detection of temperature distribution via recovering electrical conductivity in MREIT. Phys Med Biol 2013;58:2697–711
- Nam HS, Kwon OI. Optimization of multiply acquired magnetic flux density Bz using ICNE-multiecho train in MREIT. Phys Med Biol 2010;55:2743–59
- Minhas AS, Jeong WC, Kim YT, Han YQ, Kim HJ, Woo EJ. Experimental performance evaluation of multi-echo ICNE pulse sequence in magnetic resonance electrical impedance tomography. Magn Reson Med 2011;66:957–65
- Oh SH, Lee BI, Woo EJ, Lee SY, Cho MH, Kwon O, et al. Conductivity and current density image reconstruction using harmonic Bz algorithm in magnetic resonance electrical impedance tomography. Phys Med Biol 2003;48:3101–16
- Jeon K, Minhas AS, Kim YT, Jeong WC, Kim HJ, Kang BT, et al. MREIT conductivity imaging of postmortem canine abdomen using CoReHA. Physiol Meas 2009;30:957–66
- McGahan JP, Dodd GD. Radiofrequency ablation of the liver: Current status. Am J Roentgenol 2000;176:3–16
- Kim YN, Rhim H, Choi D, Kim YS, Lee MW, Lee WJ, et al. The effect of radiofrequency ablation on different organs: Ex vivo and in vivo comparative studies. Eur J Radiol 2011;80:526–32
- Terraz S, Cernicanu A, Lepetit-Coiffé M, Viallon M, Salomir R, Mentha G, Becker CD. Radiofrequency ablation of small liver malignancies under magnetic resonance guidance: Progress in targeting and preliminary observations with temperature monitoring. Eur Radiol 2010;20:886–97
- Haemmerich D, Schutt DJ. RF ablation at low frequencies for targeted tumor heating: In vitro and computational modelling results. IEEE Trans Biomed Eng 2011;58:404–10
- Goldberg SN, Gazelle GS, Halpern EF, Rittman WJ, Mueller PR, Rosenthal DI. Radiofrequency tissue ablation: Importance of local temperature along the electrode tip exposure in determining lesion size and shape. Acad Radiol 1996;3:212–8
- Li X, Zhang L, Fan W, Zhao M, Wang L, Tang T, et al. Comparison of microwave ablation and multipolar radiofrequency ablation, both using a pair of internally cooled interstitial applicators: Results in ex vivo porcine livers. Int J Hyperthermia 2011;27:240–8
- Haemmerich D, Ozkan R, Tungjitkusolmun S, Tsai JZ, Mahvi DM, Staelin ST, et al. Changes in electrical resistivity of swine liver after occlusion and postmortem. Med Biol Eng Comput 2002;40:29–33
- Clasen S, Pereira PL. Magnetic resonance guidance for radiofrequency ablation of liver tumors. J Magn Reson Imaging 2008;27:421–33