
Abstract
Purpose: The aim of this study was to evaluate the accuracy of real-time magnetic resonance imaging (MRI) T1-based treatment monitoring for predicting volume of lesions induced by laser-induced thermotherapy (LITT) of liver metastases.
Materials and methods: This prospective study was approved by the institutional review board and informed consent from all included patients was obtained. In 151 patients, 237 liver metastases were ablated during 372 LITT procedures. 1.5T MRI treatment monitoring was performed based on longitudinal relaxation time (T1) using fast low-angle shot (FLASH) sequences. Patients underwent additional contrast-enhanced MRI directly after LITT, 24 h after the procedure and during follow-up at 3, 6 and 12 months. The amount of energy necessary to induce a defined necrotic area was investigated within the various liver segments.
Results: The total amount of energy applied during LITT varied from 6.12–225.32 kJ (mean 48.96 kJ). Ablation in liver segments 5 (2.12 kJ/cm3) and 8 (2.16 kJ/cm3) required the highest energy. The overall pre-ablative metastasis volume ranged from 0.5–51.94 cm3 (mean 1.99 cm3, SD 25.49 cm3) while the volume measured in the last available T1 image varied from 0.78–120 cm3 (mean 26.25 cm3, SD 25.66 cm3). Volumes measured via MRI T1-based treatment monitoring showed a stronger correlation with necrosis 24 h after LITT (r = 0.933, p < 0.001) than contrast-enhanced MRI directly after the procedure (r = 0.888, p < 0.001).
Conclusions: Real-time MRI T1-based treatment monitoring during LITT of liver metastases allows for precise estimation of the resulting lesion volume and improves control of the energy necessary during ablation.
Introduction
The liver is one of the most affected organs for metastatic dissemination of primary tumours such as colon, pancreas, breast, and lung cancer [Citation1–3]. Although surgical resection remains the gold standard therapy for primary and secondary liver malignancies, minimal invasive ablative techniques such as laser-induced thermotherapy (LITT), radiofrequency ablation (RFA) or microwave ablation (MWA) have gained more importance in recent years [Citation1–4]. Monitoring of the ablation procedure and energy applied is essential because of differences in individual tissue perfusion rates [Citation2,Citation5]. The feasibility and accuracy of LITT treatment monitoring with real-time imaging in conventional MRI systems has been demonstrated in previous studies [Citation6,Citation7]. Real-time treatment monitoring allows for visualisation of the heat distribution and tumour necrosis and is crucial to detect and prevent a survival of malignant cells due to the heat-sink effect [Citation8,Citation9].
MRI treatment monitoring is performed as repeated measurements during the thermo-ablative intervention which allows for an estimation of the lethal thermal dose [Citation10–12]. Promising initial results measuring the resulting necrotic volume based on thermal-dose calculation maps have been reported [Citation13]. Animal studies showed that real-time treatment monitoring can be used to predict the size and position of the coagulation zone [Citation12,Citation14]. However, to our knowledge, there are no human studies with larger study groups investigating whether the volume calculated on real-time MRI T1-based treatment monitoring can be used as a predictor for the resulting necrotic volume after LITT and its development during follow-up MRI examinations.
The purpose of our study was to evaluate the accuracy of real-time MRI T1-based treatment monitoring during LITT for predicting the necrotic volume. In addition, we investigated the amount of energy necessary to induce a defined necrotic area within the different liver segments. Furthermore, regression of the necrosis at 3, 6 and 12 months after the procedure was determined.
Materials and methods
Patient selection and study design
The LITT treatment protocol and study design were approved by the local ethics committee and written informed consent was obtained from all patients. In this prospective study we included patients scheduled for LITT treatment of liver metastases between April 2008 and April 2009. Exclusion criteria were poor performance status (Karnofsky status of ≤70%), nutritional impairment, presence of neoplastic ascites, extrahepatic tumour spread, a high serum total bilirubin level (>3 mg/dL (51.3 μmol/L)), poor hepatic synthesis (serum albumin level of <2.0 mg/dL (20 g/L)), or renal failure (serum creatinine level of >2 mg/dL (176.8 μmol/L)). Further exclusion criteria were cardiovascular or respiratory failure, incorporated ferro-magnetic devices incompatible with 1.5T MRI, breast feeding or pregnancy. Patients were also excluded if more than five metastases were detected or any lesion was larger than 5 cm in diameter.
Planning and initiation of LITT
The LITT procedure was performed by two interventional radiologists, each with more than 10 years of experience in interventional radiology. After administration of intravenous anaesthetic (pethidine 10–80 mg, Dolantin, Aventis, Frankfurt, Germany) and a single dose of prophylactic antibiotics (cefuroxime 1.500 mg, Cefuroxim Fresenius, Fresenius, Bad Homburg, Germany) the injection site was infiltrated with local anaesthetic (1% mepivacain 20–30 mL, Scandicain, AstraZeneca, Wedel, Germany).
CT-guidance was used to allow for exact delineation of the tumour tissue and the surrounding anatomy while inserting a 9-F introducer sheath (Somatom Volume Zoom 4, Siemens, Forchheim, Germany) into the tumour. A laser application kit (SOMATEX, Teltow, Berlin, Germany) was used for positioning of the laser fibres according to Seldinger’s technique [Citation15]. After positioning of the laser fibres, all patients were transferred to a 1.5T MRI (Magnetom Avanto, Siemens) to perform the MRI studies during the LITT procedure.
Monitoring and controlling
LITT was performed using a Nd:YAG laser (Dornier MediLas 5100 Fibertom, Germering, Germany) with a wavelength of 1064 nm and a power of 12.8 W/cm. Before the treatment, positioning of the sheaths was verified via MRI on axial and coronal planes (fast low-angle shot (FLASH) sequences, echo time (TE) 4.8 ms, repetition time (TR) 119 ms, flip angle (FA) 90°, field of view (FOV) 309 × 380 mm2, matrix 256 × 179, acquisition time 2 s/slice, slice thickness 6 mm) (). Real-time T1-based treatment monitoring images were acquired every minute during the LITT procedure on axial and coronal planes parallel to the laser fibres using the same MRI sequence settings. Progress of the ablation was monitored according to the advance of the signal loss based on the longitudinal relaxation time (T1) shift [Citation16]. The duration of ablation and the pull-back procedure were calculated individually based on the susceptibility of the malignant tissue estimated based on T1 monitoring (). The completion of ablation was defined as the state of full signal loss in the intended ablation zone with an adequate safety margin of 5 mm circumferential diameter.
Figure 1. (A) T1-weighted gradient echo (GRE) sequence in the coronal plane to verify sheath position after CT-guided insertion of laser fibres before LITT procedure (FLASH, TE/TR 4.8/119, FA 90°, TA 2 s). Magnetic artefacts are caused by a magnetic marker inside the applicator system to enable a sufficient verification of the position. (B) MRI obtained after removal of the magnetic markers demonstrates the hypointense metastasis from a sarcoma in segment 4b with two laser fibres inserted.
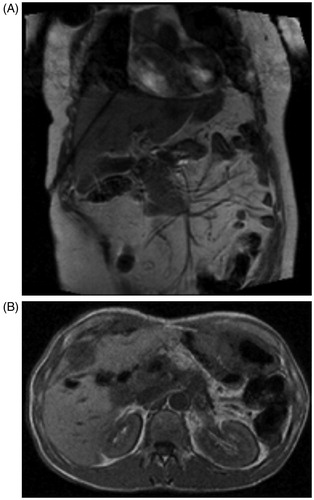
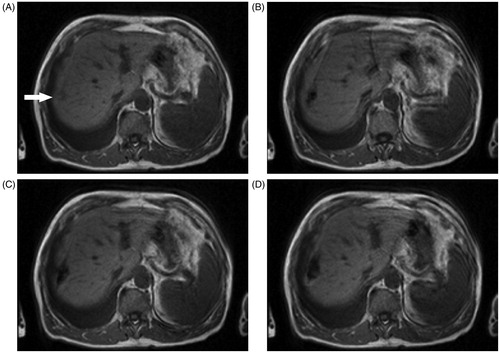
Figure 2. Display of progress of LITT treatment in a 69-year-old patient with liver metastasis from colorectal cancer in segment 8. (A) The T1-weighted axial GRE sequence (FLASH, TE/TR 4.8/119, FA 90°, TA 2 s) shows the metastasis (arrow) before LITT after removal of the magnetic marker between the laser fibres. (B) T1-weighted GRE sequence (same settings) shows the laser fibres 2 min after the start of the LITT procedure. An ellipsoidal-shaped area of hypointensity can be demarcated according to thermal damage. (C) MRI obtained with the same settings after 4 min of ablation. The area of coagulation is enlarging. (D) Image obtained after 9 min: necrosis manifests and an area with a total signal loss can be demarcated.
After removal of the LITT device, the puncture tract was occluded with fibrin glue (Tissucol Duo S; Baxter, Unterschleissheim, Germany). Post-interventional contrast-enhanced gradient echo (GRE) MRI (0.1 mmol/kg body weight, of gadopentetate dimeglumine (Magnevist, Schering, Berlin)) with the same settings was performed for further evaluation and as a baseline for upcoming follow-up examinations. After a post-procedural monitoring period of 6 h (blood pressure, heart rate and regular clinical examinations) patients were discharged.
Patients underwent a follow-up contrast-enhanced MRI 24 h later using half-Fourier acquisition single-shot turbo spin-echo (HASTE) and FLASH sequences in order to assess the final coagulation volume. FLASH sequences were performed as described above, HASTE sequences were acquired in coronal orientation (TE 82 ms, TR 900 ms, FA 150°, FOV 415 × 450 mm2, matrix 256 × 224, acquisition time 1 s/slice, slice thickness 6 mm) and transversal orientation (TE 101 ms, TR 1000 ms, FA 150, FOV 295 × 380 mm2, matrix 320 × 186, acquisition time 1 s/slice, slice thickness 6 mm).
Evaluation and follow-up
Two radiologists (with more than 2 and 15 years of experience in the field of abdominal MRI, respectively) evaluated the lesion volume before and after LITT. To determine a predictable value of the necrotic volume, we compared the volume of the areas with a hypointense signal up to a complete signal loss to the pre-interventional metastatic volume as well as to the lesion volume measured in the contrast-enhanced MRI directly after the LITT procedure.
The following peri-interventional volumes were quantified: lesion prior to treatment, volume obtained from the last available T1 monitoring image, volume determined in the gadolinium-enhanced MRI after the LITT procedure and the coagulation-zone 24 h later. All measurements were performed using FLASH-sequences for consistency. Volumes were measured manually based on the three greatest dimensions (x,y,z) using the ellipsoidal volume formula:
Contrast-enhanced follow-up MRI was performed 3, 6 and 12 months after LITT to assess changes in the volume of the necrosis zones.
Statistical methods
The arithmetic mean, minimum, maximum and standard deviation of all volumes were calculated. Correlation analysis (Pearson’s correlation) was used to compare the different volumes, graphically displayed in bar charts and scatter plots. For a better comparability of the scatter plots we used z-standardisation. To visualise the mean amount of energy needed during LITT in accordance with the previous diameters, a box plot diagram was generated. An error probability of p < 0.05 was considered to implicate a statistically significant difference. All results were analysed using SPSS version 14.0 (Chicago, IL).
Results
A total of 151 patients (60 male and 91 female) between 25 and 87 years of age (mean 60 years) were included. A total of 237 liver metastases were ablated with the use of 856 laser fibres. Patients included in this study were either suffering from metastases in both liver lobes (n = 77, 51%), had developed metastases in the remaining liver parenchyma after partial hepatectomy (n = 30, 20%), had contraindications for surgery (n = 25, 17%), suffered from unresectable (n = 1, 1%) or recurrent lesions (n = 1, 1%) or had refused hepatic surgery (n = 17, 11%).
Mean duration of the LITT procedures was 20 min (range 3–56 min). The total amount of energy used during a single LITT procedure varied from 6–225 kJ (mean 49 kJ, SD 35 kJ). The size of the treated metastases correlated significantly with the amount of energy used during ablation as metastases larger than 4 cm required an average of 100.81 kJ (). Furthermore, there were significant differences regarding the amount of energy applied per volume of treated metastases which corresponds to the segmental distribution within the liver (, ). The highest amount of energy was applied in segment 5 (mean 2.12 kJ/cm3) and 8 (mean 2.16 kJ/cm3), the lowest in segment 1 (mean 1.31 kJ/cm3).
Figure 3. Mean energy amount (kJ) applied according to the treated metastasis diameter.
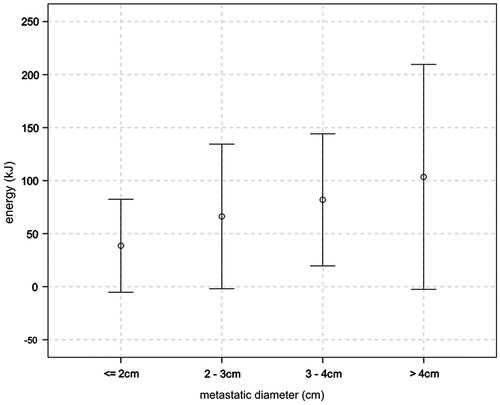
Figure 4. Mean values of the applied energy/volume (kJ/cm3) according to the segmental distribution of liver metastases treated with LITT.
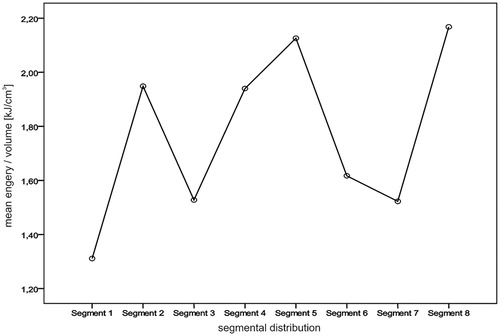
Table I. Amount of energy applied per volume of treated metastases during LITT.
The overall pre-ablative metastasis volume ranged from 0.5–51.94 cm3 (mean 1.99 cm3, SD 25.49 cm3). The volume measured in the last available T1 monitoring image varied from 0.78–120 cm3 (mean 26.25 cm3, SD 25.66 cm3). In the gadolinium-enhanced GRE sequence obtained immediately after LITT, the volume varied from 0.73–103.19 cm3 (mean 15.56 cm3, SD 18.83 cm3). In the MRI performed 24 h later the ablated volume ranged from 1.33–177.61 cm3 (mean 29.87 cm3, SD 29.77 cm3) (, ).
Figure 5. Comparison between the last MRI T1-based treatment monitoring image, contrast-enhanced MRI obtained immediately after LITT and the contrast-enhanced MRI obtained 24 h after the treatment. (A–C) A 57-year-old patient with a hepatic metastasis in segment 4b. (D–F) Liver metastasis from colorectal cancer in segment 8 from a 69-year-old patient. (A) and (D) T1 weighted GRE sequences (FLASH, TE/TR 4.8/119, FA 90°, TA 2 s) demonstrate imaging of the progress of LITT treatment just before the end of the ablation procedure. Although image A is affected by motion of the surrounding organs, signal loss can clearly be demarcated due to the thermally induced cell damage. (B) and (E) T1 weighted contrast-enhanced GRE sequences after LITT (FLASH, TE/TR 4.8/119, FA 90°, TA 2 s) depict an area of enlarging hypointensity; a slight benign peripheral enhancement according to the reactive tissue reaction can also be demarcated [Citation10]. (C) and (F) Contrast-enhanced T1 weighted GRE (FLASH, TE/TR 101/1000 ms, FA 150°, TA 1 s/slice) show an extended hyperintense coagulation zone. In both cases a reposition of the applicator was performed to maximise the ablation zone. (C) depicts a larger coagulation area due to the two laser fibres used during the treatment, whereas (F) shows a rather ellipsoid shaped area. The puncture track is still visible as a thin dark hypointensity within the necrotic area.
![Figure 5. Comparison between the last MRI T1-based treatment monitoring image, contrast-enhanced MRI obtained immediately after LITT and the contrast-enhanced MRI obtained 24 h after the treatment. (A–C) A 57-year-old patient with a hepatic metastasis in segment 4b. (D–F) Liver metastasis from colorectal cancer in segment 8 from a 69-year-old patient. (A) and (D) T1 weighted GRE sequences (FLASH, TE/TR 4.8/119, FA 90°, TA 2 s) demonstrate imaging of the progress of LITT treatment just before the end of the ablation procedure. Although image A is affected by motion of the surrounding organs, signal loss can clearly be demarcated due to the thermally induced cell damage. (B) and (E) T1 weighted contrast-enhanced GRE sequences after LITT (FLASH, TE/TR 4.8/119, FA 90°, TA 2 s) depict an area of enlarging hypointensity; a slight benign peripheral enhancement according to the reactive tissue reaction can also be demarcated [Citation10]. (C) and (F) Contrast-enhanced T1 weighted GRE (FLASH, TE/TR 101/1000 ms, FA 150°, TA 1 s/slice) show an extended hyperintense coagulation zone. In both cases a reposition of the applicator was performed to maximise the ablation zone. (C) depicts a larger coagulation area due to the two laser fibres used during the treatment, whereas (F) shows a rather ellipsoid shaped area. The puncture track is still visible as a thin dark hypointensity within the necrotic area.](/cms/asset/2faf9a24-83a6-4298-877a-42a156e12eb8/ihyt_a_854931_f0005_b.jpg)
Table II. Mean energy applied and resulting volumes (mean) compared to the metastatic diameter prior to LITT treatment.
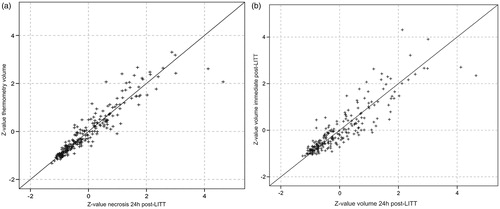
The peri-procedural ablation volume was larger than the original metastatic volume in all performed LITT procedures in order to obtain a sufficient safety margin of 5 mm circumferential diameter (). A full ablation was achieved in 98.73% (234/237) of all treated metastases. Correlation analysis revealed a strong correlation between the resulting volume of the necrotic tissue 24 h after LITT and the volume measured in the last available T1 monitoring image (r = 0.933; p < 0.001) as well as the volume measured in the contrast-enhanced GRE sequence directly after LITT (r = 0.888; p < 0.001).
Results from follow-up MRI examinations performed 3, 6 and 12 months after LITT regarding regression of coagulation zones are displayed in . Compared to the size of the treated metastases before ablation, mean measured volume had reduced by 46.63% after 3 months, by 65.85% after 6 months and by 72.11% after 1 year.
Table III. Mean measured volumes of ablated metastases during follow-up MRI.
Discussion
MRI–guided LITT is a percutaneous, minimally invasive technique to treat parenchymal and soft tissue tumours with low rates for major and minor complications [Citation17–19]. It has been proven to be a safe and efficient procedure for patients suffering from liver metastases and the initial number of metastases and their volume are the most important prognostic factors for patient outcomes [Citation20–22]. The present study demonstrates that real-time MRI T1 imaging is a reliable treatment monitoring technique during LITT. Our results show that there is a strong correlation between the volume measured on MRI T1-based treatment monitoring and the resulting coagulation necrosis measured 24 h after LITT with a narrower scatter range distribution compared to contrast-enhanced MRI performed directly after LITT (). MRI thermometry based upon longitudinal relaxation time T1 using FLASH sequences allows the interventional radiologist to predict the necrotic volume achieved as a result of LITT. It also has the potential to reduce the number of treatments necessary due to insufficient coverage of the coagulation zone. There was a significant variability regarding the amount of energy applied to generate a coagulation zone covering the entire tumour and a sufficient safety margin due to the segmental blood distribution of the liver. The highest energy level was used in segments 5 and 8, which was due to the heat-sink effect created by the venous drainage from the great hepatic vessels and hepatic portal fields [Citation8,Citation23]. Our results indicate that MRI T1-based treatment monitoring during LITT allows for visualisation of the coagulation necrosis and thus facilitates ablation of liver metastases even in segments prone to the heat-sink effect. Recent studies have demonstrated that a computational model of the bioheat transfer and model-based planning and real-time predictive control may further improve LITT treatment [Citation24,Citation25].
Figure 6. Correlation of necrosis volume measured 24 h after LITT with volume measured on contrast-enhanced MRI immediately after LITT (a), and MRI T1-based treatment monitoring during the ablation procedure (b). Z -standardisation demonstrates a narrowed scatter range of values on correlation of MRI T1-based treatment monitoring with MRI 24 h after LITT (b).
LITT offers various technical advantages over RFA. Compared to RFA, the catheter system and laser fibres for LITT are completely MRI compatible as the fibres do not interfere with the MRI signal. Large image artefacts caused by electromagnetic interferences deteriorate accuracy and validity of MRI thermometry during RFA [Citation18]. Additionally, several authors have reported high local recurrence rates for RFA treatment of tumours bigger than 3 cm in diameter [Citation26,Citation27] and centrally located tumours [Citation19] due to technical limitations such as restrictions in using multiple applicators in the same treatment and an undetected heat-sink effect [Citation20]. However, the mean survival rate after RFA has been reported to be comparable with survival after LITT (56 months versus 53 months) [Citation19,Citation21] and several initial studies demonstrated that using MRI-guided RFA along with MRI-compatible RFA systems can improve the outcome even further [Citation12,Citation26].
MWA is the most recent development in the field of local ablative techniques. Since the procedure provides a form of high frequency electromagnetic radiation (between 900 mHz and 2.45 gHz) and heat is actively produced, it is not affected by circumstances leading to electrical isolation, in contrast to RFA [Citation20]. Although it is claimed to have the ability to overcome the heat-sink effect, real-time monitoring during MWA via ultrasound is suboptimal due to gas artefacts caused by tissue vaporisation [Citation26–28]. This could be responsible for the high local tumour recurrence rate (9.6%) reported for MWA of liver metastases [Citation27]. Hompes et al. demonstrated a highly variable and suboptimal ablation diameter of metastatic liver tumours after single-probe MWA [Citation28]. Further studies and technical improvements are necessary to overcome these limitations, especially for treatment of small metastatic lesions.
The results of our study indicate that real-time MRI T1-based treatment monitoring with a follow-up MRI study 24 h after LITT allows for precise prediction and control of the resulting coagulation necrosis. Follow-up imaging is usually performed 4–6 weeks after ablative treatments [Citation2,Citation26,Citation29] which may lead to an underestimation of the size of the necrosis zone as regression could have already occurred. The resulting thermal damage induces an increase of the cytotoxic activity of T-cells within 4 weeks after LITT, and thermally altered tumour antigens are more likely to be phagocytosed [Citation30]. Furthermore, our results support the hypothesis that heat-induced cellular apoptosis may still be in progress during MRI performed immediately after ablation, thus leading to an underestimation of the coagulation zone [Citation30]. Detailed histopathological comparisons in previous animal studies confirmed a progress of ongoing coagulation in an inner white zone and surrounding red zone after RFA treatment [Citation12].
A limitation of our study is the non-randomised patient selection. In addition, our results were not compared with macroscopic or histopathological findings, as additional surgical procedures to remove the coagulated tissue were considered unethical and were thus omitted. Furthermore, several techniques for peri-procedural MRI monitoring of LITT exist. In this study we evaluated the T1 longitudinal relaxation time method as it is established in our routine workflow as it allows for fast image acquisition, immediate detection of haemorrhagic zones under the intervention, and the loss in signal corresponds with the completion of the ablation procedure. However, several authors have demonstrated that the proton-resonance-frequency method may be a promising alternative for MRI treatment monitoring [Citation16,Citation31]. A comparison evaluation of both techniques should be subject to further studies.
Conclusion
In conclusion, MRI treatment monitoring using T1 weighted GRE FLASH sequences shows a strong correlation with the necrotic volume 24 h after LITT. As it provides reliable identification and demarcation of coagulation necrosis, it can facilitate control of the ablation procedure and should be routinely applied to LITT treatment.
Declaration of interest
The authors report no conflicts of interest. The authors alone are responsible for the content and writing of the paper.
Acknowledgements
The authors thank Zsuzsanna T. Varga, PhD, for her assistance in editing the manuscript.
References
- Qian J. Interventional therapies of unresectable liver metastases. J Cancer Res Clin Oncol 2011;137:1763–72
- Vogl TJ, Straub R, Zangos S, Mack MG, Eichler K. MR-guided laser-induced thermotherapy (LITT) of liver tumours: Experimental and clinical data. Int J Hyperthermia 2004;20:713–24
- Kim HR, Cheon SH, Lee K, Ahn JR, Jeung H, Lee SS, et al. Efficacy and feasibility of radiofrequency ablation for liver metastases from gastric adenocarcinoma. Int J Hyperthermia 2010;26:305–15
- Rempp H, Voigtländer M, Schenk M, Enderle MD, Scharpf M, Greiner TO, et al. Internally gas-cooled radiofrequency applicators as an alternative to conventional radiofrequency and microwave ablation devices: An in vivo comparison. Eur J Radiol 2013;82:350–5
- Rempp H, Hoffmann R, Roland J, Buck A, Kickhefel A, Claussen CD, et al. Threshold-based prediction of the coagulation zone in sequential temperature mapping in MR-guided radiofrequency ablation of liver tumours. Eur Radiol 2012;22:1091–100
- Meister D, Hübner F, Mack M, Vogl TJ. MR thermometry for laser-induced thermotherapy at 1.5 Tesla. Rofo 2007;179:497–505
- Puls R, Stroszczynski C, Gaffke G, Hosten N, Felix R, Speck U. Laser-induced thermotherapy (LITT) of liver metastases: MR-guided percutaneous insertion of an MRI-compatible irrigated microcatheter system using a closed high-field unit. J Magn Reson Imaging 2003;17:663–70
- Huang J, Li T, Liu N, Chen M, He Z, Ma K, et al. Safety and reliability of hepatic radiofrequency ablation near the inferior vena cava: an experimental study. Int J Hyperthermia 2011;27:116–23
- Whelan WM, Wyman DR, Wilson BC. Investigations of large vessel cooling during interstitial laser heating. Med Phys 1995; 22:105–15
- Goldberg SN, Grassi CJ, Cardella JF, Charboneau JW, Dodd GD, Dupuy DE, et al. Image-guided tumor ablation: Standardization of terminology and reporting criteria. J Vasc Interv Radiol 2009;20:377–90
- Clasen S, Pereira PL. Magnetic resonance guidance for radiofrequency ablation of liver tumors. J Magn Reson Imaging 2008;27:421–33
- Seror O, Lepetit-Coiffé M, Le Bail B, de Senneville BD, Trillaud H, Moonen C, et al. Real time monitoring of radiofrequency ablation based on MR thermometry and thermal dose in the pig liver in vivo. Eur Radiol 2008;18:408–16
- Lepetit-Coiffé M, Laumonier H, Seror O, Quesson B, Sesay M, Moonen CTW, et al. Real-time monitoring of radiofrequency ablation of liver tumors using thermal-dose calculation by MR temperature imaging: Initial results in nine patients, including follow-up. Eur Radiol 2010;20:193–201
- Streitparth F, Knobloch G, Balmert D, Chopra S, Rump J, Wonneberger U, et al. Laser-induced thermotherapy (LITT) – Evaluation of a miniaturised applicator and implementation in a 1.0-T high-field open MRI applying a porcine liver model. Eur Radiol 2010;20:2671–8
- Seldinger SI. Catheter replacement of the needle in percutaneous arteriography; A new technique. Acta radiol 1953;39:368–76
- Lüdemann L, Wlodarczyk W, Nadobny J, Weihrauch M, Gellermann J, Wust P. Non-invasive magnetic resonance thermography during regional hyperthermia. Int J Hyperthermia 2010;26:273–82
- Vogl TJ, Müller PK, Hammerstingl R, Weinhold N, Mack MG, Philipp C, et al. Malignant liver tumors treated with MR imaging-guided laser-induced thermotherapy: technique and prospective results. Radiology 1995;196:257–65
- Boss A, Graf H, Müller-Bierl B, Clasen S, Schmidt D, Pereira PL, et al. Magnetic susceptibility effects on the accuracy of MR temperature monitoring by the proton resonance frequency method. J Magn Reson Imaging 2005;22:813–20
- van Tilborg AAJM, Meijerink MR, Sietses C, van Waesberghe JHTM, Mackintosh MO, Meijer S, et al. Long-term results of radiofrequency ablation for unresectable colorectal liver metastases: A potentially curative intervention. Br J Radiol 2011;84:556–65
- Rocha FG, D'Angelica M. Treatment of liver colorectal metastases: Role of laparoscopy, radiofrequency ablation, and microwave coagulation. J Surg Oncol 2010;102:968–74
- Vogl TJ, Straub R, Eichler K, Söllner O, Mack MG. Colorectal carcinoma metastases in liver: laser-induced interstitial thermotherapy – Local tumor control rate and survival data. Radiology 2004;230:450–8
- Vogl TJ, Freier V, Nour-Eldin NA, Eichler K, Zangos S, Naguib NNN. Magnetic resonance-guided laser-induced interstitial thermotherapy of breast cancer liver metastases and other noncolorectal cancer liver metastases: An analysis of prognostic factors for long-term survival and progression-free survival. Invest Radiol 2013;48:406–12
- Frericks BB, Ritz JP, Albrecht T, Valdeig S, Schenk A, Wolf K, et al. Influence of intrahepatic vessels on volume and shape of percutaneous thermal ablation zones: In vivo evaluation in a porcine model. Invest Radiol 2008;43:211–18
- Fuentes D, Walker C, Elliott A, Shetty A, Hazle JD, Stafford RJ. Magnetic resonance temperature imaging validation of a bioheat transfer model for laser-induced thermal therapy. Int J Hyperthermia 2011;27:453–64
- Feng Y, Fuentes D. Model-based planning and real-time predictive control for laser-induced thermal therapy. Int J Hyperthermia 2011;27:751–61
- Will K, Krug J, Jungnickel K, Fischbach F, Ricke J, Rose G, et al. MR-compatible RF ablation system for online treatment monitoring using MR thermometry. Conf Proc IEEE Eng Med Biol Soc 2010;2010:1601–4
- Lorentzen T, Skjoldbye BO, Nolsoe CP. Microwave ablation of liver metastases guided by contrast-enhanced ultrasound: experience with 125 metastases in 39 patients. Ultraschall Med 2011;32:492–6
- Hompes R, Fieuws S, Aerts R, Thijs M, Penninckx F, Topal B. Results of single-probe microwave ablation of metastatic liver cancer. Eur J Surg Oncol 2010;36:725–30
- Rempp H, Clasen S, Boss A, Roland J, Kickhefel A, Schraml C, et al. Prediction of cell necrosis with sequential temperature mapping after radiofrequency ablation. J Magn Reson Imaging 2009;30:631–9
- Vogl TJ, Wissniowski TT, Naguib NNN, Hammerstingl RM, Mack MG, Münch S, et al. Activation of tumor-specific T lymphocytes after laser-induced thermotherapy in patients with colorectal liver metastases. Cancer Immunol Immunother 2009;58:1557–63
- Kickhefel A, Rosenberg C, Roland J, Viallon M, Gross P, Schick F, et al. A pilot study for clinical feasibility of the near-harmonic 2D referenceless PRFS thermometry in liver under free breathing using MR-guided LITT ablation data. Int J Hyperthermia 2012;28:250–66