
Abstract
Purpose: This paper investigated the effects of thermal ablation treatment on imaged X-ray computed tomography (CT) Hounsfield units (HU), for the purpose of monitoring tissue denaturation and coagulation.
Materials and methods: Eight phantoms of water, oil, and chicken serum albumin as well as 15 ex vivo tissue samples were heated by applying high intensity focused ultrasound (HIFU) for 10 to 29 min to obtain denaturation temperatures, (i.e. >50 °C). X-ray CT scanning was performed simultaneously during heating and post-ablation cooling stages, and the HU at the focal zone were registered. The temperature profile versus time was also monitored under similar conditions using a thermocouple probe. The results were plotted and correlated as curves of HU versus temperature.
Results: In all specimens studied, HU values depicted an exponential curve as a function of temperature during the heating stage. However, linear behaviour was observed during the cool-down stage for both chicken serum albumin and ex vivo bovine liver. Thus, a hysteresis phenomenon occurred only when the thermal conditions induced irreversible changes in the sample with quantification demonstrating high correlation with the maximal temperature reached during treatment (R2 > 0.9) for the chicken serum albumin.
Conclusions: Our results demonstrate a HU–temperature hysteresis phenomenon for HIFU ablation, which is detectible by X-ray CT. This hysteresis is related to the amount of heat induced into the tissue and could potentially indicate irreversible tissue damage. Accordingly, this measurable phenomenon can be utilised as a quantitative method for non-invasive monitoring of thermal ablation.
Introduction
In recent years, thermal ablation treatments for tumour therapy and other clinical applications have gradually become more and more prevalent [Citation1,Citation2]. Today there are a variety of thermal energy sources such as radiofrequency (RF), microwave (MW), LASER, and high intensity focused ultrasound (HIFU), which allow minimally invasive or non-invasive selective tissue ablations.
For efficient treatment, and also for safety reasons, some form of monitoring to provide confidence of the target location and ablation size is mandatory in these procedures. Furthermore, such monitoring capability can lead to optimisation of treatment time, energy deposition levels and ablation dimensions. Thus, such information would be helpful in avoiding situations where the tissue is insufficiently ablated (i.e. undertreated) or inducing thermal overdose or vaporisation that might damage healthy tissues around the target (i.e. overtreatment). Since tumours may be located in sensitive areas and since heating can take from a few seconds to minutes until reaching temperatures above the denaturation/coagulation temperature, the monitoring system must have high spatial as well as high temporal resolution. Non-invasive monitoring is of course the most desired option. However, it poses a technical challenge since real-time thermal information and tracking of changes within the tissue need to be obtained as well.
Currently MRI is the most common image modality used for thermal monitoring of HIFU treatments [Citation3–7]. Ultrasound is also used for such purpose [Citation8], and new monitoring methods by theoretical models are being examined [Citation9,Citation10]. X-ray computed tomography (CT) is an imaging modality that is much more common and affordable than magnetic resonance imaging (MR) and in many cases offers a superior image quality compared to ultrasound. This is particularly true when the target is partially obscured by a bone or the lungs. Therefore, the widespread X-ray CT might serve as a guiding imaging modality and may potentially be beneficial for monitoring ablation treatments.
Changes of HU intensity stemming from temperature changes are already known [Citation11–17] but additional information regarding the condition of the tissue, such as the extent of protein denaturation/coagulation would be desirable for improved and accurate monitoring of tissue condition during ablation. One potential source of additional information from the CT imaging may be obtained by investigating non-linear effects in HU, which are potentially related to irreversible ablative changes in the tissue.
Accordingly, the aim of this study was to explore the potential of X-ray CT to serve as an imaging tool for non-invasive ablation monitoring. Specifically, here we report upon and quantify a hysteresis phenomenon. Hysteresis stems from system dependence, not only on its current state and conditions, but also on its previous state and previous conditions. This dependence is noted when a system can have more than a single state, under the same conditions. The hysteresis phenomenon is manifested as the discrepancy of HU values for the same temperature during heating and cooling of the tissue, seen only when denaturation/coagulation of the tissue occurs, in this study.
Materials and methods
Twenty-three phantoms were examined during this study. This included: (1) four phantoms of water and oil, (2) four phantoms of chicken serum albumin and (3) 15 ex vivo tissue samples. Heating was implemented by applying non-focused and focused ultrasonic energy. X-ray CT scanning was performed simultaneously during heating and post-ablation cooling stages. The mean HU within a selected region of interest (ROI) was then calculated and plotted versus time. The temperature profile versus time was also monitored under identical heating conditions using a thermocouple probe. Finally, the results were integrated and plotted as curves of HU versus temperature.
All of the experiments were performed on a single source dual-energy Multi-Slice CT machine (Philips Healthcare, Cleveland, OH). The full spectrum CT images were used for the analysis. All axial scans during the experiments were obtained with the same scanning parameters: tube voltage 120 kVp, tube current 500 mA, scan coverage 2 cm, reconstructed slice thickness 2.5 mm, rotation time 1 s per rotation, scan resolution standard, reconstruction filter B (standard), image matrix size 5122 pixels, image field of view 250 mm. These scanning parameters are commonly used in clinical applications such as biopsies and ablations [Citation18], with a high current which was chosen in order to improve SNR.
Phantom studies
Experimental set-up
Distilled water and canola cooking oil were placed in a closed small cylinder, 11 cm long, and 5 cm diameter. At one end of the cylinder, an ultrasonic physical-therapy transducer (Mettler Electronics Sonicator 730, Anaheim, CA) was inserted. At the other end a plastic cylinder that sealed the cylinder was inserted as illustrated in . Due to the liquid state of the water and oil phantoms at room temperature, it is impractical to heat them with focused ultrasound due to acoustic streaming. Hence, the heating was uniformly induced by a non-focused ultrasonic physiotherapy device, which heated the phantom continuously.
Figure 1. The experimental set-up used for the phantom experiments. (A) The assembly used for the liquid experiments. (B) The assembly used for the chicken serum albumin experiments. (C) The positioning of the assembly on the CT table.
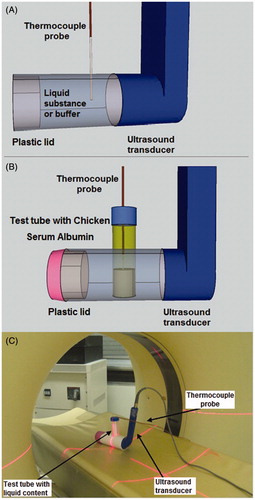
To limit interference between the ultrasound electronic noise and the CT machine or the thermocouple measurements, the ultrasonic generator was placed outside the scanner room (in the console room) far from the scanner. The electric signals were transmitted via a shielded coaxial cable, and the piezo-electric element was outside the scanning field of view. A 0.5 mm thermocouple probe (TJC36-CPSS-020U-6-SMP-M, OMEGA Engineering, Manchester, UK) was placed inside through a pinhole to measure and record the temperature (TC-08 Picolog, Pico Technologies, St Neots, UK). Temperature sampling was acquired at 1 s time intervals between acquisitions. The assembly was placed on top of the CT table as shown in . The cylinder was positioned perpendicular to the axial image plane so that the image captured a section of the cylinder, far enough from the ultrasound transducer metallic edge. With this configuration, heat dissipation was mostly along the wave propagation direction and uniform across the axial CT slice (which as noted was taken perpendicular to that direction).
Given that in many soft tissues, and especially tumours, the water content is approximately 80–90% [Citation19] and the rest is mainly protein, a mixture of distilled water and 16% chicken serum albumin was then tested (albumin from chicken egg white, grade II, Sigma-Aldrich, Germany); 25 mL of the mixture was placed inside a 50-mL poly centrifuge test-tube that was then inserted into a larger cylinder containing a liquid 96% ethanol buffer as illustrated in . The ultrasonic beam heated the liquid buffer, which in turn heated the smaller test tube and its content. A thermocouple probe was inserted into the protein test tube, and the temperature was measured and recorded with the Picolog system. The system was placed on top of the CT in the same manner as the previous experiment ().
Experimental procedure
The ultrasonic applicator was activated for 20 to 29 min. The scans were taken automatically every 20 s for the first 20 min, during the heating stage, and every 29 s afterwards through the rest of the heating stage and during the cool-down stage. Temperature acquisition time and image acquisition time were synchronised in order to match between simultaneous scans and temperature measurements.
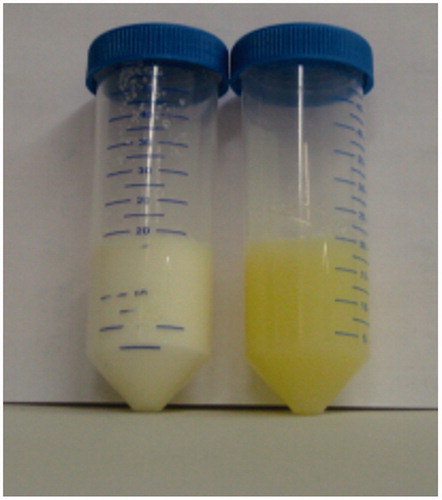
For the chicken serum albumin mixture experiments, in the cases where the mixture was heated above the denaturation temperature, it was possible to observe the typical ‘hard-boiled egg’ opacification effect () that indicated that sufficient heating was applied to the mixture to induce denaturation and coagulation.
Figure 2. A pair of test tubes containing chicken serum albumin solutions, heated beyond the denaturation temperature (left) and a raw mixture (right).
Data analysis
The CT slice closest to the thermocouple tip, but without it showing (so that it would not add image artefacts) was analysed. A square ROI of 25 (5 × 5) pixels was chosen to calculate the mean HU value. A graph of the HU versus temperature was then generated and a corresponding curve fit was calculated separately for each of the stages, heating and cooling.
Accounting for the trends in the observed results, non-linear and linear curves were fitted to the heating stage and the cooling stages for each of the samples in an attempt to achieve the greatest goodness of fit.
Given that the heat-up and cool-down phases produced exponential and linear curves respectively, three approaches for quantifying the obtained hysteresis were implemented, yielding curve feature indices:
Calculation of the enclosed region by the pairing of the fitted non-linear (heat-up) curve and linear (cool-down) curve.
Measurement of the total difference in HU values, between minimal and maximal HU values, which is the total HU range during heat-up and cool-down.
Measurement of the maximum disparity between HU values for the same temperature, measured once during heat-up, and once during cool-down.
The indices obtained were later correlated with the maximal temperature reached.
Ex vivo bovine liver experiments
Experimental set-up
Heating was accomplished using the ultrasonic thermal therapy device (Mettler Electronics Sonicator 730, Anaheim, CA). The ultrasonic generator was placed far from the CT scanner, and a shielded coaxial cable was used to prevent any electronic interference (as described above). The device was set for continuous wave transmission and was operated with 3 MHz frequency and a 5 cm2 applicator that was set to an intensity of 4.5 W.
A concave acoustic lens was mounted on top of the transducer, in order to generate the focused HIFU beam.
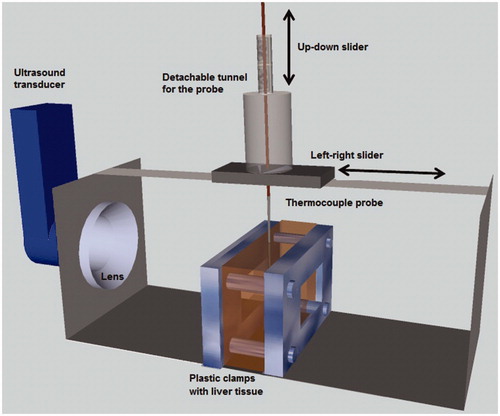
A specially designed apparatus was used to position the tissue in such way that the HIFU focus during ablation is at the middle of the specimen, as illustrated in . A polycarbonate and Plexiglas open box was designed to set the HIFU lens in place in one of the walls. A ‘bridge’ between the lens wall and its opposite wall enabled the horizontal movement of the thermocouple above the ultrasonic beam centre line (the line between the focus of the HIFU to the lens centre) on a detachable guiding element that holds the thermocouple. The guiding element had a ratchet wheel that allowed precise vertical motion of a conductor for the thermocouple that could be retracted, leaving only the thermocouple inside the tissue specimen. This enabled the accurate positioning of the thermocouple tip at the HIFU focal zone.
Figure 3. A schematic depiction of the apparatus used for the bovine ex vivo liver experiments. The HIFU beam was transmitted from the left side and its focus located at the central zone of the specimen.
Experimental procedure
Inside the Plexiglas apparatus a specimen of fresh bovine liver (2 cm thickness, 15 cm width and 8 cm height), after massaging and degassing (to reduce the occurrence of acoustic cavitation by the HIFU), was placed in front of the lens, at such a distance that the focus would be in mid-depth of the block (see ). A small pair of Plexiglas frames made of two plates of 8 cm height and width, with a rectangular opening of 4 cm height and 3 cm width at the middle, were used to clamp the liver piece and hold it in place. This clamping ensured the liver stayed in place during the procedure, reducing and/or eliminating potential motion error.
The tissue was submerged in water and a needle thermometer probe was inserted as close to the HIFU focal position as possible. The tissue was then heated with the HIFU while the thermometer measured the temperature in 1-s time intervals during the heating and cooling (after turning off the HIFU) process. When the cooling stage was completed, the tissue was moved laterally by about 1.5 cm, so it would remain at the same distance from the HIFU as before, but with a fresh, untreated area facing the HIFU beam. This new location of the tissue was now heated and cooled under the same conditions, this time without the thermocouple so as to avoid image artefacts. After slicing the specimen at the end of the procedure it was possible to observe two distinct ablated (‘white’) areas in the specimen.
Reference temperature measurements, as well as a reference X-ray CT image, were taken before the beginning of the sonication process, to serve as a baseline for the HU changes in the heating and cooling stages that followed.
The activation time of the HIFU and all the X-ray CT scans were time registered to enable matching the correct temperature measurement to its synchronised scan accurately, thereby facilitating analysis of the results.
Two sets of experiments were conducted. One set was conducted with an induced high accumulated thermal dose, where the HIFU was activated for 29 min. During the second set, lower thermal dose was induced, where the HIFU was activated under the same conditions but for 10 min only.
Data analysis
Temperature–HU relationship
The aim of the applied analysis was to integrate the HU–time profile and temperature–time profile. This analysing of the temperature–HU dependency curves established the relation between the changing HU values as a function of the changed temperature.
To reduce noise levels, the obtained CT images were initially filtered with a median filter using 5 × 5 pixels window. Then, based upon the last image taken during the heating process (corresponding to the highest temperature) a contour analysis was implemented. It defined an ROI that enclosed a specific HU level around the focal spot. That particular ROI was used on all of the slices in the set for calculating the mean value of the HU. This process was performed on each liver specimen separately to acquire a HU versus time curve.
Following this stage, an average of the individually plotted HU versus time curves was generated as well as an average of the temperature versus time curve. This procedure was applied separately for the higher and lower thermal dose experiments. The curves were then integrated in order to obtain the HU versus temperature curves for the higher thermal dose experiments and for the lower thermal dose experiments. Finally, for each data set the heating phase was approximated by an analytical non-linear (exponential) function using a least squares regression model, while the cooling stage was approximated by linear regression. Analysis of the three hysteresis indices (see above) was then applied to the analytical curves.
Results
HU–temperature curves
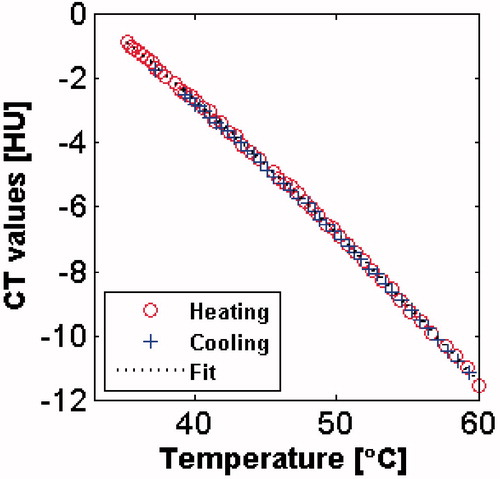
The HU–temperature measurements obtained for water are presented in . The measured values were fitted to an exponential curve that had yielded very strong correlation R2 > 0.99. No hysteresis was observed for water, as HU values during cooling overlapped the values observed during heating.
Figure 4. The CT Hounsfield unit values measured for water as a function of temperature during heating and cooling. The obtained results highly correlate with the exponential fit.
The obtained HU–temperature measurements for oil are presented in . As can be noted, no hysteresis is observed between the heating and cooling measurements. The high fluctuation observed in this case during the heating process is presumably attributed to the fact that the phantom was not attached firmly enough to the scanner table, hence may have moved or vibrated, due to the application of the ultrasound.
Figure 5. The CT Hounsfield unit values measured for oil during heating and cooling.
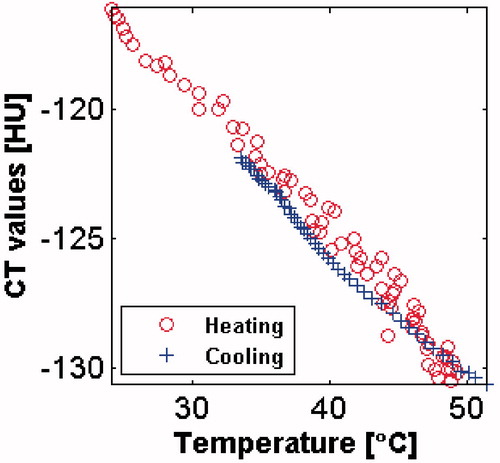
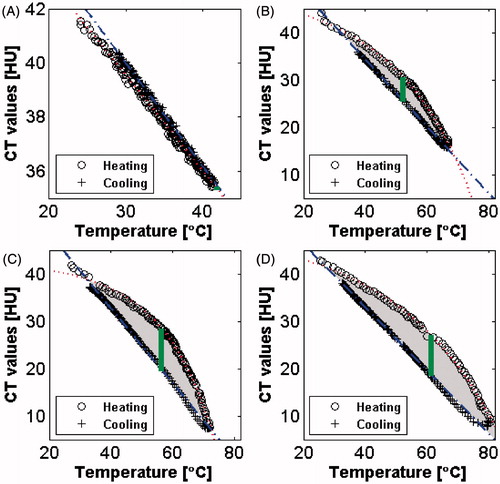
A substantially different picture was revealed for the results obtained for the chicken serum albumin experiments. As can be seen in , when the maximal temperature reached was below the denaturation temperature (approximately 43 °C [Citation20]), both heating and cooling curves depicted an overlapping behaviour and no significant hysteresis was noted (). However, when exceeding this temperature, and when coagulation was noted (see ), hysteresis was clearly observed. The HU value dropped from its initial value along a curved convex trajectory. This trajectory was approximated by an exponential function:
where HU(T) and HUref are the instantaneous and reference HU values respectively, T is the temperature, and c0, c1, and c2 are fitting constants.
Figure 6. CT Hounsfield unit values measured for chicken serum albumin vs. temperature for four different heating conditions. The enclosed area and maximal disparity, at the matching temperature, are marked by the shaded area and the vertical line respectively. As can be noted there is no hysteresis when the maximal temperature is below 43 °C.
This function produced the highest correlation coefficients with the measured results (R2 > 0.99 for all four cases) compared to several other analytical models for describing the non-linear trajectory observed during heat-up. When the HIFU was turned off and cooling occurred, the HU returned to their initial value along a totally different and linear trajectory, (R2 > 0.99 for all four cases). When calculating the three indices of hysteresis for each of the experiments, it was observed that the hysteresis was more prominent as the accumulated thermal dose (also reflected by the maximal temperature reached) was increased. This is quantitatively shown in .
Table I. Summary of the three hysteresis quantification indices utilised for the chicken serum albumin.
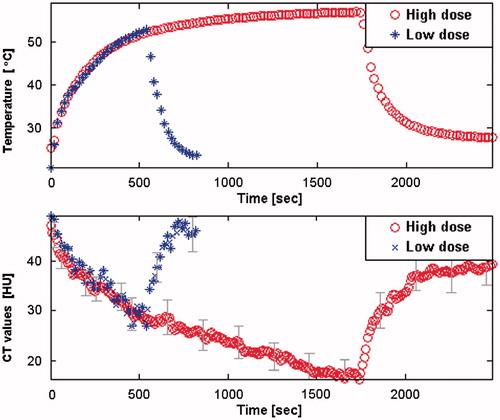
Two representative curves depicting together the temperature and HU versus time for both high and low thermal doses in ex vivo liver are shown in . It can be noted that up to the common time of heating, i.e. 10 min, the curves are similar, indicating the reproducibility of the curves.
Figure 7. Exemplary data sets for temperature vs. time (top) and HU vs. time (bottom), for both low and high thermal doses registered for ex vivo bovine liver experiments during heating and cooling stages. The error bars represent the standard deviation around the average value.
The curves of HU versus temperature for both high and low thermal doses are depicted in (A and B respectively). Again, an exponential trajectory was noted during heat-up (R2 = 0.97 and R2 = 0.90 for high and low thermal dose curves respectively). Contrary to the exponential fit, and as was noted for chicken serum albumin, the cooling stage is essentially linear (R2 > 0.96 for both cases) and is characterised by lower HU values compared to the heating stage. Hysteresis is again noted, becoming much more significant when the thermal dose is higher. The corresponding three hysteresis indices are presented in .
Figure 8. Ex vivo liver tissue HU values vs. temperature, for the high (A) and low (B) accumulated thermal dose. The enclosed area and maximal disparity, at the matching temperature, are marked by the shaded area and the vertical line respectively.
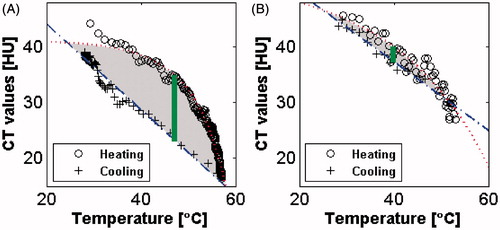
Table II. Summary of the three hysteresis quantification indices utilised for the ex vivo bovine liver experiments.
Discussion
In recent years thermal treatments have become more and more popular for the treatment of cancer [Citation21]. Yet one of the major obstacles associated with the implementation of such processes is thermal monitoring. This includes non-invasive assessment of temperature, tissue damage and ablation location and size. Today, MRI is the only FDA approved modality for non-invasive thermal ablation monitoring. However, MRI imposes several major constraints on its surroundings. Image distortion and artefacts resulting from metallic objects and susceptibility effects may be significant when using thermal ablation applicators. Additionally, effects stemming from the radiation of RF or microwave ablation devices may foist limits on the type of ablation energy source and equipment used and also on any auxiliary equipment required in such settings. Additionally, MRI is a very expensive imaging modality and not widely available for interventional clinical use.
Another imaging modality commonly used for image-guided ablation is ultrasound. The benefits of ultrasonic systems are their high temporal resolution, their availability, and their low cost. Still, ultrasound suffers from significant disadvantages, which include inferior image quality compared to MRI and CT, and limitations which arise from inability to image and treat with HIFU targets located behind overlying bones or structures containing gas, which obstruct the ultrasonic waves [Citation22,Citation23]. Additionally, for HIFU, the progressively increasing hyperechogenic focus, often seen surrounding the distal portion of an ablation treatment, during the delivery of thermal energy, most probably represents microbubbles of gas that form within the heated tissue and does not necessarily represent tissue coagulation [Citation24]. These microbubbles may also preclude the accurate use of ultrasound in many scenarios.
X-ray CT, on the other hand, is a widely available imaging modality that offers high temporal resolution combined with high spatial resolution. It is substantially less expensive than MRI and provides images which are superior to ultrasound. Moreover, it can also image the brain and lungs, which ultrasound cannot, and does not impose any restrictions on the ablation equipment located within its vicinity as MRI does. Hence, it can potentially be utilised as a quantitative method for non-invasive monitoring of thermal ablation.
Indeed, several investigators have examined the option of using CT for thermal monitoring [Citation17,Citation25–28]. These studies have attempted to use the HU values for determining temperature non-invasively. Beyond what has been previously reported, in our study a hysteresis phenomenon for the HU–temperature curve was detected during the heating and cooling stages of the process. The hysteresis occurred for both chicken serum albumin (above 43 °C) and for ex vivo bovine liver samples (above 53 °C). This phenomenon is characterised by the fact that for the same temperature two completely different HU values can be measured depending on the ongoing thermal process. If the measurement is taken during the heating stage, higher HU values will be observed as compared to values measured during the post-ablation cooling stage. The implication of this finding is very significant as it leads to the conclusion (at least for substances with properties similar to chicken serum albumin and bovine liver), that tissue temperature cannot be determined from the CT HU alone, but rather that the timing of such measurements in relation to the ablation will need to be taken into account as well.
Stemming from the above conclusion, quantitative hysteresis analysis is suggested here as a possible remedy to enable potential monitoring for X-ray CT-guided thermal treatment. In addition to serving for image guidance of an ablation device, the X-ray CT might be used to monitor the condition of the tissue during treatment in real time. This will require the acquisition of some images during the cooling process as well, in order to quantify the hysteresis. Nevertheless, since throughout this stage the HU–temperature trajectory is linear, only a couple of images may likely suffice. The limitations of such approach are naturally the exposure of the patient to X-ray radiation. A possible solution may be the implementation of new reconstruction techniques that substantially reduce X-ray levels [Citation29,Citation30], enabling acceptable levels for this ablation monitoring method. Clearly, further optimisation of the total number of scans and acquisition times is needed in order to make this procedure clinically applicable.
The results of this research provide strong indication that it could be the basis for the development of a clinical application for such use. As shown in , the hysteresis appears only when denaturation occurs. Moreover, as shown in and , and in and , the region enclosed by the hysteresis curve increases when the sonication time and the maximal temperature reached are increased, presumably indicating more extensive tissue damage. This may imply that the hysteresis region index may serve as a quantitative parameter to reflect the state of the heated substance.
It is important to note that for the liver, the maximal temperature for the high and low thermal dose was not significantly different (57 °C and 53 °C respectively). However, the enclosed region increased by 425%, indicating that it is not only the maximal temperature, but the accumulative thermal dose that counts. Hence, one can conceive that by mapping the hysteresis properties around the treated zone, non-invasive damage assessment may be obtained.
The observed hysteresis phenomenon may possibly be explained by attributing it to the non-linear changes in tissue density stemming from the ablation procedure. As recalled, when a substance becomes warmer, its density is commonly reduced. The amount of density reduction is determined by its thermal expansion coefficient [Citation31]. Moreover, the X-ray attenuation coefficient depends directly on the density [Citation32]. Hence, a change in density will result in a change in the observed HU.
Previous works have assumed that the thermal expansion coefficient remains constant during the heating process. This has led to the assumption that the HU are linearly related to the temperature [Citation27,Citation28,Citation33]. Contrary to that, our experimental results with chicken serum albumin and liver clearly demonstrate that during heat-up, when denaturation occurred, the measured HU values for each temperature are better approximated by an exponential curve with a very high correlation coefficient (R2 = 0.99, and 0.96 for chicken serum albumin and liver respectively) as compared to a linear regression model (R2 = 0.89, and 0.85 for chicken serum albumin and liver respectively). Presumably, this may be a manifestation of the irreversible changes that the proteins undergo when the ablation procedure progresses. Additional research into alternative ablation systems such as RF, MW and laser is needed to fully explore the clinical potential of this method.
In summary, using the suggested approach of quantifying the HU–temperature curve, hysteresis might possibly lead to a non-invasive method for detecting ablation and for providing a quantitative index for assessing the thermal damage induced in the tissue using X-ray CT.
Declaration of interest
The authors report no conflicts of interest. The authors alone are responsible for the content and writing of the paper.
References
- Goldberg SN, Gazelle GS, Mueller PR. Thermal ablation therapy for focal malignancy: A unified approach to underlying principles, techniques, and diagnostic imaging guidance. Am J Roentgenol 2000;174:323–31
- Feldman L, Fuchshuber P, Jones DB. The SAGES manual on the fundamental use of surgical energy (fuse). New York: Springer; 2012
- Huber PE, Jenne JW, Rastert R, Simiantonakis I, Sinn H, Strittmatter H, et al. A new noninvasive approach in breast cancer therapy using magnetic resonance imaging-guided focused ultrasound surgery. Cancer Res 2001;61:8441–7
- Vykhodtseva N, Sorrentino V, Jolesz FA, Bronson RT, Hynynen K. MRI detection of the thermal effects of focused ultrasound on the brain. Ultrasound Med Biol 2000;26:871–80
- Furusawa H, Namba K, Thomsen S, Akiyama F, Bendet A, Tanaka C, et al. Magnetic resonance-guided focused ultrasound surgery of breast cancer: Reliability and effectiveness. J Am Coll Surg 2006 7;203:54–63
- Coon J, Payne A, Roemer R. HIFU treatment time reduction in superficial tumours through focal zone path selection. Int J Hyperthermia 2011;27:465–81
- ter Haar G. High intensity focused ultrasound: Physical principles and devices. Int J Hyperthermia 2007;23:89–104
- Vaezy S, Shi X, Martin RW, Chi E, Nelson PI, Bailey MR, Crum LA. Real-time visualization of high-intensity focused ultrasound treatment using ultrasound imaging. Ultrasound Med Biol 2001;27:33–42
- Prakash P, Diederich C. Considerations for theoretical modelling of thermal ablation with catheter-based ultrasonic sources: Implications for treatment planning, monitoring and control. Int J Hyperthermia 2011;28:69–86
- Sommer CM, Sommer SA, Sommer WO, Zelzer S, Wolf MB, Bellemann N, et al. Optimisation of the coagulation zone for thermal ablation procedures: A theoretical approach with considerations for practical use. Int J Hyperthermia 2013;29:620--8
- Fallone BG, Moran PR, Podgorsak EB. Noninvasive thermometry with a clinical X-ray CT scanner. Med Phys 1982;9:715--21
- Cetas TC. Will thermometric tomography become practical for hyperthermia treatment monitoring? Cancer Res 1984;44:S4805–8
- Jenne JW, Bahner M, Spoo J, Huber P, Rastert R, Simiantonakis I, et al. CT online monitoring of HIFU therapy. In: Schneider SC, Levy M, McAvoy BR, eds. IEEE Ultrasonics Symposium Proceedings. New York: Institute of Electrical and Electronic Engineers; 1997. pp 1377--80
- Homolka P, Gahleitner A, Nowotny R. Temperature dependence of HU values for various water equivalent phantom materials. Phys Med Biol 2002;47:2917-23
- Frich L. Non-invasive thermometry for monitoring hepatic radiofrequency ablation. Minimally Invasive Therapy and Allied Technologies 2006;15:18–25
- Yanof J, Bauer C, Renisch S, Krucker J, Sabczynski J. Image-guided therapy (IGT): New CT and hybrid imaging technologies. In: Spekowius G and Wendler T, eds. Advances in Health Care Technology: Shaping the Future of Medical Care. Houten, Netherlands: Springer; 2006. pp 147--66
- Schena E, Saccomandi P, Giurazza F, Caponero M, Mortato L, Di Matteo F, et al. Experimental assessment of CT-based thermometry during laser ablation of porcine pancreas. Phys Med Biol 2013;58:5705
- Paulson EK, Sheafor DH, Enterline DS, McAdams HP, Yoshizumi TT. CT fluoroscopy-guided interventional procedures: Techniques and radiation dose to Radiologists. Radiology 2001;220:161–7
- Kiricuta I, Simplăceanu V. Tissue water content and nuclear magnetic resonance in normal and tumor tissues. Cancer Res 1975;35:1164–7
- Marmur J, Doty P. Determination of the base composition of deoxyribonucleic acid from its thermal denaturation temperature. J Mol Biol 1962;5:109–18
- Goldberg SN, Grassi CJ, Cardella JF, Charboneau JW, Dodd GD III, Dupuy DE, et al. Image-guided tumor ablation: Standardization of terminology and reporting criteria. J Vasc Intervent Radiol 2009;20:S377–90
- Azhari H. Basics of Biomedical Ultrasound for Engineers. Hoboken, NJ: Wiley; 2010
- Civale J, Clarke R, Rivens I, ter Haar G. The use of a segmented transducer for rib sparing in HIFU treatments. Ultrasound Med Biol 2006;32:1753–61
- Rhim H, Goldberg SN, Dodd GD III, Solbiati L, Lim HK, Tonolini M, Cho OK. Essential techniques for successful radio-frequency thermal ablation of malignant hepatic tumors. Radiographics 2001;21:S17–35
- Bruners P, Levit E, Penzkofer T, Isfort P, Ocklenburg C, Schmidt B, et al. Multi-slice computed tomography: A tool for non-invasive temperature measurement? Int J Hyperthermia 2010;26:359–65
- Pandeya GD, Greuter MJW, Schmidt B, Flohr TG, Oudkerk M. Calibration of temperature measurements with CT for ablation of liver tissue. Proc SPIE 7625, Medical Imaging 2010; doi:10.1117/12.844313
- Pandeya GD, Greuter MJ, de Jong KP, Schmidt B, Flohr T, Oudkerk M. Feasibility of noninvasive temperature assessment during radiofrequency liver ablation on computed tomography. J Comput Assist Tomogr 2011;35:356–60
- Bruners P, Pandeya GD, Levit E, Roesch E, Penzkofer T, Isfort P, et al. CT-based temperature monitoring during hepatic RF ablation: Feasibility in an animal model. Int J Hyperthermia 2012;28:55–61
- Hara AK, Paden RG, Silva AC, Kujak JL, Lawder HJ, Pavlicek W. Iterative reconstruction technique for reducing body radiation dose at CT: Feasibility study. Am J Roentgenol 2009;193:764–71
- Silva AC, Lawder HJ, Hara A, Kujak J, Pavlicek W. Innovations in CT dose reduction strategy: Application of the adaptive statistical iterative reconstruction algorithm. Am J Roentgenol 2010;194:191–9
- Kell GS. Density, thermal expansivity, and compressibility of liquid water from 0° to 150° correlations and tables for atmospheric pressure and saturation reviewed and expressed on 1968 temperature scale. J Chem Eng Data 1975;20:97–105
- Beutel J, Kundel HL, Van Metter RL. Handbook of Medical Imaging, Volume 1: Physics and Psychophysics. Bellingham, Washington: SPIE Press; 2000
- Pandeya G, Klaessens J, Greuter M, Schmidt B, Flohr T, van Hillegersberg R, Oudkerk M. Feasibility of computed tomography based thermometry during interstitial laser heating in bovine liver. Eur Radiol 2011;21:1733–8