
Abstract
Magnetic resonance thermometry (MRT) offers non-invasive temperature imaging and can greatly contribute to the effectiveness of head and neck hyperthermia. We therefore wish to redesign the HYPERcollar head and neck hyperthermia applicator for simultaneous radio frequency (RF) heating and magnetic resonance thermometry. In this work we tested the feasibility of this goal through an exploratory experiment, in which we used a minimally modified applicator prototype to heat a neck model phantom and used an MR scanner to measure its temperature distribution. We identified several distorting factors of our current applicator design and experimental methods to be addressed during development of a fully MR compatible applicator. To allow MR imaging of the electromagnetically shielded inside of the applicator, only the lower half of the HYPERcollar prototype was used. Two of its antennas radiated a microwave signal (150 W, 434 MHz) for 11 min into the phantom, creating a high gradient temperature profile (ΔTmax = 5.35 °C). Thermal distributions were measured sequentially, using drift corrected proton resonance frequency shift-based MRT. Measurement accuracy was assessed using optical probe thermometry and found to be about 0.4 °C (0.1–0.7 °C). Thermal distribution size and shape were verified by thermal simulations and found to have a good correlation (r2 = 0.76).
Introduction
Extensive biological research has shown that hyperthermia treatment (HT) is one of the most, if not the most, potent modifiers of radiation known today [Citation1]. Clinically, the impact of radio-sensitisation on treatment outcome in advanced head and neck (H&N) carcinoma was first demonstrated by the phase III study of Valdagni et al. [Citation2,Citation3], followed up by more recent studies by Huilgol [Citation4] and Hua [Citation5]. The techniques to apply H&N HT in those phase III trials (e.g. resistive wire, capacitive heating) allow heating of only a part of the H&N region and little control of the heating pattern. Hence, we developed the HYPERcollar applicator that allows deep local heating in the entire H&N region [Citation6]. The HYPERcollar features 12 independently controlled antenna providing 23 degrees of freedom to shape the heating pattern. Optimisation of the signals is performed by applying hyperthermia treatment planning (HTP) prior to treatment based on electromagnetic (EM) simulations. This way, the power absorption profile (expressed in the specific absorption rate or SAR) is optimised assuming that this correlates to higher temperatures achieved in the tumour. This approach was clinically verified for three patients [Citation7]. HTP could play a larger role in hyperthermia quality control and dosimetry, when temperature simulations would be accurate. However, large deviations in thermal tissue properties and their variations during the course of heating make in vivo temperatures difficult to predict [Citation8]. This creates an incentive towards the improvement of real time dosimetry methods and therefore thermometry. Collection of HT thermometry has traditionally been performed by using temperature probes, i.e. thermocouples or fibre-optic thermometry [Citation8]. Although, inherently highly accurate in temperature readings (∼0.2 °C (0.1–0.3 °C)), these probes affect the set-up and provide readings at only a limited number of locations. Non-invasive methods circumvent the need for temperature sensors pierced into the skin, which is cumbersome, painful and not without risk of complications. Magnetic resonance thermometry (MRT) provides the advantage of non-disturbance of measurements at high resolution, and the proton resonance frequency shift (PRFS) appears to be the most promising technique [Citation9]. Hence, we started an investigation into the feasibility of a H&N HT applicator which allows simultaneous HT and H&N MRT thermometry with a minimum of system interaction.
MR thermometry is clinically the most viable option for non-invasive thermometry and has attracted numerous researchers [Citation10–12]. Combined MRT and HT requires the development of compatible applicators which offer a minimum of MRT–HT system interaction. Dipole-based HT applicators have been successfully introduced into MR and have been used in experimental [Citation13–15] as well as clinical settings [Citation16,Citation17], which offers a good prospect for the feasibility of combined H&N HT and MRT.
The MRT techniques most often encountered in HT literature are based on the PRFS, due to its linearity, high sensitivity to temperature changes and virtual independence of tissue type [Citation9,Citation18]. In the clinic, an accuracy of around 1 °C has been shown for treatment of tumours in the pelvis [Citation10,Citation19], extremity [Citation17] and brain [Citation20–23]. In phantoms it provides an accuracy of typically 0.5 °C and the possibility to measure the temperature profile in 3D at a high resolution (5 mm) [Citation11,Citation23]. Hence, this method is very suitable for analysing the temperature patterns with the high thermal gradients typically obtained during 433 MHz phased array HT.
In this paper we report on a pilot study into the feasibility and accuracy of combined H&N HT and MRT. This includes testing the PRFS MRT method and several correction schemes for the MR scanner’s magnetic field drift. Additionally we identified sources of measurement bias that will be addressed in a specifically designed HT laboratory prototype. Our approach and presentation of the results are split into two parts: a point-based validation of PRFS MRT for a H&N applicator based on probe measurements, and a 2D verification of the measured thermal distribution using a combination of probe measurements and simulations.
The point-based validation will include an evaluation of the recently developed fat-referenced method for PRFS B0 field drift correction [Citation24,Citation25], which is particularly suited for application in HT. During the experiment a list of possible sources of systematic error was collected to facilitate fast progress in the development of a fully MR compatible applicator.
Materials and methods
Experimental set-up
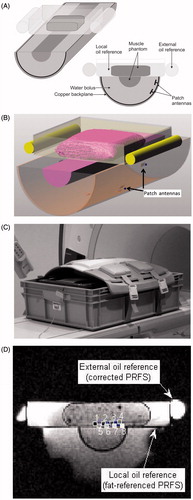
The experimental set-up, shown in , consists of the lower half of the cylindrical phantom phased-array applicator, a laboratory prototype of the HYPERcollar, described by Paulides et al. [Citation6]. The original applicator features a shared continuous copper ground plane which shields the inside from MR imaging. Therefore only the lower half of the original set-up was used. An absorber block of muscle-equivalent material [Citation26] (22.5 × 22.5 × 5.5 cm) was placed inside a PVC container (36.5 × 30.5 × 7 cm) on top of the central absorber to function as a replacement of the original upper semi-cylindrical phantom. The altered model geometry was deemed acceptable as it resembles the clinical situation encountered in lateral lymph node heating, which is the area with the strongest evidence base for H&N HT [Citation2,Citation3]. The exploratory nature of the research further supports this abstraction.
Figure 1. The H&N HT prototype MRT pilot set-up. (A) Schematic. (B) Simulation model. (C) Coil placement. (D) Coronal registration scan, indicating the external and local fat references and the top and bottom thermal probe sensors.
Ultrasound gel (Aquasonic 100, Parker Laboratories, Fairfield, NJ, USA) was used between the top absorber, container and bottom absorber to reduce the presence of air between each layer. The PVC container was filled with sunflower oil (Orkide, Kucukbay Oil Industry, Ankara, Turkey) and two additional bags of oil were added to the side of the container. Active cooling of the demineralised water inside the set-up was not included as the large volume was deemed sufficient for this pilot experiment.
The 434 MHz signals were provided by two 270 W AB class power amplifiers (Pavoni Diffusion, Rome, Italy) [Citation27]. The power system was positioned outside of the MRI’s Faraday cage to avoid signal interference and accommodate safety regulations. The signals were fed to the antennas via a connector panel, through two 12-m long low-loss (1.27–1.35 dB) RF-cables (Ecoflex 10, SSB-Electronic, Lippstadt, Germany).
MRT
For MR thermometry measurements we made use of methods based on the conventional PRFS technique [Citation18,Citation28], which offers relatively accurate (±1 °C) [Citation17,Citation29] and quick (1–10 s) results over a large temperature range (30–60 °C).
The adverse effects of non-thermally induced changes in the B0 field that create undesired phase drift in MR thermometry measurements were countered by using temperature invariant reference materials adjacent to the phantom for correction of field drift. In addition to the uncorrected PRFS technique, we generated results for two additional reference-based B0 drift correction methods.
Corrected-PRFS
Corrected-PRFS employs a separate reference made from a material which has little hydrogen bonding and therefore does not show a temperature-dependent phase change. This reference material may be placed close to the patient within the MR scanner bore. Non-thermally induced B0 drift measured inside the references is extrapolated towards the region of interest inside the patient, to correct for local B0 field drift effects in MRT [Citation15].
Fat-referenced PRFS
Fat-referenced PRFS employs the patient’s own body fat as a B0 drift reference. In comparison to c-PRFS, this technique uses references presumably much closer to the region of interest and does not require external apparatus to support a reference material, which might interfere with heating. However, it requires a sufficiently large volume of body fat around the heated area, which might not always be present. In addition, body fat is a heterogeneous material consisting of a mixture of water and fat. To separate the material components, a Dixon-based fat–water separation method that preserves temperature information in the reconstructed water and fat phase images was used to separate the two signal components [Citation24]. The field-drift correction map was then computed by interpolating the time-varying phase change in the reconstructed fat images [Citation15,Citation30].
MRT acquisition was performed with a 1.5 T MR 450 W scanner (General Electric Health Care, Waukesha, WI, USA), using a multi-echo spoiled gradient (SPGR) sequence with flyback gradients: echo time (TE) = 7.7 ms, 10.1 ms, 12.5 ms and 14.9 ms, repetition time (TR) = 25 ms, flip angle (FA) = 15°, field of view (FOV) = 50 cm, slice thickness = 3 mm, matrix = 128 × 128 and bandwidth = 100 kHz. This resulted in single slice data-matrix of the transverse plane, with a 4 × 4 mm grid size, which was then spatially averaged over a 20 × 20 mm area (5 × 5 voxels) in post-processing to reduce uncertainty.
The scanner’s body coil was used as transmitter but could not effectively be used to take RF measurements due to the EM shielding in the bottom of the set-up. To improve received signal-to-noise ratio, a receiver surface coil array was placed directly on top of the set-up ().
In the fat-referenced measurement, fat–water signals were separated using the last three echoes, and a first-order correction map was computed according to Hofstetter et al. [Citation25]. PRFS and corrected PRFS were computed separately for each of three echoes and then combined by averaging. Temperature-dependent susceptibility and electric conductivity effects were ignored.
shows the location of the references used for each method. The fat reference method used the oil in the basin directly surrounding the top absorber to simulate its ability to use a reference close to the heated region. We did not use a phantom material with electromagnetic properties similar to human fat because we did not expect the reference material to influence our ability to heat.
For corrected PRFS, external references were used in the form of plastic bags filled with oil and placed to the side of the container.
Probe thermometry
Two four-sensor fibre-optic temperature probe systems (model FOT-NS-577C, FISO Technologies, Québec, Canada.) were placed inside closed tip catheters located in the heated region, as is shown in . These probes provided fast (>10 Hz) and accurate thermometry (accuracy of 0.1 °C, with a precision of ±0.05 °C one day after calibration).
Localisation of the sensors was based off concurrent 3D MRI localisation scans (SE, FOV = 500 × 500 mm, matrix size = 512 × 512, TR = 1500 ms, TE = 60 ms, FA = 90°, slice thickness = 3 mm, number of slices = 176) and manual probe insertion depth measurements. Equipment was calibrated for the range of 20–30 °C and temperature levels at the start of the measurement were synchronised and nulled. Probe data was re-sampled from 75 Hz to 1 Hz using a linear filter, which reduced random variation to ±0.01 °C.
Electromagnetic and thermal simulations
Electromagnetic and thermal simulations were performed using SEMCAD X (version 14.8, Schmid & Partner Engineering, Zurich, Switzerland) computational software. Specifications were similar to the previous publicised study involving this set-up [Citation6]. A high-resolution 3D scan, taken during the experiment, facilitated in adaptation of the applicators CAD model to accurately recreate the experimental set-up and identify the exact position of the temperature probes. The semi-cylinder and applicator model were created with a parameterised modelling script from exact dimensions. The objects with an irregular shape, such as the top absorber, were recreated and positioned through delineation of the grey values on MRI 3D scan images using segmentation software (version 3.5, iSeg, Schmid & Partner Engineering). The resulting CAD-model is shown in . Models were constructed on a universal 1.3-mm Yee grid and solved using a finite difference time domain algorithm. The electric fields were calculated for each antenna separately and linearly combined in post-processing. Uniaxial perfectly matched layers absorbing boundary conditions (UPML-ABC) were used to limit the domain. Stable power levels were obtained within 17 periods. Dielectric properties, which are displayed in , were taken from the literature. Temperature dependence of properties in the relevant range (20–30 °C) was ignored.
Table 1. Dielectric and thermal properties (434 MHz, 20–30 °C) as used in EM and thermal simulations. εr is relative permittivity, σeff is effective conductivity, ρ is mass density, cp is the specific heat capacity and k is the thermal conductivity.
The model of the thermal behaviour was an adaptation of the Pennes bioheat equation (PBHE), reduced to compute only the temperature increase from applied heat, as earlier discussed by Bakker et al [Citation27]. Dirichlet boundary conditions were applied to material-air transitions. Inaccuracy caused by the boundaries was assured to be negated by their distance to the area of interest. Thermal convection in the water bolus and fat were not modelled as their effects were assumed to be limited due to the lack of circulation and general distance from the heating focus. shows the thermal material properties, which were retrieved from various literature sources. The minor temperature dependence of the properties for the relevant range was ignored. As the heating source, SAR distributions were constructed from the EM simulation results. The power delivery was corrected for the reflectivity measurements taken during the experiments, but antenna heat losses were not taken into account.
Experimental procedure
Heating and image collection were performed sequentially to avoid system interference. Heating was applied using both antennas simultaneously, each at 75 W for a combined power of 150 W, for 60-s periods, inter-spaced by 45 s of MRT measurements. This cycle of heating and cooling was repeated for approximately 20 min, followed by monitoring of the thermal decay. The temperature baseline of the set-up was established at room temperature (21 °C).
Statistical analysis
Probe measurements are taken as the gold standard in our analysis, so the difference between probe and MRT measurements is interpreted as the MRT error. MRT accuracy is quantified as the root mean square of the error over the time series. In addition, we quantified single measurement precision by the standard deviation of the error, the error range by the maximum error and the linear match between various time series by the squared Pearson correlation coefficient. Data collected inside fluid media, such as the water bolus and the oil basin, showed large anomalies and were therefore excluded from analysis.
Results
Probe-based MRT validation
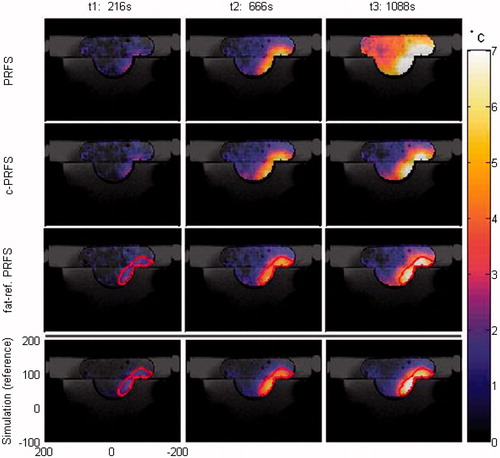
Using probe thermometry, we verified our ability to heat the phantom by registering a maximum temperature increase of 5.35 °C after 19 min of power application (11.3 min of heating, 7.5 min of measurements). According to the measurements collected with the fat reference PRFS MRT method, the 50% iso-therm at this point was at 4.61 °C. It formed a boomerang shaped focus of approximately 11 cm long and 3 cm wide, which is shown in .
Figure 2. Heat distribution plotted as an overlay on the MR image, measured at various time points (indicated in ) in the 2D plane using three PRFS methods, compared with a thermal simulation result (bottom). The (red) line in the fat-referenced PRFS and simulation plots indicates the 50% isotherm of fat-referenced PRFS at t = 1066 and binds the area of interest for the statistical analysis shown in .
shows the temperature–time characteristics collected for the three MRT methods (PRFS, c-PRFS and fat-referenced PRFS) compared to the temperature measured by probe 8. This figure shows the effect of the B0 field drift, which slowly accumulated after measurement started. At around 900 s, a large discrepancy between probe and PRFS MRT measurement became visible that continued to vary wildly for the rest of the measurement. In contrast, the c-PRFS and fat-referenced PRFS methods showed the effect of the drift correction by staying close to the reference. The results found for the other probes showed similar behaviour, including the drift pattern for uncorrected PRFS measurement.
Figure 3. Temperature–time characteristic of MRT results, compared with a reference taken at probe 8 (see ). Dashed lines indicate the time points where the data of were obtained.
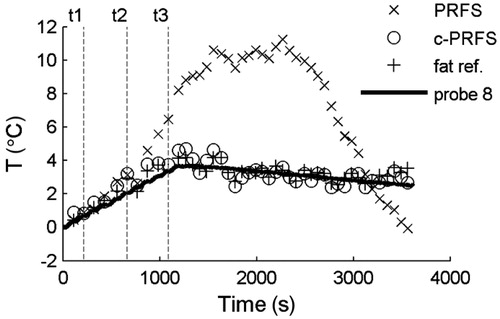
shows that the accuracy, precision, range, and correlation with the reference of both corrected MRT methods were superior to PRFS without correction. In addition, this table shows that the fat reference correction method performed slightly better than the standard corrected-PRFS method, with only the noise-dependent maximum error (εmax) being slightly larger. Considering this somewhat better performance and the advantages of the fat reference method for clinical practice, this method was chosen for our further analysis.
Table 2. Accuracy (root mean square error εrms), precision (standard deviation σ), range (maximum error εmax) and correlation (squared correlation coefficient r2) of the various MRT measurements, using probe measurements (above the line) or temperature simulations (below the line) as a reference. All values are given in °C, except r2 which is unitless.
MRT 2D verification
shows the heating progression as measured using the three MRT methods in a two dimensional projection, compared with the same progression predicted by the simulations. The general location and shape of the main heat distribution in the fat reference PRFS series agrees with our predictions. Discrepancies can be observed near material transition such as object boundaries or captured air bubbles. The bottom section of provides a statistical indication of the accuracy and precision of the MRT results when compared to thermal simulations. The area of interest for this analysis was limited to the area bound by the 50% maximum temperature isotherm at the final power off (t = 1066 s). This is indicated on the relevant plots in .
These indicators are comparable to the numbers calculated for the probe references in . To validate the use of thermal simulations to evaluate the MRT results, also shows the statistics of the simulations when compared to the original probe reference.
When comparing the accuracy of the match (εrms) between fat-referenced PRFS and probe measurements, we observed a greater disagreement for the 2D plane (MRT versus simulations). Assuming quadratic summation of errors, this difference cannot be explained solely by errors of the simulation, i.e. fat-referenced PRFS and simulations have a combined uncertainty of (0.402 + 0.282)1/2 = 0.49 °C, which is smaller than the 0.71 °C found when comparing fat-referenced PRFS with simulations for the entire 2D domain (see ). We conclude that unstudied parameters, for example the effect of errors in measurement localisation, representation of boundaries of the calculation domain and in-homogeneities in the phantom have a relevant impact on the uncertainty of the simulation and should be analysed in future studies if simulations are used as a reference for method validation.
Discussion
The pilot experiment was performed as a first step towards the development of an integrated and fully MR compatible H&N HT applicator. To this end, we have identified a number of attributes during this experiment, which introduce systematic errors in the measurement result, and therefore will need to be addressed in subsequent research. We will discuss these in three parts: first, limitations regarding our heating set-up; second, set-up attributes interfering with MRT acquisition; and third, causes of inaccuracies in our simulations.
Experimental set-up
For this experiment we used the experimental HYPERcollar applicator, which was modified for use inside an MRI scanner. Use of hardware similar to the clinical applicator offered good insight into adaptations required but also limited experimental options. For instance, only two antennas in the lower set-up were used as heating sources, where 12 are used for deep heating in H&N HT. However, the achieved temperature increase was similar to what was obtained earlier by Paulides et al. [Citation6], due to the increased antenna power levels and heating time. Control of the size and position of the focus has been left for future study and will necessitate a design with much a larger number of sources, as was shown during the design of the HYPERcollar [Citation37].
The continuous metal back plane acted as an undesired RF shield for MR transmit and receive signals, which necessitated the division of the original prototype in two halves. This metal backplane is an integral part of the clinical HYPERcollar applicator, so MRI compatibility will require a new applicator design including an antenna redesign to reduce the surface area of the ground plane and other metal components.
Susceptibility artefacts were observed near the antennas. Further investigations into bias mitigating measures (i.e. other material properties and geometry) will be conducted to enable antenna placement close to the region of interest. The choice of antenna positions to the upper side was motivated by the wish to heat close to the measurement probes, the reference material and the receiver surface coil array. Results, however, show no large effects due to shielding.
An additional absorber was placed on top to extend the focus area, allowing it to be surrounded by reference material and removing the disruptive effect of a nearby transition to air. This proved to be effective as we were able to create a heating area extending into both the bottom and top absorber. Water circulation and cooling was not deemed necessary during this experiment due to the large volume of the water bolus and relatively low power levels, and no negative effects were observed. All in all, the set-up served its purpose of proving the feasibility of RF heating inside an MRI scanner and to identify elements of redesign which will aid in fast progress in designing a clinical prototype.
MRT
In this paper we analysed for the first time the use of the PRFS-MR thermometry technique for H&N HT. In our pilot experiment, we found an accuracy in the same range as was previously reported for another cylindrical array set-up [Citation38,Citation39] and only slightly worse than earlier findings for the same method, reported by Hofstetter et al. [Citation25], which was performed without active heating and therefore without an applicator present inside the MR scanner. The large drift and sudden changes in the uncorrected PRFS temperature were observed earlier by El-Sharkawy [Citation40] and Wyatt [Citation15]. The former suggests that thermal perturbations caused by running ‘gradient intensive’ MR sequences can alter the passive shim of the magnet. Frequent switching between imaging and heating and frequent imaging by itself may cause a more pronounced drift. Additional heat generated by the hyperthermia applicator might also contribute to this effect and should be included into any future study on HT applicator–MR scanner system interaction.
The differences between the fat-referenced and corrected PRFS methods were in our opinion not sufficiently addressed in our pilot experiment, resulting in very similar measurement outcome for both methods. Both methods used a pure oil reference, eliminating the need for fat–water separation, and the external references were placed closer to the heated region than clinical application would allow. Such a set-up is not always clinically feasible and did not fully highlight the fat-referenced PRFS method’s comparative advantage in capturing local B0 field variations without manual segmentation of water and fat regions. Follow-up experiments will therefore need to include the development of a more lifelike neck phantom, including a fat-like material layer consisting of a mixture of oil and water. In addition, corrected PRFS references will have to be placed farther from the patient, perhaps even outside of the HT applicator, as the presence of a low permittivity material between the patient and the antennas could negatively influence EM heating.
The muscle equivalent phantom material used for the top and bottom absorber was found to have relatively long T1 relaxation times, which increased the repetition time and therefore reduced the temporal resolution of MRT measurements. The B0 distribution in the phantom was also found to be relatively inhomogeneous due to the inclusion of air bubbles, which caused some image artefacts (small signal voids). Phantom production methods should therefore be reviewed to reduce the presence of air bubbles and include T1-shortening contrast agents, such as gadolinium, if necessary.
Simulation
Temperature-based treatment planning is preferable over SAR-based planning, but the presence of complex cooling structures inside the H&N area makes accurate thermal modelling a challenge. One avenue of improvement for thermal prediction is the inclusion of temperature feedback to validate models and calibrate predictions when applied in the clinic. When thermometry having sufficient accuracy, resolution and collection rate becomes available, feedback-controlled treatment can supplement or possibly replace treatment planning. The results of this validation study indicate that temperature simulations are very predictive for a non-perfused muscle phantom set-up and hence can be used to design applicators and experimental set-ups.
Conclusion
In this paper we have reported the results of our exploratory experiments into the use of a HYPERcollar-like head and neck hyperthermia applicator in sequential combination with MR thermometry. These experiments show that it is feasible to install and operate a 433-MHz applicator set-up inside an MRI scanner to heat a phantom and to use the MRI scanner to obtain multi-slice MR thermometry measurements of the heated area. By applying 5 °C heating and performing MRT, we established fat-referenced PRFS as our MRT method of choice, with an average measurement error of 0.4 °C (0.1–0.7 °C).
While feasible, MR-guided head and neck hyperthermia will require an extensive redesign of the original HYPERcollar concept. To guide this process we have identified several distorting factors in the applicator design, signal generation and system interaction which will need to be addressed in subsequent research. Our thermal simulation method was found to have excellent predictive properties, which encourages its further use in the design and validation of the new MRT-compatible head and neck hyperthermia applicator.
Declaration of interest
The authors of Erasmus MC are financially supported by the Dutch Cancer Society (grant EMCR2012-5472) and Technology Foundation Stichting Technische Wetenschappen (STW grant 11195). The authors alone are responsible for the content and writing of this paper.
References
- Kampinga HH, Dikomey E. Review: Hyperthermic radiosensitization: Mode of action and clinical relevance. Int J Radiat Biol 2001;77:399–408
- Valdagni R, Amichetti M, Pani G. Radical radiation alone versus radical radiation plus microwave hyperthermia for N 3(TNM-UICC) neck nodes: A prospective randomized clinical trial. Int J Radiat Oncol Biol Phys 1988;15:13–24
- Valdagni R, Amichetti M. Report of long-term follow-up in a randomized trial comparing radiation therapy and radiation therapy plus hyperthermia to metastatic lymphnodes in stage IV head and neck patients. Int J Radiat Oncol Biol Phys 1993;28:163–9
- Huilgol NG, Gupta D, Dixit R. Chemoradiation with hyperthermia in the treatment of head and neck cancer. Int J Hyperthermia 2010;26:21–5
- Hua Y, Ma S, Fu Z, Hu Q, Wang LEI, Piao Y. Intracavity hyperthermia in nasopharyngeal cancer: A phase III clinical study. Int J Hyperthermia 2011;27:180–6
- Paulides MM, Bakker JF, Van Rhoon GC. Electromagnetic head-and-neck hyperthermia applicator: Experimental phantom verification and FDTD model. Int J Radiat Oncol Biol Phys 2007;68:612–20
- Paulides MM, Bakker JF, Linthorst M, Van Der Zee J, Rijnen Z, Neufeld E, et al. The clinical feasibility of deep hyperthermia treatment in the head and neck: New challenges for positioning and temperature measurement. Phys Med Biol 2010;55:2465–80
- Paulides MM, Stauffer PR, Neufeld E, Maccarini PF, Kyriakou A, Canters RAM, et al. Simulation techniques in hyperthermia treatment planning. Int J Hyperthermia 2013;29:346–57
- Lüdemann L, Wlodarczyk W, Nadobny J, Weihrauch M, Gellermann JM, Wust P. Non-invasive magnetic resonance thermography during regional hyperthermia. Int J Hyperthermia 2010;26:273–82
- Gellermann JM, Faehling H, Mielec M, Cho CH, Budach V, Wust P. Image artifacts during MRT hybrid hyperthermia – Causes and Elimination. Int J Hyperthermia 2008;24:327–35
- Stakhursky VL, Arabe OA, Cheng K, MacFall JR, Maccarini PF, Craciunescu OI, et al. Real-time MRI-guided hyperthermia treatment using a fast adaptive algorithm. Phys Med Biol 2009;54:2131–45
- Cheng K-S, Stakhursky VL, Craciunescu OI, Stauffer PR, Dewhirst MW, Das SK. Fast temperature optimization of multi-source hyperthermia applicators with reduced-order modeling of ‘virtual sources’. Phys Med Biol 2008;53:1619–35
- Kowalski ME, Behnia B, Webb AG, Jin J-M. Optimization of electromagnetic phased-arrays for hyperthermia via magnetic resonance temperature estimation. IEEE Trans Biomed Eng 2002;49:1229–41
- Craciunescu OI, Das SK, McCauley RL, MacFall JR, Samulski TV. 3D numerical reconstruction of the hyperthermia induced temperature distribution in human sarcomas using DE-MRI measured tissue perfusion: Validation against non-invasive MR temperature measurements. Int J Hyperthermia 2001;17:221–39
- Wyatt CR, Soher BJ, Maccarini P, Charles HC, Stauffer PR, Macfall J. Hyperthermia MRI temperature measurement: Evaluation of measurement stabilisation strategies for extremity and breast tumours. Int J Hyperthermia 2009;25:422–33
- Carter DL, MacFall JR, Clegg ST, Wan X, Prescott DM, Charles HC, et al. Magnetic resonance thermometry during hyperthermia for human high-grade sarcoma. Int J Radiat Oncol Biol Phys 1998;40:815–22
- Craciunescu OI, Stauffer PR, Soher BJ, Wyatt CR, Arabe OA, Maccarini PF, et al. Accuracy of real time noninvasive temperature measurements using magnetic resonance thermal imaging in patients treated for high grade extremity soft tissue sarcomas. Med Phys 2009;36:4848–58
- Rieke V, Butts-Pauly K. MR thermometry. J Magn Reson imaging 2008;27:376–90
- Gellermann JM, Hildebrandt B, Issels R, Ganter H, Wlodarczyk W, Budach V, et al. Noninvasive magnetic resonance thermography of soft tissue sarcomas during regional hyperthermia: Correlation with response and direct thermometry. Cancer 2006;107:1373–82
- Kickhefel A, Roland J, Weiss C, Schick F. Accuracy of real-time MR temperature mapping in the brain: C comparison of fast sequences. Phys medica 2010;26:192–201
- Grissom WA, Lustig M, Holbrook AB, Rieke V, Pauly JM, Butts-Pauly K. Reweighted l1 referenceless PRF shift thermometry. Magn Reson Med 2010;64:1068–77
- Grissom WA, Hofstetter LW, Rieke V, Medan Y, Butts-Pauly K, Davis CE. Hybrid multibaseline and referenceless PRF-shift thermometry using both water and fat images. Proc Int Soc Magn Reson Med 2011;19:1771
- Soher BJ, Wyatt CR, Reeder SB, MacFall JR. Noninvasive temperature mapping with MRI using chemical shift water-fat separation. Magn Reson Med 2010;63:1238–46
- Hofstetter LW, Yeo TD, Dixon WT, Davis C, Foo TK. Fat-referenced MR thermometry using 3-echo phase-based water separation method. Proc Int Soc Magn Reson Med 2011;19:1770
- Hofstetter LW, Yeo DTB, Dixon WT, Davis CE, Foo TK, Kempf JG. Fat-referenced MR thermometry in heterogeneous tissue using IDEAL. Proc Int Soc Magn Reson Med 2011;19:5307
- Ito K, Furuya K, Okano Y, Hamada L. Development and characteristics of a biological tissue-equivalent phantom for microwaves. Electron Comm Jpn 1 2001;84:67–77
- Bakker JF, Paulides MM, Westra AH, Schippers H, Van Rhoon GC. Design and test of a 434 MHz multi-channel amplifier system for targeted hyperthermia applicators. Int J Hyperthermia 2010;26:158–70
- Mcdannold NJ. Quantitative MRI-based temperature mapping based on the proton resonant frequency shift: Review of validation studies. Int J Hyperthermia 2005;21:533–46
- Ishihara Y, Calderon A, Watanabe H, Okamoto K, Suzuki Y, Kuroda K, et al. A precise and fast temperature mapping using water proton chemical shift. Magn Reson Med 1995;34:814–23
- Hofstetter LW, Yeo DTB, Dixon WT, Kempf JG, Davis CE, Foo TK. Fat-referenced MR thermometry in the breast and prostate using IDEAL. J Magn Reson imaging 2012;36:722–32
- Gabriel S, Lau RW, Gabriel C. The dielectric properties of biological tissues: III. Parametric models for the dielectric spectrum of tissues. Phys Med Biol 1996;41:2271–93
- MatBase. Available from: www.matbase.com. Last accessed 2013
- The Engineering ToolBox. Available from: www.engineeringtoolbox.com. Last accessed 2013
- Cataldo A, Piuzzi E, Cannazza G, De Benedetto E, Tarricone L. Quality and anti-adulteration control of vegetable oils through microwave dielectric spectroscopy. Measurement 2010;43:1031–9
- Nita I, Neagu A, Geacai S, Dumitru A, Sterpu A. Study of the behavior of some vegetable oils during the thermal treatment. Ovidius Univ Ann Chem 2010;21:5–8
- Sosa-Morales ME, Orzuna-Espíritu R, Vélez-Ruiz JF. Mass, thermal and quality aspects of deep-fat frying of pork meat. J Food Eng 2006;77:731–8
- Paulides MM, Bakker JF, Zwamborn APM, Van Rhoon GC. A head and neck hyperthermia applicator: Theoretical antenna array design. Int J Hyperthermia 2007;23:59–67
- Das SK, Jones EA, Samulski TV. A method of MRI-based thermal modelling for a RF phased array. Int J Hyperthermia 2001;17:465–82
- Das SK, MacFall JR, McCauley RL, Craciunescu OI, Dewhirst MW, Samulski TV. Improved magnetic resonance thermal imaging by combining proton resonance frequency shift (PRFS) and apparent diffusion coefficient (ADC) data. Int J Hyperthermia 2005;21:657–67
- El-Sharkawy AM, Schär M, Bottomley PA, Atalar E. Monitoring and correcting spatio-temporal variations of the MR scanner’s static magnetic field. MAGMA 2006;19:223–36