
Abstract
The dependence of computed tomography (CT) values on temperature has been pointed out by several authors since the late 1970s. They emphasised the importance of this phenomenon on the calibration process with water equivalent phantoms of the CT scanners. Few years later the potential of CT thermometry for non-invasive temperature mapping during thermal procedures was investigated. The interest on the employment of this technique during thermal treatments has been recently renewed with the improvement of modern CT scanner performances and with the increased popularity of minimally invasive thermal techniques for cancer treatment. A good thermometry allows avoiding unintended damage of the healthy tissues during the procedure by providing a detailed tissue temperature distribution; therefore, it is recommended in order to achieve good effectiveness of the thermal treatment. Researchers have been working on this issue for more than four decades and different non-invasive solutions have been proposed, i.e., microwave thermal imaging, infrared (IR)-, ultrasound-, magnetic-resonance (MR)-, and CT-based thermometry. This review aims to summarise the essential physics and the currently available data on CT-based thermometry and to elucidate the potential use of this technique during thermal procedures. Background information on measuring principle, an investigation of the performances achieved by this technique and the thermal sensitivity of the CT-number of different organs are provided and discussed.
Introduction
Computed tomography (CT) thermometry refers to the acquisition of detailed thermal information throughout a slice of the subject obtained from a CT scan, providing the indirect measurement of temperature from CT values.
This technique belongs to the wide class of non-invasive temperature monitoring methods, which includes ultrasound-, infrared (IR)- and magnetic resonance (MR)-based thermometry, among others [Citation1], and it appears particularly attractive for application in tissue temperature monitoring during thermal procedures. Throughout these procedures, the physician monitors or visualises the effects of the treatment. In-vivo temperature measurement is obviously an important measurement during thermal ablation. This feedback is used to make adjustments in treatment delivery to decrease the risk for under-treated tissue [Citation2]. Moreover these approaches can overcome the risks related to the use of invasive techniques for temperature monitoring (e.g. thermocouples, thermistors, and fiber optic based sensors) which require the insertion of the sensing element within the organ [Citation1]. Recently, extensive research efforts have been devoted to the investigation of the abovementioned non-invasive techniques due to the growing clinical use of several minimally invasive procedures for the local treatment of solid malignancies, i.e., radiofrequency ablation (RFA) [Citation3], laser induced thermotherapy (LITT) [Citation4], microwave ablation (MWA) [Citation5], high intensity focused ultrasound (HIFU) [Citation6] and cryotherapy [Citation7]. Among the currently available ablation techniques, RFA has been evaluated most extensively. Local thermal ablative techniques have gained popularity over the last decade proving to be an effective and safe alternative in many patients [Citation8,Citation9]. Indeed, about 100 000 cancer patients are annually treated worldwide by thermal ablation (as reported by the Society for Thermal Medicine), and the trend of tumour management indicates an increase in the use of ablation techniques, e.g. the 7% stage I renal tumour is treated by focal ablation instead of the 1% in 1990 [Citation10]. These techniques are also cost effective in comparison to other treatments. Due to the wide range of possible therapeutic effects, these procedures are practised with large considerable variation in methodology based on geography as well as subdisciplines within the medical community [Citation11]. The outcome of these treatments is mainly related to the tissue temperature distribution which governs the amount of damaged tissue and the volume of tissue ablation. Since the 1970s the monitoring of temperature distribution was considered essential to widespread thermal procedures [Citation12], therefore, some studies have been carried out to assess the feasibility of different thermometric techniques during thermal ablation treatments [Citation13].
Nowadays, MR-based thermometry is the most common employed non-invasive technique and several methods, exploiting T1 relaxation time or proton resonance frequency (PRF) shift dependence on temperature, have been evaluated [Citation14]. The main limitations of this technique are high cost and availability of MR-compatible instruments. These limitations might be less important for X-ray CT scan thermometry and therefore X-ray CT-thermometry has a potential for use in thermal ablation. However, MR-based thermometry allows monitoring tissue temperature without radiation exposure, whereas CT-based one requires repeated CT scans with an equivalent dose depending on the treated organ.
The temperature dependence of CT numbers of water and biological tissues was already investigated by Bydder and Kreel in 1979 [Citation15], to analyse the influence of temperature on the calibration process of CT scanners. A few years later Fallone et al. [Citation16] investigated the potential use of CT-based thermometry to perform non-invasive temperature estimation of water and muscle tissue, and proposed the introduction of this technique during thermal treatments. Their results postulated that the achievable temperature discrimination was a fraction of degree centigrade at spatial resolution of approximately 1 cm. However, at that time, CT values were far from stable and reproducibility of CT measurements was not guaranteed [Citation17]; therefore, it was not until 1997 that CT thermometry was considered valuable during local tumour ablation, when the feasibility of monitoring temperature with a clinical CT scanner during applications of high intensity focused ultrasound (HIFU) was evaluated [Citation18].
The recent developments in CT technology, i.e., improved reproducibility and spatial resolution of CT measurements, along with the constant increase of clinical demand for non-invasive temperature monitoring during thermal ablation, promoted the research of CT thermometry on different tissues undergoing thermal procedures [Citation19,Citation20].
The above described application of CT thermometry involves strict requirements, such as [Citation21]:
spatial resolution of 1–2 mm;
acquisition time lower than 10–30 s;
temperature precision of 1–2 °C;
real-time three-dimensional temperature mapping;
correction of motion artefacts due to patient movement and metal artefacts from ablation devices in order to meet the requirement of temperature precision better than 1–2 °C;
the entire volume to treat needs to be covered with a single data acquisition;
CT thermometry has to become independent from attenuation changes caused by intravenous administration of contrast agent;
the radiation exposure from repeated CT measurement needs to meet safety standards.
The first two criteria have been met by Pandeya et al. during ex-vivo experiments on porcine liver [Citation12], with a spatial resolution of 1.2 mm and an acquisition time of 500 ms. On the other hand, further studies are needed to reach the third goal: Bruners et al. stated that a temperature discrimination of 3–5 °C could be obtained [Citation22]. Dedicated algorithms for metal artefacts reduction are present in literature providing excellent results in presence of geometrically well-defined objects such as puncture needles [Citation23]. Undoubtedly, limiting patients' exposure is the most important demand in the use of CT scan. Its reduction can be obtained by employing innovative filters and reconstruction algorithms [Citation24]. Bruners et al. [Citation22] reported the values of CT dose (≈25mGy) for a particular protocol employed in their experiments which is lower than values reported in other CT-guided interventional procedures: for instance, median values of 281 mGy for biopsies, and 557 mGy for RFA, considering also the diagnostic scans obtained before the interventions, are reported in [Citation25].
This paper presents a detailed overview of the main researches on the dependence of CT number on temperature. Along the manuscript we offer a critical review of the thermal sensitivity of different tissues and water equivalent phantoms focusing on the different scan protocols followed and the performances obtained by CT-based thermometry. For the sake of clarity we arranged the paper in three parts: (i) theoretical background of CT-based thermometry; (ii) CT values dependence on temperature obtained for CT scanner calibration; (iii) temperature monitoring during thermal procedures by CT-based thermometry.
Theoretical background
An image obtained by CT scan consists of a matrix of pixels, representing the average X-ray attenuation profile of the tissue in the corresponding voxels, three-dimensional elements whose dimensions depend on pixels size and on slice thickness.
Voxels raw data are processed to obtain an attenuation value for each pixel of the final reconstructed image, the CT number, expressed in dimensionless Hounsfield Units:
where µH2O is the linear attenuation coefficient of water, and μ(x, y) is the average linear attenuation coefficient corresponding to the (x, y) pixel. X-ray attenuation at high energy levels used in CT scan (about 75 keV) is largely a result of Compton scattering interaction with small contribution from Rayleigh scattering and the photoelectric effect. In this photon energy range, the energy loss due to these processes is proportional to electronic density, ρε = NZ/A, where A and Z are the atomic mass and atomic number respectively, and N is Avogadro's number. The value of
varies with physical density (mass, M, per unit of volume, V) for a given material, ρ whose dependence on linear attenuation coefficient µ can be written as follows:
where µm is the mass attenuation coefficient of the material.
It is well known that when a substance becomes warmer, its density is commonly reduced. The density reduction due to the phenomenon of thermal expansion can be expressed as:
where T0 is CT calibration temperature (e.g., 20 °C), ΔT = T−T0 is the temperature variation, and α is the volumetric expansion coefficient characteristic of the material.
Therefore, as schematically reported in , the phenomenon of thermal expansion explains the decrease of density if T increases, thus, the Hounsfield unit decreases with increasing temperature (Equations 1–3).
Figure 1. Schematic representation of the phenomena explaining the CT value dependence on tissue temperature.
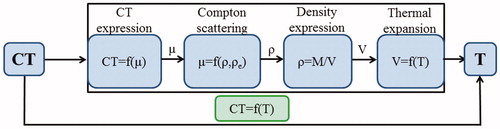
Hence, a change in density will result in a change in the observed CT number:
and the CT variation can be expressed as follows:
Equation (5) is obtained by considering a linearisation based on Taylor series expansion in αΔT, as proposed in [Citation26]. It shows that changes in tissue temperature can be indirectly measured by monitoring the CT numbers of the tissue. The minus sign indicates that during ablation procedures treatments the temperature increase causes a decrease of the CT number. In order to experimentally verify Equation (5), which correlates CT value and temperature, the temperature measurement of the sample is required. In order to investigate the relationship between local temperatures and area-averaged CT number, the CT values are synchronised with the measured temperatures and a regression analysis is performed. In scientific literature the linear model – reported in Equation (5) – is mostly employed. Nevertheless, some isolated studies have shown that the relationship between CT numbers and temperature is not characterised by a constant sensitivity when the tissue temperature experiences wide changes, being α not constant with temperature. In fact, these studies propose quadratic [Citation20] or cubic [Citation27] fittings, which better agree with experimental data than the linear model. The slope of the best fitting curve represents the sensitivity of the CT-based thermometry and depends on the particular material/tissue under investigation: a higher value of the slope is mainly due to a larger thermal expansion coefficient, leading to a greater variation in CT numbers with temperature.
CT number dependence on temperature: impact on clinical practice
The first experimental study describing the CT value changes in a wide range of temperature (about 40 °C), aims to investigate the influence of environmental temperature during CT scanner calibration process [Citation15]. The results highlighted the importance of taking into account the temperature of the phantoms employed during the calibration in order to accurately estimate the CT values of body tissues and fluids: e.g. the CT value of water equivalent phantoms changes of about 5–6 HU between typical room temperature (≈18 °C) and body one. Authors recommended to calibrate the CT scanner with calibration water at body temperature in order to obtain a zero CT value at body temperature.
Despite the valuable characteristics of non-invasiveness, the lack of reproducibility and the low spatial resolution of CT scanners discouraged the widespread use of this technique in temperature monitoring during thermal procedures. It was only in 1997 that CT thermometry was considered valuable during local tumour ablation [Citation18]. The performances of modern CT scanners motivate the growing interest on CT-based thermometry applied on ex-vivo and in-vivo tissues undergoing thermal treatment [Citation19,Citation22]. A further improvement has been obtained thanks to the development of dedicated algorithms for metal artefacts [Citation23] and of reconstruction algorithms for radiation dose reduction [Citation24]. It has to be reminded that reconstruction algorithms can introduce a loss of detail in CT images and an increase in the reconstruction time. Nevertheless, innovative approaches have achieved a good trade-off between image resolution and dose reduction [Citation24] and fast iterative algorithm for metal artefact reduction have been implemented, too [Citation28].
A detailed overview of the main researches concerning the influence of temperature on CT values is reported in the following two subsections: in the first one the impact of the mentioned influence on the calibration process of CT scanner is investigated, in the second one the employment of CT-based thermometry in thermal procedures is described, particularly focusing on the thermal sensitivity of different biological tissues and on the CT parameters used during the experimental trials (i.e. kVp, mAs, slice thickness…), which influence CT number measurements.
Temperature assessment of water-equivalent calibration phantoms
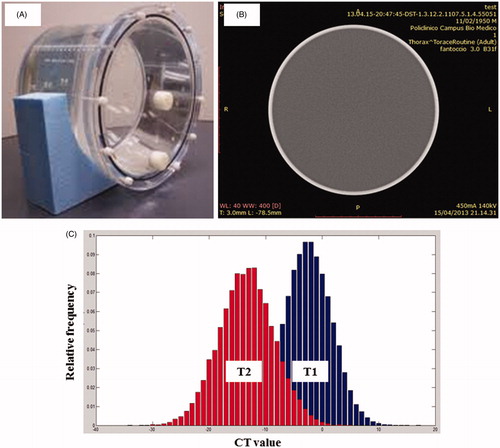
Periodic CT scanner calibrations are necessary to establish the characteristics of the X-ray signal as read by the detectors under scanning conditions; during this process the value of µH2O is determined from periodic scans of water or water-equivalent phantoms. The process of calibration begins with an initial scan performed on a solid circular cross-section phantom of homogeneous composition and density close to 1000 kg m−3 (). The resulting attenuation measurements are processed to give a stored calibration file, against which subsequent scans on other phantoms or patients will be compared. The file generated is a uniform field of values close to zero over the circular cross-section (). Relating attenuation values specifically to water is intended for producing a range of positive and negative integers for materials of clinical interest: this is the basis for image contrast. In the process of calibration a temperature increase results in a decrement of the mean CT number of the phantom, as shown in . The two histograms represent the distribution of CT values obtained by a slice of the phantom at two different temperatures (T2 > T1): the scan performed at T2 shows a histogram centered at a CT value lower than the one obtained at T1.
Figure 2. (A) Water calibration phantom, (B) CT-slice of the water phantom, (C) histograms of the CT values of water equivalent phantoms at two different temperatures (T2 > T1).
As long as attenuation coefficients are affected by beam energy, proper X-ray generator calibration is important for accurate and reproducible CT numbers.
In their study, Bydder and Kreel came to the conclusion that the temperature dependence of the attenuation value of water is a source of significant error [Citation15]. Experimentally, a difference of −6 to −5 HU between water attenuation values at room temperature (18 °C) and at body temperature (38 °C) was shown (i.e., a thermal sensitivity ≈−0.3HU/°C). This difference has to be taken into account during calibration procedures, allowing a proper determination of CT numbers for body tissues and fluids.
In order to compare their results to the ones obtained by other scientists, below exposure, reconstruction and analysis parameters are listed: 120 kVp, 33 mA, 65 s scan, wedge correction performed at 18 °C and a ROI of 64 000 pixels. From the ROI, the standard deviation (SD) of CT numbers was calculated, i.e. 0.37 HU.
Similar results were obtained by Fallone and Colleagues; they studied the relationship between CT numbers and temperature, in the range between 10 °C and 55 °C [Citation16]. The scan protocol employed for the experiments is the following: 120 kVp, 85 mA, 6 s scan. The acquired images were reconstructed with a slice thickness of 1.5 cm and a Field of View (FOV) of 32 cm. The CT numbers were area-averaged over a ROI of 2.76 cm2, containing 276 pixels, placed at the centre of the phantom. A thermosensitivity of −0.40 HU/°C was found, meaning that a temperature change of ± 1 °C corresponds to a CT number shift of about ±0.4 HU. Thus, they came to the conclusion that a fraction of HU is required in order to discriminate temperature less than 1 °C.
In the same period a Danish research team investigated the use of CT-based thermometry on a distilled water phantom heated from 20 °C to 50 °C [Citation29]. Scans were performed at 120 kV, 99 mA, 6 s scan time, a slice thickness of 10 mm and a smooth reconstruction filter. Calibrated multipoint thermocouples were used for temperature reference. A circular ROI containing 300 pixels was chosen for the mean CT number calculus. They proposed a three-step method in order to reduce the noise level in the resulting images. The relationship between CT number and temperature () was described with a second degree polynomial, obtaining a mean thermal sensitivity in the whole range of calibration of −0.32 ± 0.03 HU/°C at 37 °C. Noise filtering allowed obtaining encouraging results: a temperature precision of 0.5 °C and a spatial resolution of 4.2 mm.
Figure 3. CT number dependence on temperature of water. (A) Trend of CT value with temperature of distilled water phantom and parabolic curve fitting, adapted from [Citation29], (B) trend of CT value with temperature of water, adapted from [Citation18], (C) trend of CT value with temperature of water and linear fitting, adapted from [Citation22], (D) trend of CT value with temperature of different materials and linear fittings, adapted from [Citation26].
![Figure 3. CT number dependence on temperature of water. (A) Trend of CT value with temperature of distilled water phantom and parabolic curve fitting, adapted from [Citation29], (B) trend of CT value with temperature of water, adapted from [Citation18], (C) trend of CT value with temperature of water and linear fitting, adapted from [Citation22], (D) trend of CT value with temperature of different materials and linear fittings, adapted from [Citation26].](/cms/asset/0b82cb2f-83bc-4bff-85e4-0ee28e177eeb/ihyt_a_922221_f0003_b.jpg)
More recently, Jenne and coworkers confirmed the non-linear model, founding a calibration curve with a slope of −0.35 ± 0.01 HU/°C at 37 °C () [Citation18]. They employed a slice thickness of 0.8 cm, an acquisition time of 1.5 s per image, a 5 mm in diameter ROI. Water temperature was measured by fiber-optic probes.
The most recent study conducted on water and other materials comes from Bruners and Colleagues [Citation22]. CT scans were acquired with the following protocol: 140 kVp, 250 mAs, 1.2 mm collimation, 9.6 mm slice thickness. All image data were reconstructed applying a FOV of 300 × 300 mm, 512 × 512 reconstruction matrix and a B40f kernel (where B stands for Body, 4 for the resolution level, 0 for version number and f for fast scan mode). An optical temperature probe was used to monitor the temperature during the scans, i.e., 25–75 °C. The area-averaged CT number was measured using a 10 mm2 ROI placed centrally within the images. They presented a linear model to fit the experimental data, with a regression coefficient for thermal dependent change of CT number of −0.447 ± 0.004 HU/°C (). Their experiments show a temperature discrimination of 3–5 °C along with a spatial resolution of 2 mm.
The temperature influence on CT number of phantoms composed of other materials (i.e., epoxy resin, polyethylene, polystyrene-polypropylene mixture) has been investigated at temperatures from 15 to 40 °C [Citation26]. The scan protocol employed is the following: 120 kVp, 1200 mAs, 4 s scan time and 10 mm slice width. A neutral reconstruction kernel was applied and circular ROIs, 1 cm of diameter, placed centrally on images were chosen. Temperature was monitored with a thermocouple. For all materials the decrease of HU with temperature was shown and a linear model was proposed (). The phantoms showed different calibration lines because of the different density changes with temperature of the various materials. summarises the results obtained in the aforementioned studies on water-equivalent phantoms.
Table 1. Comparison between experimental parameters and results of different studies on water-equivalent phantoms.
CT-based thermometry in application of thermal treatments
As described in the section “Theoretical background”, the inverse correlation of HU with temperature increase can be employed to perform a temperature mapping during thermal procedures. The thermal sensitivity of the CT number depends on the tissue, as reported in Equations (3–5).
Several studies focused on the investigation of the thermal sensitivity of liver tissue. The first experiment date back to the late 1970s, when Bydder and Kreel [Citation15] examined samples of ex-vivo pig liver at different temperatures (e.g. 4 °C, 18 °C and 38 °C) and at the following CT settings: 120 kVp, 33 mA, 65 s scan, wedge correction performed at 18 °C and a ROI of 308 pixels. The method used to heat liver up to 38 °C is not reported by the authors, which found a decrease of CT number with temperature: 68.2 at 4 °C, 67.2 at 18 °C, and 62.4 at 38 °C.
Recent experiments on hepatic tissue conducted by Pandeya's research team aim to demonstrate the feasibility of CT-based thermometry during different thermal procedures. They firstly assessed the feasibility of CT thermometry during RF ablation on bovine liver tissue from 20 °C to 98 °C [Citation30]. During the procedure, simultaneous measurements of temperature using 5 calibrated thermocouples were performed. CT scans were acquired at 120 kVp, 200 mAs, a slice thickness of 1.2 mm, a FOV of 300 mm, and a temporal resolution of 250 ms. The images were reconstructed with a B31s kernel. Only images adjacent to RF probe and close to the tip of the thermal sensors were analysed to avoid metal artefacts. A circular ROI of 100 mm2 was placed close to the position of the thermocouples. The mean and standard deviation (SD) of ROI CT numbers were calculated: a sensitivity of −0.60 ± 0.02 HU/°C (R2 = 0.87) was found (). The SD observed in the measurements was used as an estimation of the CT noise (approximately 6 HU).
Figure 4. Trend of CT number as a function of temperature of different ex-vivo tissues. (A) Ex vivo bovine liver undergoing radiofrequency ablation, adapted from [Citation37], (B) ex vivo bovine liver undergoing LITT, adapted from [Citation31], (C) ex vivo porcine pancreas undergoing LITT, adapted from [Citation20].
![Figure 4. Trend of CT number as a function of temperature of different ex-vivo tissues. (A) Ex vivo bovine liver undergoing radiofrequency ablation, adapted from [Citation37], (B) ex vivo bovine liver undergoing LITT, adapted from [Citation31], (C) ex vivo porcine pancreas undergoing LITT, adapted from [Citation20].](/cms/asset/71b30e1b-9954-40c0-8c15-0c8a931e7e05/ihyt_a_922221_f0004_b.jpg)
They carried out a similar experiment on bovine liver undergoing LITT: the sample was heated from 18 °C to 85 °C using the laser applicator with increasing power [Citation31]. During the treatment, 5 calibrated thermocouples were inserted within the tissue to record temperature. CT examinations were performed in a sequential mode using 120 kVp, 200 mAs and a rotation time of 500 ms. The reconstruction parameters are: a slice thickness of 1.2 mm, a field of view (FOV) of 300 mm and a B31s smooth kernel. Circular ROIs with an area of 100 mm2 were placed around the tip of the 5 thermocouples and the average CT number and SD were calculated from each ROI. The regression analysis () shows an inverse linear dependence of the average CT number on temperature with a sensitivity of −0.65 ± 0.05 HU/°C (R2 = 0.78).
After the feasibility assessment of CT thermometry during RF and LITT, the same research group investigated the thermosensitivity during heating of ex-vivo porcine liver by passage of hot air through a plastic tube [Citation19]. The experimental set-up is the same as the previous ones, with 5 calibrated thermocouples inserted into the tissue, apart from the hot tube replacing RF probe or laser fibre. CT parameters remained unchanged except for the FOV size not reported and a smaller ROI of 21 mm2 around the tip of the thermal sensors. It was shown that noise increased with temperature from 2 HU at 17 °C to 14 HU at 90 °C, maybe because of the protein denaturation at high temperature. These noise levels are not compatible with the possibility for CT thermometry of providing 1–2 °C as temperature precision. To increase precision, the authors suggest improving CT image quality and using non-metallic thermal sensors. The results established a linear model for CT numbers dependence on temperature with a thermal sensitivity of −0.54 ± 0.03 HU/°C (R2 = 0.91) in the range from 17 °C up to 90 °C.
Bruners et al. tried to employ CT thermometry during in-vivo experiments on porcine liver specimens undergoing RF [Citation32]. They used three optical temperature probes and the CT scan protocol was the following: 120 kVp, 320 mAs and 500 ms rotation time. After raw data acquisition, a soft tissue kernel B40s and a 512 × 512 matrix were used for reconstruction of the images with a slice thickness of 2.4 mm. Data analysis was done with a circular ROI of 0.5 cm2 around the tip of each thermal probe. The regression procedure confirmed the theoretical model and a sensitivity of −0.43 HU/°C was found.
In order to compare the results from the aforementioned experiments, thermal sensitivity and CT scan and reconstruction parameters are summarised in .
Table 2. Comparison between experimental parameters and results of different studies on ex vivo and in-vivo tissues.
The difference in thermosensitivity values can be attributed to different protocols, individual composition of liver tissue, different heating procedures, inter- and intra-scanner variability of CT numbers and the so-called partial volume effect, which can give rise to unreliable CT numbers when ROIs include tissue components with highly different attenuation coefficients [Citation33]. A further cause of the aforementioned difference might be related to eventual misalignments between the ROI and the sensors employed to obtain the reference temperature.
More precise information is needed about scan protocols and reconstruction parameters. By increasing tube voltage (kVp) and tube current-time product (mAs) the value of SNR increases and, thus, noise contribution to CT number measurement decreases, as reported by Bruners and coworkers [Citation22]. Nevertheless, patient dose raises with kVp and mAs, therefore a trade-off between patient exposition levels and image quality is desirable.
Another parameter affecting CT number measurements is ROI dimension: it was first evaluated by Fallone et al. [Citation16].The choice of the proper ROI size is conditioned by two factors: the first is the spatial resolution, strictly depending on the ROI size. As a matter of fact, during thermal therapies the scanner would detect small tissue-density changes to ideally obtain a punctual temperature mapping. On the other hand the precision of area-averaged CT number measurements is influenced by ROI dimensions. In their experimental results, it was shown that any improvement in the spatial resolution with reducing area of interest leads to simultaneous degradation in measurement precision and vice versa.
New studies are focusing on the introduction of LITT for pancreas treatment [Citation34,Citation35]. The CT-based thermometry has been employed to monitor pancreatic tissue temperature during LITT by our research group [Citation20,Citation36]. The reference temperature has been measured by 12 Fiber Bragg Grating sensors (FBG sensors) positioned at different distances from the laser applicator. CT scans have been acquired with the following protocol: 120 kVp, 150 mAs and 0.6 mm of slice thickness. Circular ROIs of 0.02 cm2, about 58 pixels, centred where the sensors are placed, have been chosen to calculate average CT number. Statistical analysis has been performed and both a linear and a quadratic curve have been fitted to obtain the relationship between CT numbers and temperature synchronised values. A mean thermal sensitivity of −0.50 HU/°C in the temperature range of 20–60 °C has been found. However, the linear model did not take into account the dependence of sensitivity on temperature. As a matter of fact, it was demonstrated that the quadratic fitting better agrees with experimental data than the linear model as shown in .
A similar non-linear model can lead to new perspectives for CT thermometry and further studies are needed to establish a scan protocol suitable for temperature monitoring on liver and pancreas.
Conclusion
The potential of CT for non-invasive temperature measurement was pointed out by different authors since the late 1970s: it was considered useful in local tumour ablation. However, at that time the repeatability of quantitative CT number measurements was not guaranteed, hampering the use of this method.
Modern CT scanners provide fairly stable CT numbers thus, researchers have been recently restarted with the aim of pushing CT thermometry a step forward.
The goal of the present review was to provide a summary on existing knowledge of this promising technique, drawing particular attention to calibration phantom materials and to ex vivo biological tissues.
CT number thermal shift of water and other phantom materials was assessed: these results are relevant to calibration purposes in the proper determination of the reference value µH2O.
Regarding biological materials, liver and pancreas went under investigation, and showed different calibration curves. As shown in , different groups of research have employed either linear calibration curve or parabolic one; moreover the thermal sensitivity depends on the organ () according to the thermal properties of the specific material.
The thermal sensitivity of the specific tissue allows estimating temperature distribution during the ablation process: the measured CT number shifts were translated into a colour-coded temperature map by Pandeya and his colleagues to provide a fairly real-time temperature information of the ablation area [Citation37].
From the experimental results it can be deduced that CT thermometry has reached good performances: a spatial resolution of 1.2 mm, a temperature precision of 3–5 °C and an acquisition time of 500 ms.
Further studies are requested in order to systematically analyse the influencing factors on CT-based thermometry, i.e. ROI dimensions, scan parameters, spatial resolution, reconstruction kernel, etc., and to demonstrate if better levels of thermal-spatial detail could be achieved, along with low patient radiation dose. We think that a measurement accuracy of about 2 °C and a spatial resolution in the order of 1 mm must be fulfilled in order to spread CT-based thermometry in thermal ablation.
Further research must be carried out in order to assess the feasibility of CT-based thermometry during in vivo trials; in particular, physiological effects (e.g. increased local blood perfusion at elevated temperatures) will have to be taken into account as they may cause an atomic composition change in living subjects, contributing to a CT number shift. In addition, further studies are requested in order to quantify and limit the radiation exposure caused by CT thermometry.
The introduction of CT-thermometry in clinical practice to improve the effectiveness of the thermal treatment is just at the beginning, but the improvement of CT technology, the development of innovative filters and data reconstruction algorithms, and the chance to employ this technique on tissue (e.g. fat) where MR-thermometry is prone to inaccuracy [Citation38] make its exploitation attractive. Future study will take into account the dependence of CT values on temperature, to precisely monitor tissue denaturation and coagulation during thermal treatments by CT images [Citation39].
Declaration of interest
The authors report no declarations of interest.
References
- Saccomandi P, Schena E, Silvestri S. Techniques for temperature monitoring during laser-induced thermotherapy: An overview. Int J Hyperthermia 2013;29:609–19
- Yanof J, Bauer C, Renisch S, Krucker J, Sabczynski J. Image-guided therapy (IGT): New CT and hybrid imaging technologies. Advances in health care technology care shaping the future of medical care. Netherlands: Springer; 2006
- Goldberg SN, Dupuy DE. Image-guided radiofrequency tumor ablation: Challenges and opportunities – Part I. J Vasc Interv Radiol 2001;12:1021–32
- Vogl TJ, Eichler K, Straub R, Engelmann K, Zangos S, Woitaschek D, et al. Laser-induced thermotherapy of malignant liver tumors: General principals, equipment(s), procedure(s) – side effects, complications and results. Eur J Utrasound 2001;13:117–27
- On SL, Gravante G, Metcalfe MS, Strickland AD, Dennison AR, Ashley R, et al. Efficacy and safety of microwave ablation for primary and secondary liver malignancies: A systematic review. Eur J Gastroenterol Hepatol 2009;21:599–605
- Crouzet S, Murat FJ, Pasticier G, Cassier P, Chapelon JY, Gelet A. High intensity focused ultrasound (HIFU) for prostate cancer: Current clinical status, outcomes and future perspectives. Int J Hyperthermia 2010;26:796–803
- Sandison GA, Loye MP, Rewcastle JC, Hahn LJ, Saliken JC, McKinnon JG, et al. X-ray CT monitoring of ice ball growth and thermal distribution during cryosurgery. Phys Med Biol 1998;43:3309–24
- Choueiri TK, Schutz FAB, Hevelone ND, Nguyen PL, Lipsitz SR, Williams SB, et al. Thermal ablation vs. surgery for localized kidney cancer: A surveillance, epidemiology, and end results (SEER) database analysis. Urology 2011;78:93–8
- Huang L, Han Y, Zhao J, Wang X, Cheng Q, Li X, et al. Is radiofrequency thermal ablation a safe and effective procedure in the treatment of pulmonary malignancies? Eur J Cardiothoracic Surg 2011;39:348–51
- Cooperberg MR, Mallin K, Kane CJ, Carroll PR. Treatment trends for stage I renal cell carcinoma. J Urology 2011;186:394–9
- Stauffer PR, Goldberg SN. Introduction: Thermal ablation therapy. Int J Hyperthermia 2004;20:671–7
- Cetas TC, Connor WG. Thermometry considerations in localized hyperthermia. Med Phys 1978;5:79–91
- Bowman RR. A probe for measuring temperature in radiofrequency-heated material. IEEE Trans Microw Theory 1976;24:43–5
- McDannold N. Quantitative MRI-based temperature mapping based on the proton resonant frequency shift: Review of validation studies. Int J Hyperthermia 2005;21:533–46
- Bydder G, Kreel L. The temperature dependence of computed tomography attenuation values. J Comput Assist Tomogr 1979;3:506–10
- Fallone B, Moran P, Podgorsak E. Noninvasive thermometry with clinical x-ray scanner. Med Phys 1982;9:715–21
- Mahnken A, Bruners P. CT thermometry: Will it ever become ready for use? Int J Clin Pract 2011;65:1–2
- Jenne J, Bahner M, Spoo J, Huber P, Rastert R, Simiantonakis I, et al. CT on-line monitoring of HIFU therapy. Proceedings of IEEE Ultrasonics Symposium, Toronto, 1997. pp 1377–80
- Pandeya G, Greuter M, Schmidt B, Flohr T, Outkerk M. Assessment of thermal sensitivity of CT during heating of liver: An ex vivo study. Br J Radiol 2012;85:661–5
- Schena E, Saccomandi P, Giurazza F, Caponero MA, Mortato L, Di Matteo FM, et al. Experimental assessment of CT-based thermometry during laser ablation of porcine pancreas. Phys Med Biol 2013;58:1–12
- Frich L. Non-invasive thermometry for monitoring hepatic radiofrequency ablation. Minim Invasiv Ther Allied Technol 2006;15:18–25
- Bruners P, Levit E, Penzekofer T, Isfort P, Ocklenburg C, Schmidt B, et al. Multi-slice computed tomography: a tool for non-invasive temperature measurement? Int J Hyperthermia 2010;26:359–65
- Mahnken A, Raupach R, Wildberger J, Jung B, Heussen N, Flohrr T, et al. A new algorithm for metal artefact reduction in computed tomography: In vitro and in vivo evaluation after total hip replacement. Invest Radiol 2003;38:769–75
- Manduca A, Yu L, Trzasko JD, Khaylova N, Kofler JM, McCollough CM, et al. Projection space denoising with bilateral filtering and CT noise modeling for dose reduction in CT. Med Phys 2009;36:4911–9
- Tsalafoutas IA, Tsapaki V, Triantopoulou C, Gorantonaki A, Papailiou J. CT-guided interventional procedures without CT fluoroscopy assistance: Patient effective dose and absorbed dose considerations. Intervent Radiol 2007;188:1479–84
- Homolka P, Gahleitner A, Nowotny R. Temperature dependence of HU values for various water equivalent phantom materials. Phys Med Biol 2002;47:2917–23
- Li M, Abi-Jaoudeh N, Kapoor A, Kadoury S, Xu S, Noordhoek N, et al. Towards cone-beam CT thermometry. Proc SPIE 2013;8671:1–7
- Ge W, Frei T, Vannier MW. Fast iterative algorithm for metal artifact reduction in X-ray CT. Acad Radiol 2000;7:607–14
- Bentzen S, Overgaard J, Jorgensen J. Isotherm mapping in hyperthermia using subtraction X-ray computed tomography. Radiother Oncol 1984;2:255–60
- Pandeya G, Greuter M, de Jong K, Schmidt B, Flohr T, Outkerk M. Feasibility of noninvasive temperature assessment during radiofrequency liver ablation on computed tomography. J Comput Assist Tomogr 2011;35:356–60
- Pandeya G, Klaessens H, Greuter M, Schmidt B, Flohr T, Hillegersberg R, et al. Feasibility of computed tomography based thermometry during interstitial laser heating in bovine liver. Eur Radiol 2011;21:1733–8
- Bruners P, Pandeya GD, Levit E, Roesch E, Penzkofer T, Isfort P, et al. CT-based temperature monitoring during hepatic RF ablation: Feasibility in an animal model. Int J Hyperthermia 2012;28:55--61
- Berland LL. Practical CT – Technology and techniques. New York, NY: Raven Press; 1987
- Saccomandi P, Schena E, Di Matteo FM, Pandolfi M, Martino M, Rea R, et al. Laser interstitial thermotherapy for pancreatic tumor ablation: Theoretical model and experimental validation. Conf Proc IEEE Eng Med Biol Soc 2011:5585–8
- Saccomandi P, Schena E, Caponero MA, Di Matteo FM, Martino M, Pandolfi M, et al. Theoretical analysis and experimental evaluation of laser induced interstitial thermotherapy in ex vivo porcine pancreas. IEEE Trans Biomed Eng 2012;59:2958–64
- Schena E, Saccomandi P, Giurazza F, Del Vescovo R, Mortato L, Panzera F, et al. Monitoring of temperature increase and tissue vaporization during laser interstitial thermotherapy of ex vivo swine liver by computed tomography. Conf Proc IEEE Eng Med Biol Soc 2013:378–81
- Pandeya G, Greuter M, de Jong K, Schmidt B, Flohr T, Outkerk M. Feasibility of noninvasive temperature assessment during radiofrequency liver ablation on computed tomography. J Comput Assist Tomogr 2011;35:356–60
- Weiss N, Sosna J, Goldberg SN, Azhari H. Non-invasive temperature monitoring and hyperthermic injury onset detection using X-ray CT during HIFU thermal treatment in ex vivo fatty tissue. Int J Hyperthermia 2014;30:119–25
- Weiss N, Goldberg SN, Sosna J, Azhari H. Temperature-density hysteresis in X-ray CT during HIFU thermal ablation: Heating and cooling phantom study. Int J Hyperthermia 2014;30:27--35