
Abstract
Purpose: This paper investigates the thermal conditions inside a passenger car driven after it was left a few hours in a shade-less parking lot, and the related implications for the driving performance. Materials and methods: Experimental results for twelve tests carried out in four different vehicles are presented and discussed. Each test is characterized by means of the predicted core temperature tcore of the driver after 60 minutes, as calculated by a heat stress model. The fractional performance loss is calculated by adjusting existing algorithms for office tasks to accommodate literature data on driving-related tasks, and then re-casting the algorithm as a function of tcore instead of the air temperature ta. Results: Based on measured temperatures and humidities, fractional performance losses up to 50% are predicted even for relatively simple tasks such as keeping the vehicle on a straight course. Performance losses in excess of 75% are predicted, under the most extreme thermal conditions, for demanding tasks, such as correctly identifying a signal and reacting in due time. Conclusions: The implementation in technical standards on heat stress assessment of two new thresholds is recommended. The lower threshold, to be set at tcore ≅ 37.1 °C, is aimed at ensuring that the subject is able to carry out demanding mental tasks without appreciable performance loss, while the higher threshold, to be set at tcore ≅ 37.2 °C applies to simpler tasks.
Introduction
Temperatures inside vehicles left in the sun during summer months have been extensively surveyed [Citation1–5] and are well known to reach extremely large values, often in excess of 65 °C. When driving a car just after such extreme conditions, the driver is at least initially exposed to a severe thermal environment characterized by very high air and radiant temperatures. Although the thermal environment severity in the vehicle drops due to declining air temperature associated to the inflowing outdoor air, radiant temperatures remain significantly larger than air temperatures for some time, since interior surfaces do not cool as quickly.
Because driving implies a high-level of concentration, it is mandatory that this task is carried out in the best physical conditions. Three questions that this study tries to answer in this context are:
Does the driving-related exposure lead to some measurable thermal stress?
Even if no actual stress takes place, are departures from homeostasis strong enough and sustained for long enough periods to result in significant performance loss, that is to impair its ability to react to unpredictable events?
What is a possible thermal threshold whose implementation could prevent significant decrements of mental cognitive performance?
The study consists of three parts: in the first part, the evolution of the thermal environment inside a car, when driven after a prolonged exposure in a sunny parking lot, has been investigated. In the second part, the driver’s thermal stress has been evaluated and assessed using the PHS thermal model [Citation6]. Finally, in the third part, predictive algorithms for the driver’s performance loss have been developed, and a new thermal threshold for cognitive tasks established.
Materials and methods
Twelve measurements have been carried out from early July 2013 to early September 2013. In order to focus on worst case scenarios, tests have been planned only on sunny days, with clear skies and high-temperatures already in the morning hours. Experimental tests have been run according to the following sequence:
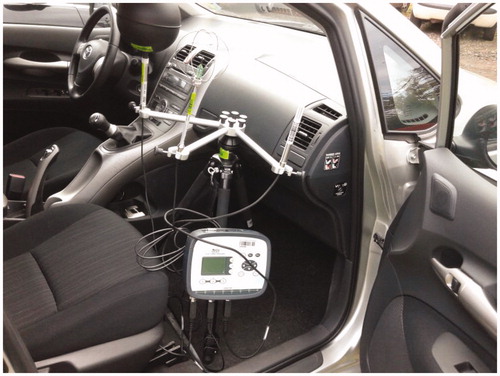
A data logger is positioned on the vehicle’s passenger seat. The data logger is connected to a psychrometer, a globe thermometer and an anemometer (), providing simultaneous measurements of the air temperature (ta), mean radiant temperature (tr), air velocity (va) and relative humidity (RH).
The vehicle is initially taken from a sheltered area (a garage) and driven to a sunny area, where it is parked around 8.30 am.
All doors and windows are closed and the measurement starts around 9.00 am.
The front door is opened around 2.30 pm. The subject gets into the car, opens both front windows and starts driving, all within 90 seconds.
The vehicle is driven through the city streets for 15–20 minutes, and subsequently parked again, at which time the measurement stops.
All measurements have been carried out using a Delta Ohm model 32.1 (Padua, Italy) data logger tracking the time evolution of the four environmental quantities ta, tr, va and RH, with a time resolution of 15 seconds. Simultaneous measurements of the outdoor air temperature, relative humidity and air velocity have also been carried out using a LSI Babuc model BSA010 (Milan, Italy) data logger. In order to take into account the different characteristics of tested vehicles with respect to glass surface, absorption of solar radiation and interior materials, measurements have been taken in four different vehicles.
Figure 1. Experimental set-up.
Results
Evolution of environmental quantities
shows the time evolution of the air temperature inside the vehicle in all twelve tests, identified by their date (format: month_day). Without air conditioning, the speed at which the vehicle interior cools down is dictated by: (a) the outdoor temperature; (b) the air inflow associated to the vehicle motion. The latter is however limited because of the low vehicle speed forced by the city traffic.
Figure 2. Time evolution of the air temperature in the vehicles, for all the 12 tests performed. Legend: test date (month_day).
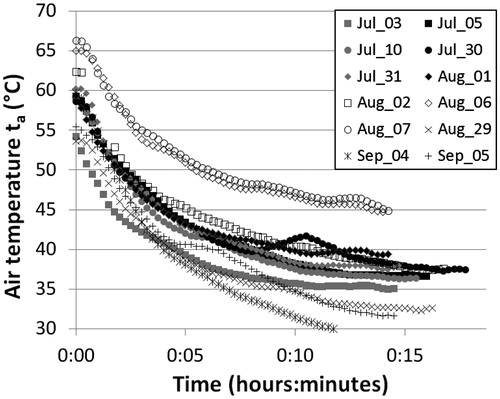
All cooling tracks share the same general trend: cooling is initially very fast, but rapidly slows down, asymptotically approaching equilibrium between heat gains and losses that is constant temperature. Most tracks starts in the 55–60 °C range, and settle between 30 °C and 40 °C. Two tracks, both corresponding to tests carried out in the first week of August, start around 60 °C but their decline is limited to about 45 °C.
The time evolution of the air temperature ta in the vehicle has been approximated using the simple analytical function:
where T is time, t0 is the initial temperature, t∞ is the asymptotic temperature, that is the limit temperature for T→∞, and τ is the cooling timescale.
summarizes the values of t0, t∞, τ for all the experimental datasets, along with the mean outdoor air temperature tout during the driving time. The last column of shows the r.m.s. of departures of the fit from experimental data σ(ta). Such departures are mostly due to randomly variable sunlight/shade transitions and/or traffic conditions, which strongly affect the radiant load on the vehicle roof and glasses as well as the wind velocity inside the vehicle itself. Instrumental uncertainty is a minor contribution. The values of σ(ta) range between 0.20 °C and 0.52 °C, apart from two cases where they reach values of order 0.8 °C to 0.9 °C. Considering the very simple nature of model (1), these r.m.s. departures are surprisingly small. also shows that the asymptotic temperature t∞ is usually a few degrees warmer than the measured outdoor temperature.
Table 1. Synthesis of test results: tout is the mean outdoor air temperature (measured), t0 is the initial air temperature inside the vehicle (measured), t∞ is the asymptotic air temperature, i.e. the limit temperature for time→∞, inside the vehicle (predicted), τ is the cooling timescale, σ is the r.m.s. of departures of the fit to the air temperatures inside the vehicle from experimental data.
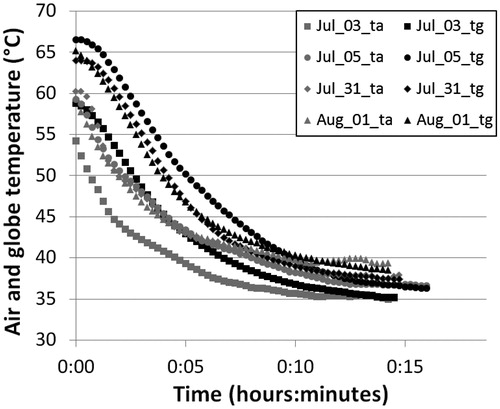
compares the time evolution of globe and air temperatures for four selected tests, again identified by their date (format: month_day). All tests follow a typical pattern: the globe temperature is initially a few degrees higher than the air temperature; the gap progressively narrows down, becoming negligible after a few (generally 5–10) minutes. This behaviour is clearly related to the thermal inertia of the vehicle interior, which cools down more slowly than air.
Figure 3. Time evolution of the air temperature ta and the globe temperature tg in the vehicles, for four selected tests. Grey symbols: ta; black symbols: tg. Legend: test date (month_day).
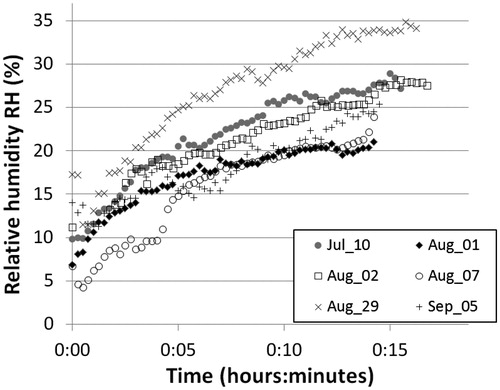
Finally, shows the time evolution of the relative humidity inside the vehicles, for six selected tests. Values range between 5% and 35%, which correspond to 1.0 to 2.1 kPa absolute water vapour pressure. The rising trend is due to the declining trend of the air temperature, while absolute humidity (water vapour pressure) remains roughly constant.
Figure 4. Time evolution of the relative humidity in the vehicles, for all the 12 tests performed. Legend: test date (month_day).
Evolution of physiological quantities
Because the thermal environment investigated in this study has a strongly transient nature, it cannot be described by a single “average” value of the air temperature, WBGT or any other synthetic index-based on environmental quantities. The time-integrated exposure is on the opposite best characterized by physiological quantities, such as the core temperature tcore, whose time evolution is much slower. Additionally, detrimental effects on the driver’s vigilance, alertness and performance are undoubtedly more directly associated to his/her physiological parameters rather than to the environmental parameters [Citation11], whose impacts on mental performance are mediated by the body’s response to heat stress. This topic will be elaborated upon in more detail in the following section.
The thermal evolution of the subject’s main physiological parameters in response to the quickly changing thermal conditions in the vehicle interior has been simulated using the Predicted Heat Strain (PHS) model [Citation6,Citation7]. The PHS model predicts the sweat rate and the rectal temperature for an average subject and determines Durations Limit of Exposure (DLE) to protect 50% and 95% of the population. The model includes original algorithms based on the scientific literature and some new researches, concerning the convective and evaporative exchanges, the skin temperature, the skin–core heat distribution, the rectal temperature, the evaporation efficiency, the maximum sweat-rate, maximum dehydration and maximum increase in core temperature [Citation7]. Predictions were extensively validated by comparison with more than 600 laboratory experiments and more than 200 field experiments [Citation8]. The PHS model assumed the knowledge of four environmental quantities: air temperature, mean radiant temperature, air velocity and relative humidity. A slightly modified version of the PHS model has been developed in this work, to accommodate time-dependent environmental data. Input quantities are now carried into the code from a database built upon the experimental information collected by the data logger, instead of being fed to the code by the user as constants.
Besides thermo-hygrometric quantities, three additional quantities need to be specified in the PHS model: the subject’s clothing thermal resistance Icl, the metabolic activity M, and the subject’s physical characteristics (height H and mass W). With regard to the latter three quantities, the following assumptions have been made:
Thermal resistance results from two separate contributions: (a) the driver’s garments; (b) the contact with the seat back. Contribution (a) has been estimated at 0.6 assuming standard summer clothing as given in ISO 9920 [Citation9]. As for contribution (b), we use the value of 0.25 clo which is quoted by ISO 9920 (§ 9.3) for a manikin with a winter clothing ensemble (Icl = 1.36 clo). Because this figure takes into account the reduction of insulation due to clothing compression by the seat [Citation9], it is probably an underestimate for a summer clothing ensemble, where inter-layer air insulation plays a minor role. So by using a total thermal resistance of 0.85 clo we are likely introducing a slight underestimation in our predictions of tcore;
Metabolism has been set at 1 met [Citation10], as appropriate for a seated individual with just minor upper body activity;
The subject’s height and mass have been set at 1.75 m and 70 kg respectively.
The relatively short exposure duration implies that dehydration plays a minor role. Accordingly, all simulations have been run to track the time evolution of the rectal temperature (tre), to spot any hypothetical signs of hyperthermia. Sixty-minute simulations were carried out, as asymptotic limits were always achieved within such time spans. In other words, the air temperature does not show any significant variation in the last 20 of the 60 minutes of the simulation. Since the test duration was 15–20 minutes, only input data for the first 15 minutes are actual measurement results. For the following 45 minutes, the following assumptions have been made:
air temperatures are extrapolated using the best fits shown in ;
mean radiant temperatures are identical to air temperatures;
air velocities are randomly selected from distributions with the same mean and the same standard deviation of data measured in the first 15 minutes;
relative humidities are calculated requiring that the absolute humidity is kept constant at a value given by the mean of the last 5 minutes of measurements (10–15 minutes from the test start).
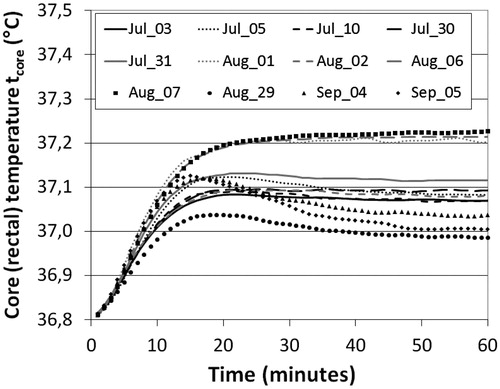
shows time evolution of the driver’s rectal temperature, as predicted by the thermal model. Each test is again identified by the test date (format: month_day), as in . Because of the severe thermal conditions inside the vehicles, the rectal temperature rises immediately after the exposure starts, and keeps climbing for the first 15–20 minutes from the initial value of 36.8 to 37.0–37.2 °C. The rectal temperature then stabilizes or drops slightly (less than 0.1 °C). Despite its marked increase during the test, humidity remains low enough that evaporation is only marginally affected. Humidity has therefore a minor impact on the core temperature evolution. However, this is likely to change in tropical climates, where relative humidities are expected to be much higher. Such conditions have not been investigated here.
Figure 5. Time evolution of the driver’s core (rectal) temperature during the first sixty minutes of driving, as predicted by the thermal model. Legend: test date (month_day).
Impact of heat stress on driving performance
Physiology of performance loss
The detailed relationship between thermoregulatory changes and performance is complex. According to the maximal adaptability model [Citation11], performance is largely unaffected as long as environmental conditions allow thermal comfort to be established, or when cognitive adjustments to task demands can be accomplished. If environmental conditions are more demanding, physiological adaptability cannot maintain homeostasis, and dynamic changes in physiological parameters (particularly tcore and to a lesser extent tskin) occur. Specifically, during the first minutes of exposure, there is a significant reduction of the temperature gradient between the core and the skin, so that the heat transfer from the core to the skin becomes more inefficient [Citation12,Citation13]. This results in the depletion of cognitive resources results, and in a progressive decline of performance efficiency. Heat stress can produce detrimental effects on motor response, and since most cognitive tasks require a motor response, some cognitive deficiencies may be attributed to decreased motor performance [Citation14]. The association between tcore (and/or its rate of change) and performance loss thus appears to be theoretically well established [Citation11,Citation12] and corroborated by several experimental studies [Citation15–17].
The skin temperature is also widely recognized as playing a significant role in performance loss [Citation18]. It is very hard to separate the impact that tcore and tskin have on performance, as their time evolutions share the same qualitative features [Citation18,Citation19]. However tcore is more stable in time than tskin, it does not suffer from spatial fluctuations that characterize tskin and it is a monotonic function of the thermal-load experienced by the subject from neutral conditions to the most extreme stress, which is likely not the case for tskin. For these reasons we selected tcore as the most appropriate, although by no means the only possible, descriptor of performance loss under moderately stressing thermal conditions.
Substantial evidence also exists that mental tasks are differentially sensitive to thermal stress [Citation11]. The different limits proposed for different activities [Citation11] are expressed in terms of the “dynamic rise” of tcore, a quantity that takes into account both the increase and the rate of change of this quantity. More recent studies confirm that vigilance is more vulnerable to thermal stress [Citation20], and that reaction times are longer for hyperthermic subjects [Citation21,Citation22], though the latter work also found the accuracy rate to be unaffected.
As a general rule, hyperthermia exerts more deleterious effects on complex than simple cognitive tasks [Citation22,Citation23]. For complex tasks the effect was found to be significant even at relatively moderate hyperthermia (tcore < 37.5 °C), particularly in the case of a rapid increase of the body temperature [Citation23].
Predictive algorithms: driving-related task performance versus core temperature
There are very few studies of performance loss for driving-related tasks. Compelling evidence of lower alertness, implying a higher chance of missing signals, and slower responsiveness, implying longer reaction times and higher accident rates, was found by Wyon et al. [Citation24] and Daanen et al. [Citation25]. The fact that significant effects were found already at ta = 27 °C [Citation24] is a strong warning that the demanding mental tasks involved in driving can be affected even under very moderate thermal conditions. Results obtained for aircraft pilots’ vigilance [Citation15] show that performance is largely unaffected until the core temperature increases by about 1 °C above its baseline. The significance of this latter study for our work is however questionable, since it deals with a highly specific population of young and physically fit subjects.
No algorithm exists which allows the performance loss for driving-related tasks to be predicted from environmental or physiological data. A large amount of information exists on the opposite on the thermal comfort-productivity relation for office tasks. An excellent synthesis is provided in the paper by Seppänen et al. [Citation26]. In order for such data to be applicable in this paper’s context, three adjustments have been made:
The air temperature has first been converted into a core (rectal) temperature. This has a two-fold motivation: (a) mental efficiency is more directly linked to the subject’s physiological conditions, quantified by the core temperature tcore, rather than to environmental quantities (ta) [Citation11]; (b) as anticipated in a previous section, the thermal environment investigated in this study has a strongly transient nature, and as such it cannot be described by a single “average” value of the air temperature. The vast majority of laboratory studies have on the opposite been performed under static conditions, which has allowed results to be generally given in terms of air temperature or WBGT and exposure time. This however provides only indirect information, hiding the direct link that exists between physiological parameters and indicators of performance/vigilance/alertness. Conversion from environmental quantities to core temperatures has been carried out by running the PHS code for a few temperatures in the (22–35 °C) range, while adjusting relative humidity to give a constant water vapour pressure of 1.32 kPa (which corresponds to RH = 50% at ta = 22 °C). Conditions typical of office summer environments (tr = ta, va = 0.1 m/s, M = 1 met, Icl = 0.6 clo) were assumed for the other variables.
An extrapolation to higher temperatures has been performed in order to accommodate air temperatures often in excess of 35 °C. Unfortunately the original 3rd order polynomial fit [Citation26] could not be used for this purpose, as it displayed a strongly non-monotonic behaviour.
The simple functional form
where
In equations (2) and (3) P is the performance as a function of the core temperature, P0 is the unimpaired performance, and t0 is the rest core temperature (37 °C). The model’s only free parameter is the thermal scale length A. The best fit to the experimental data gives A = 0.257 °C. Seppänen et al.’s original data have therefore been re-cast in the form
A scaling function has been identified in order to fit the functional form (2) to data on the performance loss for driving-related tasks [Citation24,Citation25]. The percentage of signals correctly identified is 84% under ideal thermal conditions (ta = 21 °C), and drops to 76% for ta = 27 °C [Citation24]. This corresponds to a 10% performance loss, which is twice as big as the figure of 5% given for office tasks [Citation26] for the same temperatures. As for reaction times, these were found to increase by 22% for the same temperatures [Citation24], which implies a 20% performance loss, a further factor of 2 larger than in office tasks. The detrimental effect of high-temperatures on the driving performance was also confirmed in a more recent study [Citation25], where subjects were asked to drive so to stick to the middle of the lane as much as they could. Performance was quantified by means of the standard deviation of the lateral position of the car. A performance loss of 13% was found to be associated to a temperature increase from 20 °C (nearly ideal conditions) to 35 °C. The size of the effect is significantly smaller than in [Citation24], presumably because of the simpler test involved.
The final result has been cast in the form of two curves: the upper curve
is based on data presented in [Citation25] (simple driving tasks); the lower curve
is based on data presented in [Citation24] (more demanding tasks). In both equations P = P0, that is performance is unaffected, when tcore < 37 °C.
shows the performance as predicted by Equations (5a) and (5b). The curve based on these two equations tentatively bracket the predicted performance for the existing wide range of driving-related tasks. Performance data for office tasks [Citation26] are also shown. It must be stressed though that rescaling of equation (4) to fit driving-related data, is inevitably prone to large uncertainties, given that there is a strong sensitivity to the specific tasks carried out, and that only one temperature difference has been investigated in each study [Citation24,Citation25].
Figure 6. Predicted relative performance as a function of the driver’s core temperature. Solid curve: demanding tasks; dashed curve: simple tasks; dots: literature experimental data for office tasks [Citation25].
![Figure 6. Predicted relative performance as a function of the driver’s core temperature. Solid curve: demanding tasks; dashed curve: simple tasks; dots: literature experimental data for office tasks [Citation25].](/cms/asset/a3f04247-fd5f-4057-92f0-a57b6aa6fffe/ihyt_a_922222_f0006_b.jpg)
summarizes, for each experimental test, the mean outdoor temperature measured, the core (rectal) temperature after 60 minutes of driving predicted using the PHS thermal model, and the associated values of the driving performance calculated using equations (5a) and (5b). Core temperatures reached while driving in the warmest summer days (tre ≅ 37.2 °C) imply performance losses of order 40 to 50% for simple tasks, and up to 85% for more demanding tasks.
Table 2. Predicted relative performance in driving-related tasks during experimental tests: tout is the mean outdoor air temperature (measured), tcore the core (rectal) temperature after 60 minutes of driving (predicted). Performance is set equal to 1 under ideal thermal conditions.
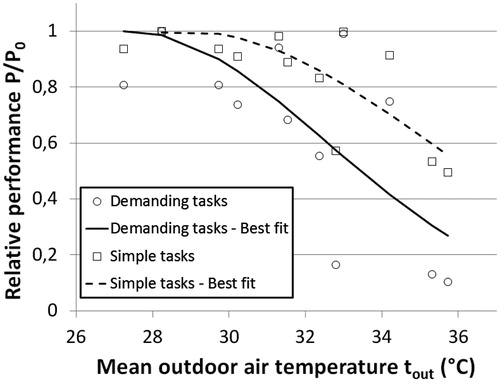
Predictive algorithms: driving-related task performance versus outdoor temperature
Despite being recognized as the most accurate predictor of performance loss, the core (rectal) temperature is hardly amenable to field measurements or predictions. A more useful quantity in this respect is the outdoor temperature at the time of driving, which is not only very easy to measure, but also readily available in meteorological forecasts. In order to provide simple analytic approximations, the same functional form previously used for the core temperature (Equation 2) has again been assumed. Best fits to the experimental datasets have been found to give
for simple driving-related tasks, and
for more demanding tasks. In both equations y is set to 0 when the term inside the bracket becomes negative.
shows the values of the relative performance (P/P0) based on the values of tcore predicted from our environmental measurements (Equation 5a = squares/Equation 5b = dots), as well as the best fitting curves given by Equations (6a) and (6b). shows that the association between performance and outdoor temperature is rather loose. The fits’ quality is mediocre (r2 = 0.47 for equation (6a), r2 = 0.57 for Equation (6b)), but this is far from unexpected given that the outdoor temperature is just one of several quantities which contribute to the indoor thermal conditions which in their turn determine the driver’s performance.
Figure 7. Predicted relative performance as a function of the outdoor air temperature. Circles: demanding tasks; squares: simple tasks. Solid curve: best fit for demanding tasks; dashed curve: best fit for simple tasks.
Heat stress and driving tasks–possible new thresholds
Working in a hot environment is well known to create physiological alterations, and predictive models of thermal stress have been developed for more than 60 years [Citation27,Citation28]. Current occupational heat stress criteria are not unexpectedly based on the requirements that neither the core temperature nor the fluid loss exceed their respective limits [Citation6,Citation7]. While the emphasis on physical fitness and health is thoroughly justified, other issues should not be overlooked. More specifically, the physical discomfort caused by a moderate increase in the body core temperature promotes irritability, anger, and other emotional states which may cause individuals to overlook safety procedures or to divert attention from hazardous tasks or, at the lowest levels, to show reduced performance levels. Because the human cognitive performance is more easily affected by heat exposure compared to deep core physiological parameters, appropriate limits must be substantially lower than existing limits for health-related issues.
Existing occupational exposure limits [Citation6] do not take adverse short-term mental effects into account. This is usually perceived as due to the fact that the impact of heat stress on different tasks shows a huge variability, the largest mediating factors being (a) task complexity; (b) subject’s skill level; (c) duration of exposure [Citation11].
In this paper, we specifically deal with tasks that require not only absence of physiological stress but also unimpaired vigilance and alertness. Driving related tasks can therefore be described as involving: (a) fairly complex tasks, often inducing a false sense of security due to a set of automatic reactions which are employed, but occasionally must be deactivated to react quickly to unpredictable events; (b) poorly trained subjects; (c) exposures that can be very long lasting. All these factors converge to amplify the effects of thermally inadequate environment on performance.
Because of the possible severe implications of performance loss in driving-related tasks we believe that establishing a specific acceptability threshold is of utmost importance. Based on Equations (5a) and (5b) we support the introduction two physiological limits that we set at tcore-lim = 37.2 °C for simple tasks and tcore-lim = 37.1 °C for more demanding tasks, by requiring that the performance loss does not exceed 50% (). These limits can in principle be compared with experimental determinations of tcore. However, given that measurements of tcore are very impractical, compliance will be much more simply assessed using the PHS thermal code, which is easily available and fairly straightforward to use. The new thresholds that we propose fall in between comfort thresholds [Citation29], which are cast in terms of environmental quantities since no appreciable departures from the rest value tcore = 36.8 °C can occur, and the threshold established to prevent heat-related health risks (tcore = 38 °C [Citation6]). These new thresholds can also be cast in terms of the outdoor temperature, which gives tout-lim = 37.6 °C and tout-lim = 33.4 °C respectively. It should be emphasized that these latter values, while much easier to compare with experimental results, are much less accurate than the equivalent values expressed in terms of tcore. Additionally, the values of tout-lim should only be applied in situations where the driver is initially exposed to the very high temperatures typical of a vehicle parked in the sun. The heat stress induced by simply driving with outdoor temperatures of order 35 °C is nowhere near that discussed in this paper.
Conclusions
This paper has investigated the thermal conditions inside a passenger car driven after a few hours in a shadeless parking lot, and the related implications for the driving performance.
Existing predictions of performance loss for office tasks have been adjusted to accommodate literature data specific for driving-related tasks; additionally, performance has been re-cast as a function of the core temperature instead of the room temperature, due to the strongly transient nature of the thermal exposure preventing the use of a single “average” value of the air temperature. Predictive algorithms have been developed for the performance loss in driving-related tasks as a function of the subject core temperature as well as of the outdoor air temperature.
We find that, although the threshold tcore = 38 °C used to prevent heat-related health risks is never approached, the fractional performance loss can be very large, up to and possibly exceeding 50%, depending on the actual outdoor thermal conditions and the specific task being considered.
We recommend that new thresholds are implemented in technical standards in order to ensure that the exposed subject is able to carry out driving-related mental tasks. We set such thresholds at tcore = 37.2 °C for simple tasks and tcore = 37.1 °C for more demanding tasks. Compliance with these values may be assessed either through experimental measurements or through the use of thermal models (e.g. the PHS model adopted here).
Because of the dearth of experimental data, and the wide variety of involved tasks, numerical predictions of the driving performance are very uncertain. This is particularly worrisome because heat stress and the consequent performance loss can influence human cognitive activity, which might be critical in driving situation, requiring efficient and error-free performance. More studies on the driving performance in the heat are badly needed.
Declaration of interest
The authors report no conflicts of interest. The authors alone are responsible for the content and writing of the paper.
References
- Manning R, Ewing J. Temperature in Cars Survey. RACQ Vehicle technologies, 2009. Available from: http://www.racq.com.au/__data/assets/pdf_file/0007/48796/09_Temperature_in_Cars.pdf
- Gibbs LI, Lawrence DW, Kohn MA. Heat exposure in an enclosed automobile. J La State Med Soc 1995;147:545–6
- Null J. Study of Excessive Temperatures in Enclosed Vehicles. 2003. Available from: http://ggweather.com/heat/heat%20study.pdf
- Grundstein A, Dowd J, Meentemeyer V. Quantifying the heat-related hazard for children in motor vehicles. Bull Am Meteorol Soc 2010;91:1183–91
- McLaren C, Null J, Quinn J. Heat Stress from enclosed vehicles: moderate ambient temperatures cause significant temperature rise in enclosed vehicles. Pediatrics 2005;116:e109–12
- ISO 7933 Ergonomics of the thermal environment – Analytical determination and interpretation of heat stress using calculation of the predicted heat strain. Geneva, Switzerland: International Organization for Standardization; 2004
- Malchaire J, Piette A, Kampmann B, Mehnert P, Gebhardt H, Havenith G, et al. Development and validation of the predicted heat strain model. Ann Occup Hyg 2001;45:123–35
- Bethea D, Parsons K. The development of a practical heat stress assessment methodology for use in UK industry. HSE Research report 008, 2002
- ISO 9920 Ergonomics of the thermal environment – Estimation of thermal insulation and water vapour resistance of a clothing ensemble. Geneva, Switzerland: International Organization for Standardization; 2007
- ISO 8996 Ergonomics of the thermal environment – Determination of metabolic rate. Geneva, Switzerland: International Organization for Standardization; 2004
- Hancock PA, Vasmatsidis I. Effects of heat stress on cognitive performance: the current state of knowledge. Int J Hyperthermia 2003;19:355–72
- Hancock PA. Sustained attention under thermal stress. Psycological Bulletin 1986;99:263–81
- Goldman RF. Standards for human exposure to heat. In Mekjavic IB, Banister EW, Morrison JB, editors. Environmental ergonomics. London: Taylor &Francis; 1988. pp 99–136
- Wetsel WC. Hyperthermic effects on behavior. Int J Hyperthermia 2011;27:353–73
- Faerevik H, Reinertsen RE. Effects of wearing aircrew protective clothing on physiological and cognitive responses under various ambient conditions. Ergonomics 2003;46:780–99
- Enander AE. Effects of thermal stress on human performance. Scand J Work Environ Health 1989;15:27–33
- Gaoua N, Grantham J, El Massioui F, Girard O, Racinais S. Cognitive decrements do not follow neuromuscular alterations during passive heat exposure. Int J Hyperthermia 2011;27:1–9
- Patterson MJ, Taylor NAS, Amos D. Tests of cognitive, perceptual and sustained attention functions in hot environments, Department of Defense, Defense Science and Technology Organization DSTO-TR-0650, 1998
- Allan JR, Gibson TM. Separation of the effects of raised skin and core temperature on performance of a pursuit rotor task. Aviat Space Environ Med 1979;50:678–82
- Chase B, Karwowski W, Benedict ME, Quesada PM, Irwin-Chase HM. Effects of thermal stress on dual task performance and attention allocation. J Hum Perf Extrem Environ 2005;8:27–39
- Sun G, Yang X, Jiang Q, Liu K, Li L, et al. Hyperthermia impairs the executive function using the attention network test. Int J Hyperthermia 2012;28:621–6
- Jiang Q, Yang X, Liu K, Li B, Li L, Li M, et al. Hyperthermia impaired human visual short-term memory. An fMRI study. Int J Hyperthermia 2013;29:219–24
- Gaoua N, Racinais S, Grantham J, El Massioui F. Alterations in cognitive performance during passive hyperthermia are task dependent. Int J Hyperthermia 2011;27:10–19
- Wyon DP, Wyon I, Norin F. Effects of moderate heat stress on driver vigilance in a moving vehicle. Ergonomics 1996;39:61–75
- Daanen HAM, van der Vliert E, Huang X. Driving performance in cold, warm, and thermoneutral environments. Appl Ergon 2003;34:597–602
- Seppänen O, Fisk WJ, Lei QH. Effect of temperature on task performance in office environment. Berkeley, CA: Lawrence Berkeley National Laboratory; 2006 (Publication 60946)
- Yaglou CP, Minard D. Control of heat casualties at military training centers. AMA Arch Ind Health 1957;16:302–16
- McArdle B, Dunham W, Holling HE, Ladel WSS, Scott JW, Thomson ML, et al. The prediction of the physiological effects of warm and hot environments. London: Med Res Council London; 1947; RNP Report 47/391
- ISO 7730 Ergonomics of the thermal environment – Analytical determination and interpretation of thermal comfort using calculation of the PMV and PPD indices and local thermal comfort criteria., Geneva, Switzerland: International Organization for Standardization; 2005