
Abstract
Purpose: In this in vivo study, the feasibility to perform hyperthermia treatments in the head and neck using magnetic resonance image-guided high intensity focused ultrasound (MRgHIFU) was established using a porcine acute model.
Materials and methods: Porcine specimens with a weight between 17 and 18 kg were treated in the omohyoid muscle in the neck. Hyperthermia was applied with a target temperature of 41 °C for 30 min using a Sonalleve MRgHIFU system. MR-based thermometry was calculated using water-proton resonance frequency shift and multi-baseline look-up tables indexed by peak-to-peak displacement (Dpp) measurements using a pencil-beam navigator. Three hyperthermia experiments were conducted at different Dpp values of 0.2, 1.0 and 3.0 mm. An optimisation study was carried out to establish the optimal parameters controlling the multi-baseline method that ensured a minimisation of spatial-average peak-to-peak temperature (TSA-pp) and temperature direct current bias (TSA-DC).
Results: The multi-baseline technique reduced considerably the noise on both TSA-pp and TSA-DC. The reduction of noise was more important when Dpp was higher. For Dpp = 3 mm the average (±standard deviation (SD)) of TSA-pp and TSA-DC was reduced from 4.5 (± 2.5) and 2.5 (±0.6) °C, respectively, to 0.8 (± 0.7) and 0.09 (± 0.2) °C.
Conclusions: This in vivo study showed the level of noise in PRFS-based thermometry introduced by respiratory motion in the context of MRgHIFU hyperthermia treatment for head and neck and the feasibility of reducing this noise using a multi-baseline technique.
Background
Cancer of the head and neck is the sixth most common form of cancer diagnosed in the world [Citation1]. Around 75% of patients with cancer of the pharynx present locally advanced or metastatic disease [Citation2]. For patients with locally advanced disease, standard treatment typically includes a 7-week course of chemo-radiotherapy alone or extensive surgery followed by post-operative chemo-radiotherapy. These curative treatments can cause potentially severe side effects to the organs of the head and neck responsible for voice, speech, swallowing, taste and neurological functions [Citation3,Citation4]. The most common cause of initial treatment failure in patients with locally advanced head and neck cancer is recurrence at the primary site or in the lymph nodes of the neck [Citation5,Citation6]. Despite combined modality treatments, 20–55% of patients with locally advanced head and neck cancer will develop local recurrence with overall survival of approximately 40–60% [Citation6–8]. Primary salvage treatments include re-irradiation and/or surgery. Unfortunately, those treatments are often limited by previous therapy, patient co-morbidities, or the presence of distant metastasis. For patients with incurable disease due to recurrence, metastasis or severe medical co-morbidities, symptoms such as neck pain, dysphagia, and respiratory difficulties affect patients’ quality of life. Median survival of patients with recurrent, metastatic disease is 3–6 months [Citation9]. There remains a need for therapeutic strategies which can improve loco-regional control and provide symptom relief while limiting treatment duration and side effects.
Magnetic resonance image (MRI)-guided high intensity focused ultrasound (MRgHIFU) is a modality that uses ultrasound to induce local bio-effects. The most explored bio-effect for therapeutic applications is the localised rise of temperature that has been proposed for ablative purposes or for moderate heating [Citation10]. MRgHIFU is already approved in the USA for the treatment of benign fibroblastomas in the uterus [Citation11], palliative treatments of bone tumours are being explored in clinical trials for the treatment of diseases such as essential tremor [Citation12]. We propose to use MRgHIFU as an adjuvant therapy to radiotherapy for the treatment of recurrent head and neck tumours. MRgHIFU will be used to induce regional hyperthermia of the tumour that will be immediately followed by radiotherapy exposure. It has been well documented that regional hyperthermia improves outcome of radiotherapy in the treatment of several types of localised cancer [Citation13–16] with encouraging results, especially in treating head and neck cancers [Citation17–19]. However, these early studies were complicated by the need to insert invasive temperature sensors and the lack of spatial power control with the energy delivery devices used [Citation20]. HIFU has the advantage of being able to deliver local hyperthermia treatment where the spatial distribution of the heating can be non-invasively monitored online with MRI [Citation21,Citation22] and controlled by modifying the ultrasound scanning pattern [Citation23]. We hypothesise that for head and neck cancer the combined effect of both physical therapies will translate into a better outcome in terms of survival rate for recurrent patients.
MRI thermometry is often calculated using the technique based on the water-proton resonance frequency shift (PRFS) [Citation24], which demonstrated a linear relationship between local changes in the magnetic field homogeneity to local changes in temperature. In its ‘traditional’ version, and in the presence of an external source of heating, PRFS uses the difference in encoded phase information between an image (ik-1) prior to heating and an image (ik) during heating. This approach assumes that no other disturbance to the local magnetic field homogeneity is present. However, in the presence of motion, images to be subtracted can be uncorrelated or their local magnetic field homogeneity being altered by an external factor such as a moving volume of gas. There have been several approaches to compensate for artefacts introduced by motion including using a gated-triggered system [Citation25], a multi-baseline reconstruction [Citation26,Citation27], a referenceless approach [Citation28,Citation29], or a combination of them [Citation30]. A gated-triggered system uses images only acquired during a single phase of motion (such as exhalation). A multi-baseline approach takes into account the cyclic aspect of motion. This technique uses supplementary data input that describes the motion to classify each image according to its relative location in the motion cycle. When calculating a thermal map, the reference image used for phase subtraction is selected from a database indexed according to their position in the cyclic motion. A referenceless method models the encoded phase in relatively homogeneous tissue as an nth order spatial equation system. Coefficients of the equation system are fitted using phase information in an unheated area and a synthetic reference image (ik-1) is used to calculate the change of temperature.
So far, the MRI thermometry has not been used in the neck region where the closeness of the lungs is expected to cause magnetic field variations and thus temperature measurement artefacts. Effects to PRFS-based thermometry caused by the lungs have already been observed in the breast region [Citation31], which suggests that the neck region may be also affected. Therefore, the primary justification of our in vivo study was to characterise the head and neck environment vis-à-vis MR-based thermometry and, if required, develop the required corrections to ensure a proper temperature calculation.
Methods
MRgHIFU system and immobilisation set-up
A 3-T Achieva MRI scanner and a Sonalleve MRgHIFU system (Philips Healthcare, Amsterdam, the Netherlands) were used for the experiments. The system uses a 256-element phase array transducer with a focal length of 14 cm and a diameter of 12 cm. It can operate with ultrasound frequency between 1.2 and 1.4 MHz. Since the MRgHIFU system was designed mainly for abdominal applications, a small set of modifications were performed to adapt the system for head and neck treatments. A frame built in plastic was placed on top of the acoustic window of the Sonalleve table. Four existing rods in the table helped to secure the positioning of the frame. The head and neck were immobilised using a mould built with a foaming agent (AC 250, Alpha Cradle, North Canton, OH, USA) routinely used in the treatment of radiation therapy patients. A similar approach was used in previous studies using hyperthermia induced with focused ultrasound for the brain [Citation32] and head and neck [Citation33]. A custom-made bag filled with degassed water was used as a coupling medium between the acoustic window in the MRgHIFU system and the neck area. The surface coils used for abdominal MRgHIFU (HIFU SENSE coils, Philips Healthcare) were used for imaging.
Animal preparation
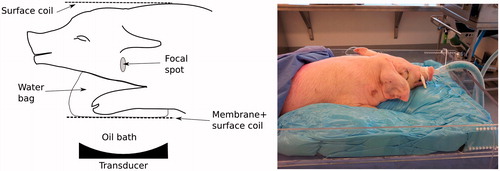
Porcine specimens with a weight between 17 and 18 kg were treated in the omohyoid muscle in the middle section of the neck area. The animal protocol was approved by the local animal care committee. The animal was under anaesthesia (Isoflurane 2%) and ventilated during the procedure. The right side of the neck was targeted for the treatment. shows a schematic and a picture of the animal set up. shows spin-lattice relaxation (T1) weighted images of the target area. After the procedure, the animal was euthanised with an injection of 150 mg/kg of sodium pentobarbital (Dolethal, Vétoquinol, Lure, France).
Figure 1. Schematic (left) and picture (right) of animal positioning for the experiment. The neck of the pig sits on top of a water bag used as coupling medium. Two multi-element surface coils are used for MRI acquisition. A moulding made with a foaming agent is used to immobilise the pig for the procedure.
Hyperthermia
The right side of the neck was treated with hyperthermia with a target temperature of 41 °C for 30 min. A target region of 16 mm in diameter and 34 mm in length was used to cover the muscle region. Customised software was developed to control the sonication using real-time toolboxes for the control of the MRgHIFU system and MR scanner [Citation34]. This customised software included manual control of power and an algorithm for respiration compensation. The user decided when ultrasound energy had to be turned on and off based on the temperature profile on the target zone. Also, three trajectories were available to recreate circular steering paths over the coronal orientation with diameters of 8, 12 and 16 mm. Each point in a given trajectory was sonicated for 10 ms before switching to the next point. The user selected when to switch between trajectories depending on the observed temperature in the treatment zone. For all experiments, the user started sonicating with the smaller diameter and switched to larger diameters when the central zone reached target temperature. In practice, to keep hyperthermia level on the target zone the user switched acoustic power on and off and selected between trajectories. Ultrasound frequency was set to 1.2 MHz. Cooling time was observed after each sonication until the temperature in the treatment region came back to baseline. Baseline temperature was measured with a fibre-optic thermometer (Reflex, Neoptix, Frank-Carrel, Quebec, Canada) that was inserted in the neck area outside the focal region. Prior to euthanasia, contrast enhancement imaging was performed using a gadolinium-based agent (Magnevist, Bayer, Whippany, NJ) to identify potential lesion formation.
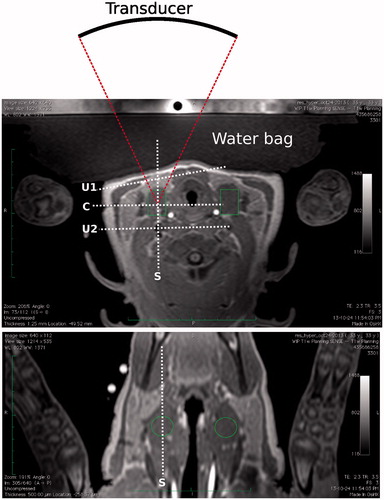
Figure 2. Transverse (top) and coronal (bottom) T1-weighted images of the target region in the pig’s neck. Muscle in the middle section on the right side of the neck was targeted for the treatment. Transverse image also shows the location of the transducer related to the target zone and water bag used for coupling. Locations of the monitoring stacks are also shown where ‘C’ and ‘S’ refer, respectively, to the coronal and sagittal views at focus, and ‘U1’ and ‘U2’ refer, respectively, to the user-defined stacks used to monitor pre-focal and post-focal heating.
MR-based thermometry
Temperature maps were calculated using the technique based on the water proton resonance frequency shift (PRFS) [Citation24]. Spin-lattice relaxation (T1) weighted images with fat suppression were used for the temperature monitoring. Four single-slice stacks were used for the monitoring and were positioned as follows: stacks 1 and 2 at coronal and sagittal orientations, respectively, centred on the HIFU focal spot; stacks 3 and 4 were user-defined with coronal orientation to monitor pre-focal and post-focal heating, respectively. MR imaging parameters were as follows: FOV 400 × 300 mm2, voxel size 2 mm, slice thickness 7 mm, TE/TR 16/25 ms, flip angle 18°, acquisition matrix 192 × 143, reconstruction matrix 192, ETL 11, NEX 1, dynamic time 3.07 s. Maps of the change of temperature ΔT were calculated with the PRFS technique using Equation 1 [Citation24].
where ϕ(t) is the phase map at a given time t, ϕ(t0) is the phase map at a reference time t0 at a known temperature, B0 is the strength of the magnetic field, TE is the echo time, α is the PRF-change coefficient and γ is the gyromagnetic ratio. To avoid artefacts in voxels with high oscillating phase values because of a low signal-to-noise ratio, thermometry values were only displayed in the regions of the images that showed a temperature uncertainty uT less than 2 °C using Equation 2.
where M and σM are, respectively, the magnitude map at t and the standard deviation of the difference of the magnitudes maps M(t) − M(t0). Drift in thermometry caused by the variations of the magnetic field over time was corrected using the following second-order spatial-temporal compensator [Citation35].
where an is the coefficient that minimises the variation φ(t) − φ(t0) over time caused by the magnetic field. Coefficients an were calculated using a least-square minimisation process using voxels that were outside regions where potential heating from HIFU could occur and selected with the criteria of uT less than 2 °C. On the coronal plane, this region corresponded to voxels located outside a circular region of 45 mm diameter centred on the HIFU focal zone. On the sagittal plane, this region corresponded to voxels outside a rectangle of 45 mm in the head-foot direction by 110 mm in the anterior-posterior direction centred on the HIFU focal zone. The dimensions of these heating zones were established empirically. For the user-defined planes, a manual region of interest (ROI) was drawn by the user to exclude any region that showed heating by HIFU. It is worth noting that this correction does not take into account changes in body temperature over time caused external factors such as external cooling or physiological response to anaesthesia. In experiments, body temperature was kept to less than 1 °C deviation. Accumulated thermal dose CEM43 (minutes at 43 °C) was calculated using the formula in Equation 4 [Citation36].
where T(t) is the temperature at time t.
Compensation to respiration artefacts
Compensation to artefacts introduced by respiration was achieved with a technique based on a look-up table (LUT) that uses displacement information from pencil-beam navigator data [Citation27]. With this technique the position of tissue was classified according to the breathing phase: inhalation, motionless or exhalation. The MRI scanner sends continuous navigator data between the acquisitions of each EPI excitation and read-out used for thermometry at a rate of 22.1 navigator echoes/s. Complementing the collection of navigator data, the metadata of each MR image used for thermometry contained the displacement information of that image as defined by the navigator displacement for the segmented EPI read-out train containing the k-space zero phase encoding. The navigator beam was placed as close as possible to the upper region of lungs. Using the displacement information of each image and the navigator data stream, it is possible to classify the images according to breathing cycle. This classification was used as an index in a LUT where a new image was matched with the closest image according to its position in the breathing cycle. A zero-phase low-pass Butterworth filter was used to smooth the navigator data and simplify the classification of the position of each image. A limitation of the Butterworth filtering is that the last values in the data stream remain close to the original unfiltered data. To ensure that all data was properly filtered, an auto-regressive all-pole estimator based on the Burg method [Citation37] was used to predict each new filtered navigator displacement [Citation38]. The cut frequency of the low-pass filter was 0.8 Hz and the order of the auto-regressive estimator was 5. Both parameters were adjusted for the specific breathing rate of the animals. Coefficients of the Butterworth filter were calculated with the function ‘butter’ of the signal library from SciPy (V 0.13.2 [Citation39]) with the order set to 8. Each entry in the navigator displacement D was classified according to the following rules.
Table
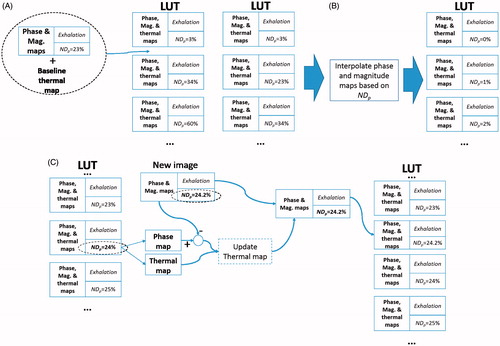
The choice for motionless of 20% was selected after conducting preliminary acquisitions that showed the level was small enough to avoid false detections of inhalation or exhalation phases. Every new image was classified according to these rules and the normalised position in the phase NDp (%). In practice, calculation of NDp started once a breathing cycle was properly reconstructed from navigator data. As shown in , each entry in the LUT was indexed by NDp and included a phase image and its corresponding thermal map. A pre-fill time (tP) was observed before applying any HIFU heating. This waiting time was required to provide enough entries in the LUT to be matched once the thermometry began to be calculated. During this pre-filling time a baseline thermal map was associated to each phase image. As suggested by Hey et al. [Citation27], at time tP (and only at this time) an interpolation was executed to increase the number of reference phase images. The evolution of the phase per voxel was unwrapped over time, interpolated between a range of 0 and 100% with nL steps, then rewrapped between −π and π. After time tP, MR thermometry was calculated with the PRFS method. As shown in , during HIFU a new image was matched with its closest entry in the LUT. The phase map and its temperature map were recovered for this entry. The change of temperature induced by HIFU was calculated with the PRFS method and corrected for drift. This updated thermal map was associated with the new image and both were inserted as a new entry in the LUT so it can be used as a potential match for future images.
Figure 3. Example flowchart for thermometry using the look-up table (LUT) for the exhalation phase. (A) During pre-filling time tP), each new phase image (and a baseline temperature map) is stored in the LUT where its index is the normalised position (NDp, in %) in the breathing phase. (B) At the end of pre-filling (t = tP), the LUT is updated with phase maps that are linearly interpolated between 0 and 100%. (C) After pre-filling (tP), when a new image arrives the closest entry in the LUT is located according to NDp. The phase difference map is calculated between the phase maps of the new image and the best entry in the LUT. An updated thermal map is calculated with this phase difference map and the thermal map associated to the closest entry in the LUT. The updated thermal map is associated to the new phase map and both are inserted in the LUT as new entries.
To study the effect of longevity of images stored in the LUTs a parameter of time limit tL was introduced. This parameter controlled how much time an image was preserved in the LUT. Each new image was time-stamped to the current time at arrival. When a new image arrived during HIFU (), and prior to the look-up of a potential match, all images that were older than tl relative to the current time were removed from the LUT.
Optimisation study
It is worth noting that parameters tP, nL and tL had a competing influence on each other. The amount of tP has an effect in the quality of the interpolated population; the smaller tP is, the smaller the number of images prior to interpolation is. Also, the interpolation of phase images can only be done just before HIFU starts to be applied, when no heating has been applied. This aspect is critical since this part of the method interpolates the phase images according to their relative position in the breathing cycle. Once HIFU starts, it is not possible any more to perform interpolation since heating changes the phase information. Parameter tL also has a direct influence on the interpolated population. Once the current time of the procedure starts to be larger than tL, the images that were initially interpolated prior to heating are removed. By the middle of the experiment (>15 min) no more images from the interpolated population are available if tL has a value of only a few minutes.
To better understand the influence of parameters tP, nL and tL, an optimisation study was executed to establish the best conditions for the respiration compensation. The range of values of tP, nL and tL that were tested are shown in .
Table 1. Parameters values tested for multi-baseline correction.
The efficiency of the multi-baseline correction was measured with TSA-pp and TSA-DC related to the baseline temperature. Both quantities should be minimised. TSA-pp and TSA-DC were measured in the following ROIs for each of the four slices used for monitoring: focal, non-heated and diaphragm. The focal ROIs in the coronal and sagittal slices centred at the focus were defined by circular and elliptical regions, respectively. The circular region had a diameter of 16 mm and the elliptical region had a small diameter of 16 mm and large diameter of 34 mm. At the user-defined slices, the focal regions were delineated by the user as circular regions where heating was observed, with a diameter of 40 mm in the pre-focal slice and 20 mm in the post-focal slice. The non-heated regions were the same as used for the second-order spatial-temporal compensator described previously. The diaphragm regions were user-defined ROIs with a diameter around 15 mm located as close as possible to the diaphragm. These regions typically showed the highest level of noise caused by breathing. These regions were located 4 to 7 cm from the focal zone in the foot direction. The criterion for their location was to be placed as far as possible in the feet direction but yet in a region where uT was still under the criterion of less than 2 °C. For each monitored ROI, TSA-pp and TSA-DC were measured at the beginning of hyperthermia (time window from 300 to 600 s) and at the end of the experiment (last 300 s). Because the heating at the focal zone was induced by HIFU, TSA-DC was not measured in any of the focal ROIs. In total, for each combination of tP, nL and tL, 24 measurements were done for TSA-pp (four slices × three ROIs × two time zones) and 16 measurements were done for TSA-DC (four slices × two ROIs × two time zones).
The global quality of the respiration compensation was calculated with the mean sum of squares as in Equation 5
where x is the measurement (peak-to-peak, direct current) and M the total number of measurements. These measurements of quality were also performed with thermometry calculated without respiration compensation. Multivariate linear regression analysis was performed using generalised addictive models (GAMs) [Citation40] with the GAM function of the R software package [Citation41]. GAMs use spline fitting to avoid requiring defining the trend a priori.
Software implementation
Real-time software toolboxes for the control of the MRgHIFU system and MR scanner [Citation34] were used to perform the experiments. The application for the experiments was written in Python (version 2.7.3) and executed using Canopy (version 1.3.0, Enthought, Austin, TX). NumPy (version 1.8, [Citation42]) and SciPy (version 0.13.2, [Citation39]) libraries were used for calculations. A multi-threaded application was written to allow real-time interaction with the HIFU system while data collection and its processing were performed simultaneously. PySide (version 1.1.2) was used as the main graphic library for the user interface. Data visualisation was performed using the Chaco library (version 4.4.1, Enthought). A computer with 8 GB of RAM and a Xeon processor (E2540, Intel, Santa Clara, CA) was used to perform the experiments.
Experiments
Three hyperthermia experiments, one animal specimen per experiment, were conducted where the navigator beam was placed at locations producing the following peak-to-peak displacement (Dpp): <1 mm, 1 mm and >2 mm. These tests served to test the effect of the magnitude of the navigator profile on the respiration compensation algorithm. Experiments on the first two animals were performed with a breathing volume of 200 mL and rate of 20 breaths per minute (bpm), while in the last animal breath rate was set to 25 bpm.
Results
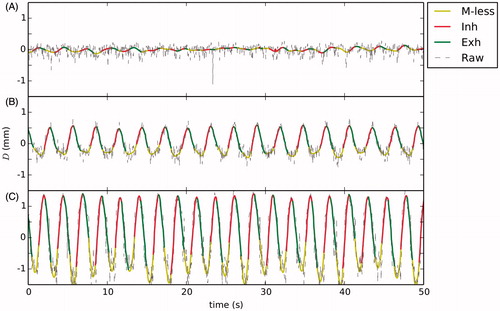
The procedure was well tolerated by the animals and no sign of burning was detected on the skin surface and no observable lesion was identified by gadolinium-based contrast imaging. shows the observed navigator displacement estimates for the hyperthermia experiments. The displacement observed in the first animal specimen, when the navigator beam was poorly located, showed a Dpp of 0.2 mm. For the second animal specimen the navigator beam was better located showing a Dpp value of 1 mm. For the third animal specimen, the navigator beam was positioned until showing a maximum value Dpp of 3 mm.
Figure 4. Navigator profiles for hyperthermia experiments: (A) low displacement, (B) medium displacement and (C) high displacement. The raw unfiltered navigator displacement estimate is shown along the classified profile where legends M-less, Inh and Exh correspond, respectively, to motionless inhalation and exhalation.
Optimisation study
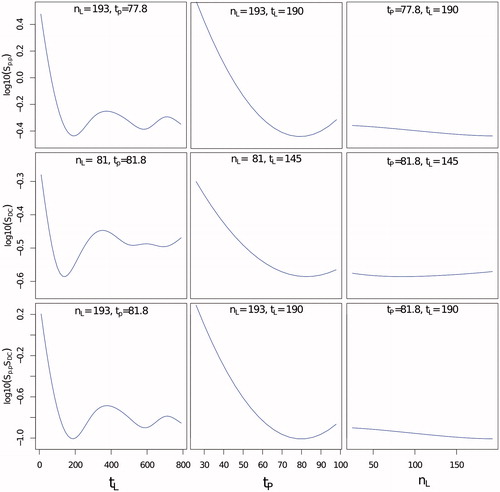
Because the values of Spp and SDC were very close to zero, the regression modelling was performed on log10(Sx) to avoid predicting negative values which lack of physical meaning. shows plots of the regression model around the global minimum of Spp and SDC for the hyperthermia experiment with D = 1 mm. Both regression models were obtained with a degree of freedom (k) of 50 in the GAM function. In this example, results indicated that the duration of each entry in LUTs tL and the pre-fill time prior to thermometry tP had the most significant impact in both Spp and SDC. Values of tL less than 50 s translated into a significant increase in noise. In both Spp and SDC a valley was found with tL between 150 and 200 s, suggesting that the optimal value of tL was around this range. Values of tL larger than 200 s showed an increase in the noise level, especially for SDC. For the tP, the smallest the error was observed with a valley around 80 s. For this experiment the number of entries in the interpolated table prior to thermometry nL showed very little impact on the outcome.
Figure 5. Logarithmic plots of the predicted trend of Spp (top row), SDC (middle row) and SppSDC (bottom row) using general additive modelling for the hyperthermia experiment with D = 1 mm. The selected plots are shown as functions of the duration to keep images stored in the LUT (tL), the pre-filling time (tP) and the number of interpolated images (nL) for the optimal conditions that minimised values of Spp,SDC and Spp SDC.
The quantity log10(SppSDC) was fitted using the GAM function with a k of 50 to better establish which parameters produced the temperature estimation with minimal error in both the TSA-DC and the peak-to-peak level. The regression analysis with general additive models was performed with the data collected per experiment. (bottom row) shows the regression model results for the experiment with Dpp = 1 mm. Results for other experiments showed similar trends. shows the optimal parameters and the resulting values of SppSDC obtained from the linear regression along with the values calculated with and without the respiration compensation algorithm.
Table 2. Optimal values for execution of respiration compensation algorithm using multi-baseline correction. The values of SppSDC are shown for the fitted regression analysis with the global additive model (GAM), and calculated with and without the respiration compensation (RC) algorithm. The average (± SD) values of the resulting TSA-pp and TSA-DC are also shown.
Regression analysis for SppSDC showed a similar trend for the influence of tL as shown previously for Spp and SDC independently, where the optimal value ranged between 130 and 190 s. For tP, the influence was slightly different depending on the experiment, but it was observed that the closer tP was to the upper limit the better was the reduction of noise. Reduction of noise level appeared to be inversely proportional to the measured displacement D. As shown in , for hyperthermia with Dpp = 0.2 mm, the level of SppSDC was 0.33. For Dpp = 1 mm, SppSDC was 0.2, while for Dpp = 3 mm, this measurement was 0.04. As also shown in the same table, TSA-DC was the measurement more sensitive to Dpp, which suggests that a correct estimation of the displacement is critical to avoid introducing a bias that would translate into an erroneous evaluation of the temperature over a long period of time. For all experiments included, average TSA-pp was reduced from 3.5 °C to 0.67 °C, and TSA-DC from 0.9 °C to 0.27 °C. It is worth mentioning that the noise level without breathing compensation is not necessarily linked to the value of Dpp since this depends greatly on the position of the pencil-beam navigator.
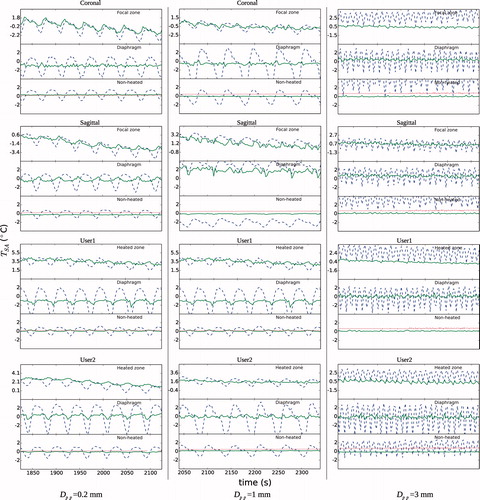
and show the detail of the temperature profiles with and without respiration compensation for the hyperthermia experiments at beginning and end of the treatment, respectively. The profiles are shown for each slice and ROI. For the focal ROIs, the temperature over the baseline is induced by HIFU. The fibre-optic thermometer reading is also shown along the temperature in the non-heated ROI. The profiles showed clearly that the respiration compensation algorithm reduced considerably both the peak-to-peak and TSA-DC noises. Respiration noise was noticeable from large amplitude oscillations that could be more than 4 °C TSA-pp in the diaphragm ROIs. As mentioned in the Methods section above, changes in global body temperature were not corrected, as can be seen on the fibre-optic thermometer reading at the end of the experiment () which shows a small bias less than 1 °C. The TSA-DC noise without respiration compensation was more relevant for the experiment with Dpp = 3 mm at end of the procedure, especially in the focal zone with a bias more than +2 °C. Noise was more important in the diaphragm ROIs, which was expected, with oscillations of temperature larger than 5 °C peak-to-peak when respiration was not compensated. It is worth mentioning that for experiments with a low value of Dpp (≤1 mm), some of the respiration-corrected temperature profiles still showed some TSA-DC in the diaphragm ROIs ( and ). This was probably caused by a poor classification of the reference images that translated into an erroneous temperature calculation.
Figure 6. Detail of spatial average temperature TSA (°C) over time on each of three ROIs and slice stacks (coronal and sagittal at focus, and two user-defined stacks) at the beginning of the hyperthermia experiments. Temperature is shown with and without respiration compensation by ‘–’ and ‘°’, respectively. Fibre-optic thermometer reading is shown by ‘…’. The baseline temperature at the beginning of treatment was subtracted. This baseline was 39 °C, 35.7 °C and 33.7 °C for Dpp values of 0.2 mm, 1 mm and 3 mm, respectively.
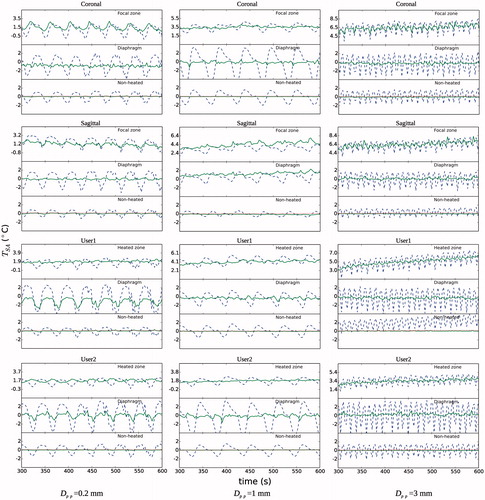
Figure 7. Detail of spatial average temperature TSA (°C) over time on each of three ROIs and slice stacks (coronal and sagittal at focus, and two user-defined stacks) at the end of the hyperthermia experiments. Temperature is shown with and without respiration compensation by ‘- -’ and ‘°’, respectively. The baseline temperature at the beginning of treatment was subtracted. A change of body temperature was observed in the fibre-optic thermometer readings, especially for the experiment with Dpp = 3 mm. For that experiment it is also worth noting that MRI temperature for the global non-heated region in the ‘User 1’ stack had a TSA-DC of 16 °C when no respiration compensation was applied, which meant that it was not plotted.
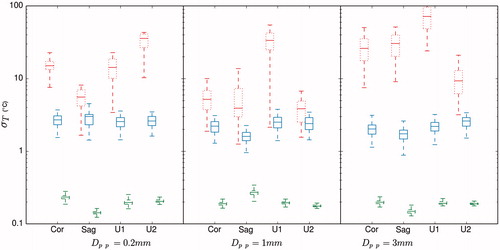
Similar to the reduction in the peak-to-peak temperature oscillation over time, the motion compensation reduced also the observed standard deviation of temperature σT at each image. shows a comparison of σT with and without motion compensation calculated on the non-heated region of the monitored stacks. The theoretical optimal value of σT is also plotted. Similar to the study by Hey et al. [Citation27], the LUT-based method reduced σT by one order of magnitude. All experiments and monitoring stacks combined, the average of σT with and without motion compensation was, respectively 2.4 °C and 25.2 °C. The average of the theoretical limit of σT was 0.2 °C.
Impact on hyperthermia outcome
Calculations of temperature in tissue that contains highly oscillating noise and/or TSA-DC can have significant implications for a hyperthermia treatment. shows the temperature profile over time for the treatment zone, the average temperature maps in the steady portion of the treatment, and the thermal dose maps (CEM43) for hyperthermia treatment with Dpp = 3 mm. The highly oscillating temperature calculation makes any automatic control algorithm difficult to implement. Even if average temperature over the whole steady state of the treatment is similar when using respiration compensation in the treatment zone or not, results shown in indicate that several false hot spots appeared in the proximity of the treatment zone when not using the compensation. The average, T90 (percentile above 10%) and T10 (percentile above 90%) steady-state temperatures of the treatment zone were, respectively, 39 °C, 37.7 °C and 41 °C. Also, because of the exponential effect of temperature on the thermal dose calculation, the oscillating noise in the non-corrected temperature translated into a highly overestimated dose concentration in the treatment zone and peripheral regions. The spatial averages of the accumulated thermal dose in the treatment zone with and without respiratory compensation were, respectively, 27 CEM43 and 1.8 × 10¹⁰ CEM43. This result indicated that using thermal dose as a control criterion for a hyperthermia treatment is quite challenging to implement without proper respiration compensation.
Figure 8. Comparison of temperature and thermal dose profiles for the hyperthermia experiment with D = 3 mm for treatment at ROI on the coronal plane with and without respiration compensation (RC). Profiles over time (top row) are shown for the average, T90 (above 10% percentile) and T10 (above 90% percentile) values on the treatment ROI. Maps of the average temperature (middle row) were calculated during the steady state of the treatment (between 500 s and 2000 s). Maps of the total accumulated thermal dose (bottom row) are shown in log10 scale. The treatment ROI is shown in both temperature and thermal dose maps by a circular zone of 8 mm of radius.
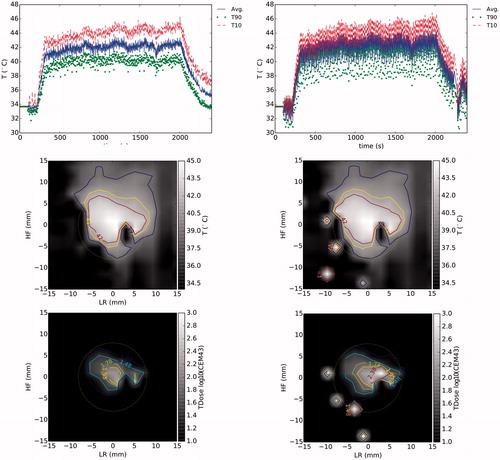
Figure 9. Box-plot of the variation of standard deviation of temperature σT on the non-heated region for each experiment and for the monitored coronal (Cor), sagittal (Sag) and user specified (U1 and U2) imaging stacks. σT is shown without and with respiration compensation by ‘…’ and ‘—’. The theoretical optimal value of σT is shown by ‘- -’. The margins in the boxes represent the median and the values of σT that comprise 25% and 75% of all data points. The bar limits show the extreme values that are exceeded by 10% and 90% of all data.
Discussion
In vivo results showed that MR-based thermometry based on PRFS and LUTs indexed by the displacement position calculated with navigator pencil-beam is a very efficient method to reduce respiration artefacts in the head and neck area. Even in non-ideal conditions such as a poorly placed pencil-beam navigator (Dpp = 0.2 mm) translating into a measurement of D close to the background noise level, the method reduced considerably the observed noise induced by breathing. Nevertheless, correct placement of the navigator beam ensures better classification of each image.
In the specific context of hyperthermia, the most important parameters of the proposed method were the duration of each entry in LUT tL and the time to perform the interpolation tp. A low value of tL (< 100 s), and the number of available entries in the table is very small and consequently reduces the opportunity of matching two images despite the use of interpolations. A large value of tL (>190 s) and the oldest images cannot be considered as true references for the phase subtraction. The experimental data and the fitting with global additive models indicated that the optimal value of tL was found between 130 and 190 s. The oscillating variations of the fitted model shown in for values of tL larger than 190 s are caused by the spline fitting used in the regression model. The average value of optimal tL among all seven experiments was 170 s. The pre-fill time tP determined the duration of the ‘learning’ phase required to populate the LUT prior to interpolation with images with no external heating. This time can never exceed the time point when HIFU is activated. Apart from the hyperthermia experiment with Dpp = 0.2 mm, results indicated that values of tP closer to the limit of 100 s minimised the error. This means that thermometry with the respiration compensation algorithm is better started as early as possible before any external heating is applied. Results indicated that an average value of tP of 78 s ensures a good compromise among all experiments.
As shown in , the number of entries at interpolation nL had little influence over the reduction of noise when tL was set to its optimal value, showing practically flat values of noise level on all tested values of nL. The global average value of optimal value of nL was 123. This result is in contrast to what Hey et al. reported [Citation27], where interpolation reduced the noise on thermometry for HIFU lesion applications in the breast, with sonications with much shorter times (around 3 min) compared to the present study. We discovered that, for the specific case of sonication of ≥30 min, longevity of phase images stored in the table had a much important role and practically nullified the influence of the interpolation The reduced effect of nL comes from the fact that the interpolation only occurs right before the beginning of the hyperthermia treatment. Also, in Hey et al. [Citation27] it was reported that the interpolation required a Dpp larger than 20 mm to make the interpolation effective to reduce the noise induced by breathing. Compared to HIFU ablation, where the time to perform the treatment is less than 1 min, an interpolated population helps to increase the number of available references for PRFS since all those images can be potentially matched in a very short period of time. For hyperthermia, where the treatment lasts ≥30 min, the interpolated images are discarded as the treatment advances and the criterion tL is applied.
The reduction of the peak-to-peak noise and TSA-DC is critical to implement an effective automatic control algorithm and ensure safety of the method. Significant peak-to-peak noise jeopardises the decision to modulate HIFU energy, and errors in TSA-DC can translate to a risk of under-treatment or, even worse, over-treatment and ultimately undesired lesion formation. As shown in , DC bias error without respiration compensation became more important as treatment time increased, and this bias was more than 2.5 °C at the end of treatment in the focal zone, which would translate into an under-treatment as a control algorithm would assume that temperature was higher than it really was. The measurements in the non-heated regions, which matched measurements of the fibre-optic thermometer, indicated that the respiration compensation technique ensured that measurement of the baseline temperature was stabilised. All experiments showed a practically flat temperature trend over baseline when using respiration compensation.
A disadvantage of the multi-baseline method is that this pre-fill time needs to be observed, and the parameters controlling the operation of the LUT need to be carefully selected in order to ensure the best outcome. However, in the context of hyperthermia, where a treatment lasts at least 30 min plus cooling time, this pre-fill time should not imply a significant cost in the overall procedure. This waiting time is in contrast with methods based on referenceless MR-thermometry where learning time is not required [Citation43,Citation29]. Referenceless methods can be evaluated but the high tissue heterogeneity of the head and neck with air structures, fat tissue, large vessels, tumour tissue, and a large heating ROI are limiting factors in the efficiency for the fitting required to model the background phase information [Citation43]. As indicated in Salomir et al. [Citation29], these limitations can be partially compensated by improving signal-to-noise conditions using better coils and fine-tuning of sequences. In the present study we were quite probably in suboptimal SNR conditions because we used the same coils primarily intended for abdominal MRgHIFU. The results presented here showed that, in spite of using a non-optimal setting for imaging the head and neck, the surface coils provided high enough image quality to perform the thermometry.
Another disadvantage of the multi-baseline approach is that the method as it is proposed is intrinsically unable to handle ‘accidental’ motion. This is particularly problematic for HIFU lesion applications where every image is critical for the control of the therapy. However, in the context of hyperthermia the displacement based on the pencil-beam navigator can be used for decision-making in a control algorithm. If a new dynamic image is detected to be outside the limits of the current population in the LUT, the sonication can be stopped and the image discarded for thermometry purposes. Ultrasound delivery can be re-enabled once the displacement associated with new images is again in the limits of what has been populated in the LUTs. In the context where ultrasound is already being modulated in terms of maintaining a temperature around 41 °C for 30 min or more, the need to stop the ultrasound delivery for a few seconds if ‘accidental’ motion is detected should not compromise the final outcome.
Similarly to accidental motion, the current technique is not able to compensate out-of-plane artefacts. Even if the technique collects a large number of entries (each with its unique phase, magnitude and temperature maps), the information between two images classified at the same position in the breathing cycle must be correlated enough to avoid artefacts. To reduce this type of noise, a real-time adaptive slice-tracking technique [Citation44] can be evaluated to place the pencil-beam navigator right into the treatment zone. Also, as for the case of accidental motion, the context of hyperthermia treatment can be used favourably in the sense that measurements of correlation can be used for decision-making. Ultrasound delivery can be suspended temporarily in the case of uncorrelated magnitude information, especially in the treatment zone. Ultrasound energy can be either reactivated once a new image satisfies the correlation criteria or completely interrupted if these criteria are unmet after a waiting period.
The parameters established to minimise the error introduced by breathing were optimised in the context of the animal model used. However, the method presented here using regression analysis with global additive models can be used in the context of a human setting. It would be feasible to perform a preliminary acquisition with non-thermal energy applied and execute the optimisation method to establish the optimal parameters that are adequate in a clinic context. A relevant difference between the animal setting used in our study and a clinic setting is the breathing rate. In humans the breathing rate at rest is an average 12 bpm, while in our mechanically induced conditions the rate was between 20 and 25 bpm. This will imply that filtering conditions of the navigator displacement would need to be adjusted, but these modifications can even be patient-specific without detriment of the technique. More importantly, the navigator displacement on the upper diaphragm may or may not differ between the animal model and clinic conditions. Further studies will concentrate on ensuring that a correct breathing motion can be reconstructed with the pencil-beam navigator in the human setting of the upper diaphragm.
Conclusions
In the context of MRgHIFU hyperthermia treatment for head and neck, this in vivo study showed the level of noise in PRFS-based thermometry introduced by respiration motion and the feasibility of reducing this noise using a multi-baseline technique. This implementation uses breathing displacement measured with a pencil-beam navigator as the index to classify dynamic images used for MR thermometry. A method to establish optimal parameters controlling the multi-baseline method was presented using regression analysis with global additive models. The multi-baseline technique reduced the noise considerably, both peak-to-peak and TSA-DC, on temperature measurements. The reduction of noise was more important when the measured displacement was higher. For a breathing displacement peak-to-peak of 3 mm, the average peak-to-peak and TSA-DC on temperature was reduced from 4.5 (± 2.5) and 2.5 (± 0.6) °C, respectively, to 0.8° (± 0.7°) and 0.09° (± 0.2) °C. This method can be applied in the context of a clinic for this type of treatment.
Declaration of interest
This study was supported by FedDev Program and Canada Research Chairs Program from the federal government of Canada and programming support from Philips. Samuel Pichardo, Justin Lee and Kullervo Hynynen report no conflicts of interest. Max Köhler is an employee of Philips Healthcare. The authors alone are responsible for the content and writing of the paper.
References
- Hunter KD, Parkinson EK, Harrison PR. Profiling early head and neck cancer. Nat Rev Cancer 2005;5:127–35
- Mendenhall WM, Werning JW, Pfister DG. Treatment of head and neck cancer. In: DeVita VT Jr, Lawrence TS, Rosenberg SA, editors. Cancer: Principles and Practice of Oncology, 9th ed. Philadelphia, PA: Lippincott Williams & Wilkins, 2011, pp. 729–80
- Corry J, Peters LJ, Costa ID, Milner AD, Fawns H, Rischin D, et al. The ‘QUAD SHOT’ – A phase II study of palliative radiotherapy for incurable head and neck cancer. Radiother Oncol 2005;77:137–42
- National Institutes of Health NCI. Oral Complications of Chemotherapy and Head/Neck Radiation (PDQ®) 2014. Available at http://www.cancer.gov/cancertopics/pdq/supportivecare/oralcomplications/HealthProfessional/
- Oksuz DC, Prestwich RJ, Carey B, Wilson S, Senocak MS, Choudhury A, et al. Recurrence patterns of locally advanced head and neck squamous cell carcinoma after 3D conformal (chemo)-radiotherapy. Radiat Oncol 2011;6:54
- Rischin D, Peters LJ, O’Sullivan B, Giralt J, Fisher R, Yuen K, et al. Tirapazamine, cisplatin, and radiation versus cisplatin and radiation for advanced squamous cell carcinoma of the head and neck (TROG 02.02, HeadSTART): A phase III trial of the Trans-Tasman Radiation Oncology Group. J Clin Oncol 2010;28:2989–95
- Bonner JA, Harari PM, Giralt J, Cohen RB, Jones CU, Sur RK, et al. Radiotherapy plus cetuximab for locoregionally advanced head and neck cancer: 5-year survival data from a phase 3 randomised trial, and relation between cetuximab-induced rash and survival. Lancet Oncol 2010;11:21–8
- Lorch JH, Goloubeva O, Haddad RI, Cullen K, Sarlis N, Tishler R, et al. MR: Induction chemotherapy with cisplatin and fluorouracil alone or in combination with docetaxel in locally advanced squamous-cell cancer of the head and neck: Long-term results of the TAX 324 randomised phase 3 trial. Lancet Oncol 2011;12:153–9
- Machiels JP, Subramanian S, Ruzsa A, Repassy G, Lifirenko I, Flygare A, et al. Zalutumumab plus best supportive care versus best supportive care alone in patients with recurrent or metastatic squamous-cell carcinoma of the head and neck after failure of platinum-based chemotherapy: An open-label, randomised phase 3 trial. Lancet Oncol 2011;12:333–43
- Jolesz FA, Hynynen KH. MRI-Guided Focused Ultrasound Surgery. Informa Healthcare. 2007
- Fennessy FM, Tempany CM. An update on magnetic resonance guided focused ultrasound surgery (MRgFUS) of uterine fibroids. Curr Radiol Rep 2013;1:136–46
- Lipsman N, Schwartz ML, Huang Y, Lee L, Sankar T, Chapman M, et al. MR-guided focused ultrasound thalamotomy for essential tremor: A proof-of-concept study. Lancet Neurol 2013;12:462–8
- Harari PM, Hynynen KH, Roemer RB, Anhalt DP, Shimm DS, et al. Development of scanned focussed ultrasound hyperthermia: Clinical response evaluation. Int J Radiat Oncol Biol Phys 1991;21:831–40
- van der Zee J, González D, van Rhoon GC, van Dijk JD, van Putten WL, Hart AA. Comparison of radiotherapy alone with radiotherapy plus hyperthermia in locally advanced pelvic tumours: A prospective, randomised, multicentre trial. Lancet 2000;355(9210):1119–25
- Jones EL, Oleson JR, Prosnitz LR, Samulski TV, Vujaskovic Z, Yu D, et al. Randomized trial of hyperthermia and radiation for superficial tumors. J Clin Oncol 2005;23:3079–85
- Harima Y, Nagata K, Harima K, Ostapenko V, Tanaka Y, Sawada S. A randomized clinical trial of radiation therapy versus thermoradiotherapy in stage IIIB cervical carcinoma. Int J Hyperthermia 2009;25:338–43
- Datta N, Bose A, Kapoor H, Gupta S. Head and neck cancers: Results of thermoradiotherapy versus radiotherapy. Int J Hyperthermia 1990;6:479–86
- Valdagni R, Amichetti M. Report of long-term follow-up in a randomized trial comparing radiation therapy and radiation therapy plus hyperthermia to metastatic lymph nodes in stage IV head and neck patients. Int J Radiat Oncol Biol Phys 1994;28:163–9
- Huilgol NG, Gupta S, Dixit R: Chemoradiation with hyperthermia in the treatment of head and neck cancer. Int J Hyperthermia 2010;26:21–5
- Emami B, Scott C, Perez CA, Asbell S, Swift P, Grigsby P, et al. Phase III study of interstitial thermoradiotherapy compared with interstitial radiotherapy alone in the treatment of recurrent or persistent human tumors: A prospectively controlled randomized study by the Radiation Therapy Oncology Group. Int J Radiat Oncol Biol Phys 1996;34:1097–104
- Partanen A, Tillander M, Yarmolenko PS, Wood BJ, Dreher MR, Köhler MO. Reduction of peak acoustic pressure and shaping of heated region by use of multifoci sonications in MR-guided high-intensity focused ultrasound mediated mild hyperthermia. Med Phys 2012;40:013301
- Partanen A, Yarmolenko PS, Viitala A, Appanaboyina S, Haemmerich D, Ranjan A, et al. Mild hyperthermia with magnetic resonance-guided high-intensity focused ultrasound for applications in drug delivery. Int J Hyperthermia 2012;28:320–36
- Staruch R, Chopra R, Hynynen K. Hyperthermia in bone generated with MR imaging-controlled focused ultrasound: Control strategies and drug delivery. Radiology 2012;263:117–27
- Ishihara Y, Calderon A, Watanabe H, Okamoto K, Suzuki Y, et al. A precise and fast temperature mapping using water proton chemical shift. Magn Reson Med 1995;34:814–23
- Weidensteiner C, Kerioui N, Quesson B, de Senneville BD, Trillaud H, Moonen CT. Stability of real-time MR temperature mapping in healthy and diseased human liver. J Magn Reson Imaging 2004;19:438–46
- Vigen KK, Daniel BL, Pauly JM, Butts K. Triggered, navigated, multi-baseline method for proton resonance frequency temperature mapping with respiratory motion. Magn Reson Med 2003;50:1003–10
- Hey S, Maclair G, De Senneville B, Lepetit-Coiffe M, Berber Y, Köhler M, et al. Online correction of respiratory-induced field disturbances for continuous MR-thermometry in the breast. Magn Reson Med 2009;61:1494–9
- Rieke V, Vigen KK, Sommer G, Daniel BL, Pauly JM, Butts K. Referenceless PRF shift thermometry. Magn Reson Med 2004;51:1223–31
- Salomir R, Viallon M, Kickhefel A, Roland J, Morel DR, Petrusca L, et al. Reference-free PRFS MR-thermometry using near-harmonic 2-D reconstruction of the background phase. IEEE Trans Med Imaging 2012;31:287–301
- Grissom WA, Rieke V, Holbrook AB, Medan Y, Lustig M, Santos J, et al. Hybrid referenceless and multibaseline subtraction MR thermometry for monitoring thermal therapies in moving organs. Med Phys 2010;37:5014–26
- Peters NH, Bartels LW, Sprinkhuizen SM, Vincken KL, Bakker CJ. Do respiration and cardiac motion induce magnetic field fluctuations in the breast and are there implications for MR thermometry?. J Magn Reson Imaging 2009;29:731–5
- Guthkelch A, Carter L, Cassady J, Hynynen K, Iacono R, Johnson P, et al. Treatment of malignant brain tumors with focused ultrasound hyperthermia and radiation: Results of a phase I trial. J Neuro-Oncol 1991;10:271–84
- Hynynen K, Shimm D, Anhalt D, Stea B, Sykes H, Cassady J, et al. Temperature distributions during clinical scanned, focused ultrasound hyperthermia treatments. Int J Hyperthermia 1990;6:891–908
- Zaporzan B, Waspe AC, Looi T, Mougenot C, Partanen A, Pichardo S. MatMRI and MatHIFU: Software toolboxes for real-time monitoring and control of MR-guided HIFU. J Ther Ultrasound 2013;1:7
- El-Sharkawy AM, Schär M, Bottomley PA, Atalar E. Monitoring and correcting spatio-temporal variations of the MR scanner’s static magnetic field. Magn Reson Mat Phys Biol Med 2006;19:223–36
- Sapareto SA, Dewey WC. Thermal dose determination in cancer therapy. Int J Radiat Oncol Biol Phys 1984;10:787–800
- Kay SM. Modern Spectral Estimation. Pearson Education India, Hamburg, Germany. 1988
- Kauppinen I, Roth K. Audio signal extrapolation – Theory and applications. Proc DAFx-02 2002:105–10
- Jones E, Oliphant T, Peterson P. SciPy: Open source scientific tools for Python 2001. Available at http://www.scipy.org/
- Hastie TJ, Tibshirani RJ. Generalized Additive Models, Vol. 43. USA: CRC Press, 1990
- R Core Team. R: A Language and Environment for Statistical Computing. Vienna, Austria: R Foundation for Statistical Computing, 2013. Available at http://www.R-_project.org/
- Oliphant TE. Python for scientific computing. Comp Sci Eng 2007;9:10–20
- de Senneville BD, Roujol S, Moonen C, Ries M. Motion correction in MR thermometry of abdominal organs: A comparison of the referenceless vs the multibaseline approach. Magn Reson Med 2010;64:1373–81
- Köhler MO, Denis de Senneville B, Quesson B, Moonen CT, Ries M. Spectrally selective pencil-beam navigator for motion compensation of MR-guided high-intensity focused ultrasound therapy of abdominal organs. Magn Reson Med 2011;66:102–11