
Abstract
Purpose: This study is an investigation of the relationship between several characteristic parameters and acute thermal damage in porcine skeletal muscle. Material and methods: Fourteen pigs under injection anaesthesia were placed into a magnetic resonance body coil and exposed for different time durations to different specific energy absorption rate (SAR) levels at 123 MHz. Local temperatures were measured using four temperature sensors. Sensors 1–3 were placed in skeletal muscle and one sensor was placed in the rectum. Sensors 1 and 2 were placed in hot-spot areas and sensor 3 was placed at the periphery of the animals. The pigs were exposed to whole-body SAR (SAR-wb) between 2.5 W/kg and 5.2 W/kg for 30 or 60 min. Three animals received no SAR. After each experiment, muscle samples adjacent to the positions of sensors 1–3 were taken for frozen section analysis. Three characteristic parameters were chosen for investigation: SAR-wb, maximum sensor temperature (T-max), and cumulative equivalent minutes at 43 °C (CEM43 °C). Results: Histopathological criteria were established to detect acute thermal tissue damage in frozen sections such as widening of intercellular space between the muscle fibres and loss of glycogen. Clear tissue damage thresholds were found for T-max and CEM43 °C, though not for SAR-wb. For all animals with high thermal exposure, damage was also found for muscle samples adjacent to the peripheral sensor 3. Conclusions: Both T-max and CEM43, are able to predict thermal damage in porcine muscle. However, CEM43 is the less ambiguous parameter. The reasons for the occurrence of the aforementioned damage at low local temperatures at the animals’ periphery remain unclear and further investigations are needed.
Introduction
Magnetic resonance imaging (MRI) is one the most commonly used imaging methods for the evaluation of soft tissues. It allows high image contrasts by using non-ionising electromagnetic fields with few health hazards for patients and staff [Citation1]. During the MRI diagnostic procedure, patients are exposed to three types of fields, a static magnetic field, a gradient magnetic field and a radio-frequency (RF) electromagnetic field. The RF electromagnetic field in particular can cause significant thermal effects on biological tissues at certain critical levels, depending on field strength, the duration of exposure and numerous electrical, thermal and physiological parameters [Citation1–6].
Several comprehensive reviews have summarised the state of knowledge on critical thermal doses for tissues in different species [Citation1,Citation7,Citation8]. These reviews show that thermal sensitivity may differ considerably between tissues, and also between species. For instance, the brain as a very complex organ is very sensitive to even small thermal doses [Citation9]. In contrast, muscle, adipose tissue and skin tolerate higher thermal doses [Citation1,Citation8]. However, due to the lack of appropriately structured experimental approaches, exact and evidence-based recommendations for thermal dose threshold levels regarding safety guidelines of MRI are still matter of discussion.
In general, several more or less exactly measurable or derivable parameters for the investigation of thermal effects in tissue can be used, in particular specific energy absorption rate (SAR) (W/kg), maximum temperature T-max (°C) and, the so-called cumulative equivalent minutes at 43 °C (CEM43 °C) (min). Whereas in early publications damage in tissue mainly referred to T-max values [Citation10], in newer papers, in contrast, CEM43 °C is used as the respective reference parameter [Citation1,Citation7,Citation8]. In the following, for simplicity, we refer to CEM43 °C as ‘CEM43’.
The SAR can be estimated either numerically (using realistic voxel models) or experimentally. For the latter, the local SAR can be derived from temperature gradients in temperature probes [Citation11], which, however, requires a very cumbersome insertion of catheters into the tissue of interest. On the other hand, for MRI applications the averaged whole-body SAR (SAR-wb) can be estimated non-invasively using special resonant circuit techniques [Citation12]. Of course, the local SAR peaks may be much higher than SAR-wb [Citation13]. The problem is, however, that the amplitude of those local SAR peaks is very difficult to assess, because it requires aforementioned (time-dynamic) invasive temperature measurements. On the other hand, non-invasive temperature measurements are also possible (e.g. using magnetic resonance (MR) thermometry), but their precision and resolution is worse with respect to direct measurement with temperature probes [Citation14]. Furthermore, the SAR concept alone is not able to describe thresholds for thermal tissue damage since several thermally and physiologically relevant properties such as blood flow and respiration are not taken into account. Nevertheless, the SAR-wb values and also the averaged partial-body SAR values (for head, trunk, limbs, etc., depending on transmit coils used) are referred to as RF exposure limits in MR safety guidelines, such as the guidelines of the International Commission on Non-Ionizing Radiation Protection (ICNIRP) [Citation15] and of the International Electrotechnical Commission (IEC) [Citation16].
Rather than the SAR, a potential parameter which may correlate with thermal damage is the maximum temperature (T-max) reached in a certain tissue region during the thermal exposure. Dewhirst et al. (2003) presented an outstanding review of several studies of thermal tissue damage in humans and in different animal species, showing that the deleterious effect of thermal exposure is dependent on both temperature values and the duration of thermal exposure [Citation7]. In order to take both these effects into account, the CEM43 concept [Citation17] was introduced where the time–temperature data are converted into an equivalent number of minutes at 43 °C. Applying this concept, Dewhirst et al. [Citation7] obtained better correlation with thermal damage for different species than using T-max alone. CEM43 is currently discussed as the best parameter for ‘prediction’ of tissue damage since it reflects the entire history of thermal exposure as a cumulative effect even in situations with temporal variation of the tissue temperature [Citation1,Citation7,Citation8,Citation17].
Dewhirst et al. also showed that small rodent tissues are much more sensitive to heat than human tissues (note that in the past small rodents were the most commonly used animal models for examination of MRI-induced thermal effects). In contrast, pigs and their tissues seem to be more similar to their human counterparts in terms of sensitivity to thermal exposure due to similar cutaneous heat sensitivity, similar cutaneous thermoregulation by an almost hairless skin, and a similar weight-to-surface ratio [Citation7,Citation18].
The purpose of our paper is to demonstrate the results of our experimental study. In this study, pigs were exposed to different SAR-wb levels during different RF exposure times in a birdcage-type MR body coil at 123 MHz. Intramuscular temperatures were measured using temperature probes inserted into invasively placed catheters. Subsequent investigation of muscle tissue samples corresponding to the positions of temperature probes was performed using frozen sections. We investigated the relationship between histomorphological changes in tissue and in three parameters: SAR-wb, T-max, CEM43. The purpose was first to identify a parameter with the best potential for the ‘prediction’ of acute damage in skeletal muscle, and second, to evaluate threshold values (if any) for thermal damage. Note that we investigated acute damage only and not the long-term response of thermally affected tissue. The animals were euthanised directly after the RF exposure, and tissue samples were collected 2 to 4 h post mortem.
Materials and methods
Animals and anaesthesia
Fourteen (n = 14) German Landrace pigs with a body weight ranging between 61.0 and 78.0 kg were randomly assigned to four groups as listed in , the control group (Ctr; n = 3), group 1 (n = 5), group 2 (n = 3) and group 3 (n = 3). The animals were in deep anaesthesia during the complete experiment. Anaesthesia was initiated by a pre-anaesthetic sedation with subcutaneous injection of ketamine (10%, 16.6 mL/animal, Ursotamin®, Serumwerk, Bernburg, Germany), xylazine (2%, 9.3 mL/animal, Rompun®, Bayer Vital, Levrkusen, Germany) and azaperon (4.5 mL/animal, Stresnil®, Janssen Animal Health, Beerse, Belgium). The animals were intubated, but, in contrast to Shrivastava et al. [Citation9], they were allowed to spontaneously breathe without mechanical ventilation throughout the experiment. Deep anaesthesia was induced with propofol (2%, 2–3 mL/animal, Abott Greifswald, Germany) and maintained by permanent administration of propofol (3.5 mL/kg/h) and fentanyl (1–4 μg/kg KG/h, fentanyl-Janssen®) through an ear vein catheter. The vital function, respiratory rate, pulse and capillary filling time of the animals were constantly surveyed during the experiment. During the complete experiment the animals were positioned in left lateral recumbency. The experimental protocol was approved by the local committee on animal experimentation of the Office for Health and Social Affairs Berlin (approval no: G 0265/09).
Table 1. SAR-wb, T-max, CEM43 and thermal damage in porcine muscle.
High-frequency field exposure
As a necessary precondition for carrying out the experiments, an MR body coil was separated from an original clinical 3 Tesla MRI system (Siemens, MAGNETOM Trio, Erlangen, 60-cm bore diameter, operating frequency 123 MHz, driven in quadrature mode). Thus, instead of the entire MR tomograph, only the MR body coil was used (including the MR couch and the RF shield placed on a specially prepared frame). Note that the device used created local hot-spot areas, while depositing substantial energy in the whole body, with related consequence on systemic (whole-body) temperature increase. Prior to the study presented in this paper, T-rise measurements were performed in an ASTM (American Society for Testing and Materials) phantom [Citation19] and in six dead pigs, and compared with simulations and with pictures from a thermal imaging camera (the latter methods for pigs only). A good agreement was found [Citation20]. (In dead pigs, no thermoregulation is present, thus SAR and temperature comparisons are much easier than for live pigs.) The animals were exposed to RF fields delivered by a 35 kW peak power amplifier (Analogic Astex, Siemens MAGNETOM Trio), using rectangular-shaped RF pulses of constant 1 ms duration. In order to control the applied RF power, two directional couplers, one for the 0° and one for the 90° system of the MR body coil, were inserted at the RF transmission line. The RF was monitored by online evaluation of decoupled RF signals. In order to determine the applied SAR-wb, the coil efficiency was measured prior to the exposure utilising a network analyser [Citation12]. The exposure time was chosen as 30 or 60 min. Note that these exposure duration times are also used as reference for CEM43 comparisons in the review paper in van Rhoon et al. [Citation1].
The three animals of the control group (animals 1–3 in ) were kept under general anaesthesia and were placed into the bore for 30 or 60 min without exposure to RF (SAR-wb = 0 W/kg). Four animals of group 1 (animals 4–7 in ) were exposed to moderate SAR-wb values for 60 min (SAR-wb 2.5–3.1 W/kg) and one animal (animal 8 in ) for 30 min (SAR-wb = 2.6 W/kg). The three animals of group 2 (animals 9–11 in ) were exposed to high SAR-wb values (SAR-wb 4.2–5.2 W/kg) for 30 min. Finally, the three animals of group 3 (animals 12–14 in ) were exposed to high SAR-wb values (SAR-wb 3.7–4.8 W/kg) for 60 min.
Temperature sensors
As representation of the systemic body temperature, the rectal temperature was recorded using a high-resistant probe sensor placed 10 cm deep into the rectum (Sensor ‘R’ in : Bowman-type thermistor, BSD Medical, Salt Lake City, UT, measurement accuracy ±0.2 °C over a range of 25–52 °C; 3-point calibration in a stirred water bath with a National Bureau of Standards-traceable standard temperature sensor (accurate to 0.05 °C over a range of 0–60 °C).
The local muscle temperatures were recorded via optical fibre sensors inserted within catheters (3 French thickness) into the muscle area of interest (Ø 0.5 mm, FOTEMP, Optocon, Dresden, Germany; measurement accuracy ±0.2 °C, range 33–53 °C). (After the a-posteriori correction as described below in the section ‘Further details about the experimental procedure’, the measurement accuracy can be improved to ±0.04 °C for temperature range 33–50 °C.)
The positions of the sensors were determined prior to the experiments on a pig model using a computerised temperature simulation [Citation13] for solving the time-dependent bioheat transfer equation, as formulated in [Citation21]. Based on this simulation, sensors 1 and 2 were placed into areas predicted as hot-spot regions, inside the central part of the MR body coil. The positions above hot spot regions correspond to those found for dead pigs, as shown in Fig. 1 and 2 in Brinker et al. [Citation20]. Sensor 1 was placed 4 cm deep inside a catheter that was inserted perpendicular to the skin surface into the longissimus dorsi (see the schematic position marked by a circle symbol in , and ) (4 cm was chosen due to both numerical calculations and pretreatment experiments in dead pigs both reporting the local SAR and temperature maximum at around 3–4 cm deep [Citation20]. The occurrence of local temperature maximum at this depth was also confirmed for living pigs using temperature mapping measurements for several positions of sensor 1 for chosen pigs of this study). Sensor 2 was placed inside a catheter that was inserted parallel to the ribs into the obliquus externus and obliquus internus, around 0.5–1.0 cm underneath the epidermis of the thoracic wall and parallel to the skin surface (see the schematic position shown in , and ). In contrast to sensors 1 and 2, sensor 3 was placed in a region with low temperature elevation outside of the MR body coil, in the periphery of the animal, i.e. into the biceps femoris, 6 cm deep, inside a catheter that was inserted perpendicularly to the skin surface (see the schematic position shown in , and ). Note that sensor 3 was located outside of the birdcage coil where the RF field was negligible relative to the high field region inside the MR coil (see again Fig. 1 in Brinker [Citation20], with practically negligible temperature rise in this region (dark blue colour)). Additionally, the room temperature was also recorded (data not shown).
Figure 1. Qualitative comparison of macroscopic (A) and microscopic (B) thermal damage. Note the sharp transition from damaged tissue (pale area in A) to normal tissue (dark/red area in A). In A, the temperature probe is positioned within the pale damaged tissue. The damage turns out to be severe in nature, characterised by burn blister, which separates subcutaneous fat from muscle. In B, the frozen section stained with H&E shows a sharp interface between the normal muscle tissue in the lower right part of the picture and the widening of the extracellular space in the thermally damaged upper left part of the picture.
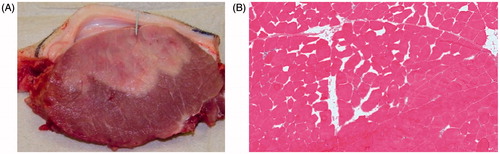
Figure 2. Morphology of thermal damage (B, D, F) in comparison to undamaged muscle (A, C, E). (A) Physiological structure of undamaged muscle stained with H&E (100×). (B) Widening of intercellular spaces in damaged muscle areas (100×). (C) Strong Periodic acid Schiff (PAS) signal in undamaged myocytes (100×). (D) Loss of PAS reaction in damaged myocytes (100×). (E) Strong myophosphorylase activity in undamaged myocytes (200×). (F) Loss of myophosphorylase activity in the damaged area (200×). Note that in A, C and E generally no extracellular space is visible and the cellular structure is well preserved. In contrast, in B, D and F the extracellular space is widened.
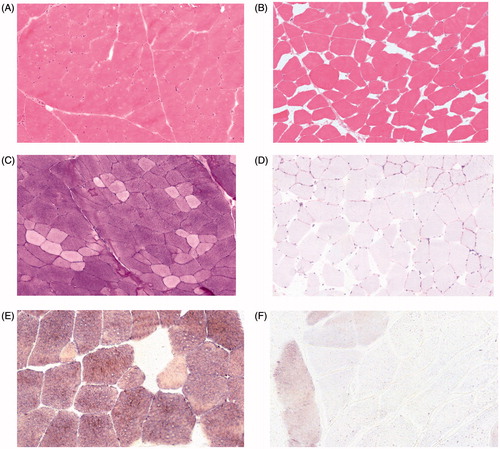
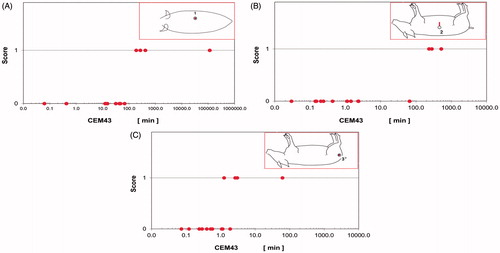
Figure 3. Relationship between SAR-wb and thermal damage in all animals for sensor 1 in longissimus dorsi (A), for sensor 2 in obliquus externus and obliquus internus (B), and for sensor 3 in biceps femoris (C). A very weak correlation is observed and no clear tissue damage thresholds can be specified for SAR-wb. Note that catheters for sensors 1 and 3 were placed perpendicular to the skin surface, and the catheter for sensor 2 was placed parallel to the skin surface.
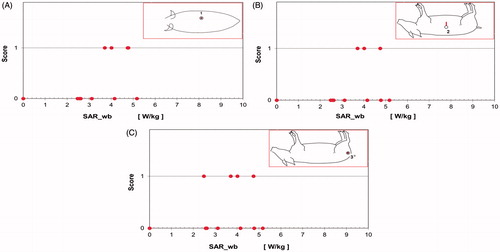
Figure 4. (A) Relationship between T-max and thermal damage for all animals for sensor 1. For values of T-max ≤45.5 °C, no thermal muscle damage is present. Values of T-max ≥45.9 °C are always associated with thermal muscle damage. (B) Relationship between T-max and tissue damage for sensor 2. For values of T-max ≤44.4 °C, no thermal muscle damage is present. Values of T-max ≥46.4 °C are always associated with thermal muscle damage. (C) Relationship between T-max and tissue damage for sensor 3. Here, for values of T-max ≤40.3 °C, no thermal muscle damage is present. Values of T-max ≥41.3 °C are always associated with thermal muscle damage. Overall, a good correlation is observed between T-max and tissue damage.
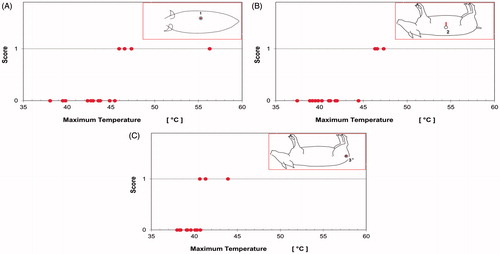
Figure 5. (A) Relationship between CEM43 and thermal damage for sensor 1. For values of CEM43 ≤68.1 min, no thermal muscle damage is present. Values of CEM43 ≥188 min are always associated with thermal muscle damage. (B) Relationship between CEM43 and thermal damage for sensor 2. For values of CEM43 ≤67 min no thermal muscle damage is present. Values of CEM43 ≥235 min are always associated with thermal muscle damage. (C) Relationship between CEM 43 °C and thermal damage for sensor 3. For values of CEM43 ≤1.1 min no thermal muscle damage is present. Values of CEM43 ≥2.7 min are always associated with thermal muscle damage.
Experimental determination of SAR-wb, CEM43 and T-max
SAR-wb was determined by evaluation of the coil efficiency using a network analyser and by measuring the RF power via directional couplers and power meters according to the procedure described in Meinke and Gundlach [Citation12]. CEM43 was calculated from recorded sensor temperatures according to the thermal dose concept developed in Sapareto and Dewey [Citation17]. T-max values were defined as the maximum temperature measured at the given sensor during the experiment.
Euthanasia and tissue sample collection
After each RF exposure, the temperature monitoring of the animals was continued for about 15 min. Subsequently, Propofol© (16 mL per animal) was injected and euthanasia was performed using 80 mL sodium chloride (7.46%, Fresenius Kabi, Bad Homburg, Germany). Full necropsy of all animals was performed 2 to 4 h post exposure, post mortem and all parenchymal organs were analysed macroscopically. For the histopathological evaluation of acute tissue damage, skeletal muscle samples adjacent to the sensors were taken, immediately frozen in methylbutane, cooled in liquid nitrogen, and stored at −80 °C. At each sensor site two blocks were generated, one in a longitudinal and the other one in a transverse orientation. In addition, for future investigations tissue samples of liver, lung, gastrointestinal tract, kidney and heart were fixed in formaldehyde.
Histopathology and enzyme histochemistry
From each frozen skeletal muscle tissue sample, 10 6-µm-thick cryo-sections were cut in order to perform stainings as described in the following. Sections were stained with haematoxylin & eosin (H&E) for the evaluation of changes in the general tissue morphology. Periodic acid Schiff (PAS) reaction was performed to analyse the integrity of the endoplasmic reticulum and the glycogen content of myocytes. Gomori trichrome stain was applied for the analysis of the mitochondrial content of myofibres. All stainings were performed using standard protocols [Citation22]. Succinate dehydrogenase (SDH) and Cytochrome C oxidase (Cox) reactions were applied to analyse the content and activity of mitochondria in skeletal muscle according to established protocols [Citation22,Citation23]. Finally, the enzyme activities of myophosphorylase and phosphofructokinase were used for the evaluation of the glycogen metabolism in the muscle cells [Citation22,Citation24].
Further details about the experimental procedure
The experiments were performed in the period from 8 March 2010 to 15 June 2010. One pig per day was treated. For logistical reasons pigs were treated on Mondays and Tuesdays, four animals in March, May, and June, respectively, and two animals in April. Each experiment started in the same part of the day, with weighing of the animals at 1 p.m., and the beginning of anaesthesia at approximately 1:30 p.m. Concurrently or somewhat earlier than the aforementioned beginning steps, the pretreatment phase was started, containing (1), the preparation of the RF equipment, (2), the pre-calibration of temperature sensors in a water bath using a reference positive temperature coefficient (PTC) thermistor, and (3), the reference measurements of the birdcage resonator with no load (necessary as a part of the experimental procedure for the determination of SAR-wb as described in [Citation12]). The PTC thermistor was calibrated prior to measurement via Siemens Calibration Service A-Calibration Laboratory according to DIN EN ISO/IEC 17025 (maximal accuracy: 0.04 °C for temperature range between 20 °C and 50 °C). The aforementioned pre-calibration was a standard FOTEMP one-point calibration at 43 °C prior to the measurement. Moreover, all measured temperature values were controlled/corrected by means of an additional special a-posteriori multi-point correction procedure (see below).
In the next step, each pig was placed on the movable MR couch, again in the left lateral recumbency, initially outside of the bore, the head towards the bore. Next, several geometrical measurements were performed in order to adjust the pig’s position on the MR couch and in the bore. For this, (1) the animal’s main axes, as well as (2) the catheter insertion points, and (3) the positions for the post mortem tissue sampling, were marked on animal’s skin. After this, the couch with the pig was moved into the bore for checking and the final adjustment of the pig with respect to the resonator’s geometry. Also, pictures were taken for documentation of the pig’s position inside the bore. In the next step the pig was again moved out of the bore, catheters were invasively inserted at the marked positions, temperature sensors were positioned at the prescribed depth inside the catheters, the rectal sensor was placed, and pictures were taken for documentation. Furthermore, pictures were taken with a thermal imaging camera (not shown in this paper). In the next step the pig was moved into the bore and the pretreatment MR measurement was performed for determination of the whole-body SAR and the corresponding generator power level (via comparison with the aforementioned measurement without load, in accordance with the procedure described in [Citation12]). After these pretreatment steps, the main part began, i.e. the generator power level, equivalent to the given SAR-wb, was applied for the prescribed time and the temperatures were recorded. Overall, this part used to begin at approximately 4–5 p.m. and ended with the death of each animal at around 6 p.m. After this, a whole-body computer tomography (CT) scan was taken for each pig for exact documentation of the geometry of the catheters and for creation of segmented models (not shown in this paper).
Parallel to the latter step (CT), the aforementioned a-posteriori cooling procedure for checking the accuracy of temperature probes (and for correcting temperature deviations) was applied. For this, all sensors, including the reference PTC thermistor, were placed into the water bath at a starting temperature which was around 2 °C higher than the highest recorded temperature during the experiment, in order to cover the whole temperature range used. Then, for around 90 min, the sensors were cooled down so that the end temperature in water bath was lower than the minimal recorded temperature in pig. The temperature differences (if any) between sensor temperatures and the reference PTC temperatures were then used for correcting for the whole temperature range the sensor temperatures recorded in the pig during the experiment.
As a last step, the pigs were transported to the pathology department and the tissue probes were taken out. Usually, the beginning of tissue sampling was around 2 h after death, i.e. it started typically at approximately 8 p.m. and ended at 10 p.m., sometimes later, i.e. the total running time of each experiment was as long as around 9–10 h.
Moreover, during several consecutive weeks, histological evaluation and evaluation of temperature data and other recorded parameters took place.
Results
Overview of local intramuscular maximum T-max temperatures in
Sensor 1 in the longissimus dorsi
The following maximum intramuscular T-max temperatures were measured by sensor 1 within the four groups: T-max values of the control group ranged between 38.1–39.5 °C, whereas animals of group 1 exhibited T-max of 42.3–43.8 °C. T-max values of group 2 were higher than those of group 1 (44.9–46.6 °C). However, the highest T-max were measured in animals of group 3 (45.9–56.3 °C).
Sensor 2 in the obliquus externus and obliquus internus
For sensor 2 in the muscles of the thoracic wall, intramuscular T-max reached values between 37.4° and 39.2 °C in the control group. The animals of group 1 showed a T-max of 39.5° up to 44.4 °C. Moreover, T-max values measured in group 2 ranged between 39.8° and 41.8 °C. Thus, in contrast to sensor 1, they were on average no higher than those of group 1. Finally, similar to sensor 1, the clearly highest intramuscular T-max were measured in animals of group 3 (46.4 °C–47.3 °C). Apart from animal 6, all values of sensor 2 were lower than those of sensor 1. Note that sensor 2 was positioned parallel to the skin and thus the heat transfer into air (‘superficial cooling’) for sensor 2 was to be expected higher than for sensor 1, which was located 4 cm deep within the muscle.
Sensor 3 in the biceps femoris
T-max values in the control group ranged between 38.0° and 39.2 °C. Maximum temperatures in group 1 showed values between 39.1° and 40.7 °C and in group 2 between 38.3° and 40.1 °C. Again, animals of group 3 exhibited the highest intramuscular T-max (41.3–43.9 °C). For cases with non-zero SAR (animals 4–14), all T-max values for sensor 3 were lower than those of sensor 1 and, except for animals 4 and 5, lower than those of sensor 2. Overall, T-max values for sensor 3 were quite comparable to the rectal T-max measured by sensor ‘R’ (rectal T-max values from are presented at the end of the Results section).
Overview of intramuscular CEM43 in
Sensor 1 in the longissimus dorsi
The following CEM43 values were determined for sensor 1 within the four groups: CEM43 of the control group ranged between 0.1–0.4 min. In group 1, CEM43 values of 12.5–47.4 min were observed. In group 2, CEM43 varied between 31.8 and 188.0 min. All animals of group 3 exhibited high or very high CEM43 values between 271 and 11,000 min.
Sensor 2 in the obliquus externus and obliquus internus
The following CEM43 values were determined for sensor 2 within the four groups: CEM43 of the control group were lower or equal to 0.2 min. In group 1, CEM43 values of 0.1–67 min were observed. In group 2, CEM43 values were clearly lower than those for sensor 1 and varied between 0.2 and 2.3 min. Again, the highest CEM43 values were observed in group 3, (235–524 min).
Sensor 3 in the biceps femoris
For sensor 3, only one animal of group 3 showed an increased CEM43 value of 62.2 min, whereas CEM43 values in all other animals were lower than 3 min: 0.1–0.6 min for the control group, 0.3–1.9 min for group 1, 0.1–1.1 min for group 2, and, 2.7–62.2 min for group 3.
Thermal damage to skeletal muscle
Thermal damage to skeletal muscle was identified macroscopically and histopathologically. At autopsy, the skeletal muscle with thermal damage appeared pale and the pale area was sharply demarcated (). The nature of the acute damage was microscopically identified by first widening the intercellular space between the skeletal muscle fibres ( and for H&E and for PAS) and, second, loss of glycogen (). Third, all animals affected by these two changes in the skeletal muscle adjacent to sensors 1–3 also exhibited a loss of myophosphorylase (), whereas the mitochondrial enzyme activity of succinate dehydrogenase (SDH) and cytochrome c oxidase (Cox) was not altered in the myocytes with thermal damage (data not shown). The corresponding results for the undamaged cases are shown in . Interestingly, we did not find any perivascular or interstitial oedema in this very acute phase (2 to 4 h post exposure, post mortem). Instead, the widening of the extracellular space is clearly due to shrinkage of the muscle fibres by glycogen loss and not caused by oedematous fluid.
As summarised in , none of the skeletal muscle tissue samples of the control group showed histopathological signs of thermal damage, i.e. there was no extracellular space between fibres. Similarly, muscle samples of groups 1 and 2 showed no damage with two exceptions. First, in animal 5 (group 1) thermal damage was present in the biceps femoris although T-max only moderately increased to 40.6 °C and CEM43 was low (1.3 min), and, second, in group 2, one animal (animal 9) exhibited thermal damage in the longissimus dorsi at sensor 1. Note that animal 9 exhibited the highest values of T-max (46.6 °C) and CEM43 (188 min) in group 2. Finally, in all animals in group 3 muscle damage was always present in all tissue probes adjacent to all sensors.
Thermal damage with respect to SAR-wb, T-max and CEM43
The three parameters, SAR-wb, T-max and CEM43, were investigated with respect to the occurrence of thermal damage, which was histopathologically categorised by two score values: score 0 (no damage) and score 1 (damage). These results are shown in and . The purpose of this investigation was first to examine if there is any correlation between SAR-wb, T-max and CEM43 and the damage score values. Second, if a correlation was found, the next step was to try to find certain values of SAR-wb, T-max and CEM43 which may be used as thresholds for occurrence of tissue damage. Note that for identification of damage we applied a conservative approach, because the damage was investigated by three stainings (H&E, PAS and myophosphorylase), and a score of 1 was identified already when just one of the three staining methods shows damage. However, apart from one position in a single animal (data not shown here), all staining methods always resulted in the same score.
Relationship between whole-body SAR values and tissue damage in muscle
No clear correlation between SAR-wb values and thermal damage in porcine muscle was found for any of three sensor locations ( for sensor 1, for sensor 2, and for sensor 3). In particular, SAR-wb values over 4 W/kg did not always result in thermal damage, but several SAR-wb values smaller than 4 W/kg caused damage. Because of this weak correlation, no clear thresholds associated with thermal tissue damage can be given for SAR-wb.
Relationship between T-max values, CEM values, and acute tissue damage in muscle
In contrast to SAR-wb, local T-max values as well as CEM43 values in muscles correlated well with thermal damage score values for sensor 1 ( and ), sensor 2 ( and ), and even for sensor 3, see and ). Moreover, identification of certain thermal tissue damage limits that depend on T-max (or CEM43) values seems to be possible for investigated animals. We are able to specify reasonable values for given sensors, which we refer to as ‘lower’ and ‘upper’ thresholds:
The ‘lower’ threshold (‘T-low’ or ‘CEM43-low’) for a certain tissue region (associated with a certain sensor number) is a value below or equal to which thermal damage is never present among all investigated animals.
The ‘upper’ threshold (‘T-up’ or ‘CEM43-up’) for a certain tissue region (associated with a certain sensor number) is a value above or equal to which thermal damage is always present among all investigated animals.
In particular, for sensor 1 ( and/or ) no thermal muscle damage was present for values of T-max ≤45.5 °C and/or CEM43 ≤68.1 min. Values of T-max ≥45.9 °C and/or CEM43 ≥188 min were always associated with thermal muscle damage. Thus, for sensor 1 the thresholds were T-low = 45.5 °C, CEM43-low = 68.1 min, T-up = 45.9 °C, CEM43-up = 188 min.
For sensor 2 ( and/or ) no thermal muscle damage was present for values of T-max ≤44.4 °C and/or CEM43 ≤67 min. Values of T-max ≥46.4 °C and/or CEM43 ≥255 min were always associated with thermal muscle damage. Thus, for sensor 2 the thresholds were T-low = 44.4 °C, CEM43 = 67 min, T-up = 46.4 °C, CEM43-up = 235 min. Finally, for sensor 3 ( and/or ) no thermal muscle damage was present for values of T-max ≤ 40.3 °C and/or CEM43 ≤1.1 min. Values of T-max ≥41.3 °C and/or CEM43 ≥2.7 min were always associated with thermal muscle damage. Thus, for sensor 3 the thresholds were T-low = 40.3 °C, CEM43-low = 1.1 min, T-up = 41.3 °C, CEM43-up = 2.7 min.
In terms of MR safety considerations, the ‘lower’ threshold is the more important one (‘no damage to be expected’). However, the ‘upper’ threshold also yields us valuable information in terms of levels for which damage is surely to be expected. Furthermore, the above ‘double-sided’ threshold definition makes it possible to define an ‘uncertainty interval’ between both thresholds (T-low < T-max < T-up as well as CEM43-low < CEM43 < CEM43-up), for which neither the statement ‘never damage’ nor ‘always damage’ are true. For instance, in terms of T-max, this interval contains cases when animal A has a higher T-max and a lower score than animal B, so, within the ‘uncertainty interval’ the score values more or less randomly ‘alternate’ with respect to T-max scale (e.g. animal 4 (T-max = 40.7 °C, score = 0) versus animal 5 (T-max = 40.6 °C, score = 1) for sensor 3, see ). Second, even if the score values do not alternate and T-low and T-up are adjacent values on T-max scale (like for sensors 1 and 2 in ), the interval between T-low and T-up remains uncertain with respect to possible score values (e.g. for sensor 2, the interval between T-low = 44.4 °C and T-up = 46.4 °C). This is due to the discrete number of animals and the finite resolution of T-max scale, so this interval is simply not covered by the experimental data.
Of course, sensors 1 and 2 were placed into regions with high local SAR inside the MR body coil, whereas sensor 3 was representative for peripheral heat effects, as it was located in the periphery outside of the MR body coil, where practically no local SAR was present. Consequently, T-max values measured by sensor 3 were much lower than those registered by sensors 1 and 2.
Furthermore, it is worth noting that
for sensors 1 and 2, quite similar tissue damage threshold values were identified, although the muscle types are not identical;
for sensor 3, tissue damage ‘threshold’ values were much lower than those for sensors 1 and 2. As this is rather an unexpected result (see Discussion), for sensor 3 we would prefer to refer to ‘damage-related values’ rather than speaking of ‘thresholds’;
in contrast to T-max values, CEM43 values ranged from very low to extremely high, so they seem to be more sensitive as an evaluation parameter than T-max values.
Rectal temperature
Rectal temperature values were recorded as representations of the systemic body temperature before and during anaesthesia. The rectal sensor was placed outside of the body coil, where the SAR was negligible. Note that the device used created local hot-spot areas, while depositing substantial energy in the whole body, with related consequences on systemic temperature increase. Maximum rectal temperatures varied between and within the four groups (, sensor R). Control animals (no SAR) exhibited maximum rectal temperatures between 37.2° and 38.8 °C. Maximum rectal temperatures of the animals of group 1 (moderate SAR) reached 39.4° to 40.9 °C. Similar maximum temperature values (38.4° and 40.5 °C) were reached in the animals of group 2 (high SAR, 30 min). The highest values of the rectal temperature were reached among the animals of group 3 (high SAR, 60 min), with 41.5–44.0 °C. The rectal maximum temperatures moderately correlated with the presence of thermal damage in muscle tissue at sensors 1–3 (see the last three columns in ). Maximum rectal temperatures above or equal to 41.5 °C were always associated with thermal damage in all muscles analysed. This temperature value seems to be the ‘upper threshold’ value of rectal temperature for occurrence of damage. However, a quite irregular behaviour was observed below this temperature The ‘lower’ value, below which no damage occurs, was as low as 38.3 °C, so there was a wide interval of more than 3 °C between the ‘lower’ and the ‘upper’ values, where both 0 and 1 damage score values randomly alternated with respect to T-max scale. In all, the maximum rectal temperatures were similar to the maximum temperatures recorded by sensor 3.
Temporal behaviour of local temperatures in muscle
For every sensor, local temperatures were measured and registered before, during, and after RF exposure. As two examples, local temperature responses for animals 12 (group 3) and 6 (group 1) for sensors 1, 2, 3, are shown in , respectively. For comparison, the rectal temperatures are also shown and they are almost identical to those recorded for sensor 3, more or less monotonously increasing during the experiment. In contrast, for sensors 1 and 2, more or less pronounced cycling behaviour was observed, similar to that discussed as types II and III in Chen and Roemer [Citation25]. The cycling behaviour can be especially observed if the power level is high and irradiation times are long, like it is in case of , and it is much more pronounced for sensor 1 than for sensor 2. In particularly, the following ‘phases’ can be identified for the temperature response.
Phase 1: Almost linear increase of temperature after starting the RF irradiation until around 15 min.
Phase 2: Flattening of the increase until the maximum value at about 27 min.
Phase 3: Decrease of temperature, similar to a cosine function between the first maximum (shown here at 27 min) and first minimum (shown here at 41 min).
Phase 4: Re-increase of temperature, similar to a cosine function between the first minimum (shown here at 41 min) and second maximum (shown here at around 51 min).
Phase 5: Decrease of temperature similar as in Phase 3; however, obviously without reaching the ‘true’ second minimum of the cosine-like function, because the power was switched off at 60 min.
Decay phase 6: An exponential-like temperature decay phase after the power has been switched off (after 60 min for both sensors).
Figure 6. Sensor temperatures for pig 12 (A) and 6 (B) versus time, during RF irradiation in the MR body coil, for sensors 1 (green line), 2 (blue line), 3 (purple line), and R (rectal, black line). Two lower thresholds are displayed as horizontal red lines: T-low = 45.5 °C for sensor1 (solid line), T-low = 44.4 °C for sensor 2 (dashed line). Also, the lower damage-related value T-low = 40.3 °C for sensor 3 (dotted line) is displayed. The time scales on the abscissa axes are arranged so that the start and the end of the RF irradiation are at 0 and 60 min, respectively (both values are marked by light blue vertical lines). Note that temperatures for sensors 3 and R (rectal) are almost identical.
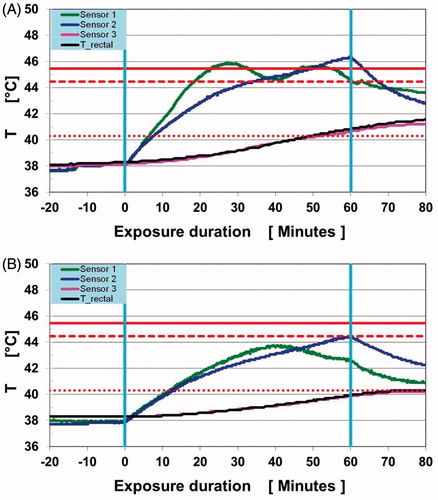
At sensor 1 for pig 6 in we notice first that, due to the lower power the curve is generally less steep that that discussed above in . Second, we recognise phases 1, 2 and 3 which are, however, longer (phase 1 ends at around 30 min, phase 2 at around 41 min, phase 3 at 60 min). Phases 4 and 5 are not present, but it is to be assumed that they would appear if power were to be applied longer than 60 min.
Temperatures at sensor 2, for both pigs 6 and 12, show solely the behaviour of the aforementioned phase 1, and the beginning of phase 2 is also present, so in all, the cycling behaviour is less recognisable than for sensor 1. For some other pigs (e.g. pig 14, not shown here) a more pronounced cycling-like behaviour, containing phase 3 and sometimes 4 may also occur for sensor 2.
Additionally, in , the rectal temperature and the temperature at peripheral sensor 3 are also displayed. It is evident that these temperatures are almost identical.
Discussion
In the present study we experimentally investigated whole-body SAR, maximum temperature, and CEM43 with respect to their suitability for ‘prediction’ of acute thermal damage in skeletal porcine muscle due to RF irradiation in a birdcage-type MR body coil at 123 MHz. The necessary precondition for this ‘prediction’ had been a histopathological identification of the nature of the acute thermal damage in skeletal muscle. We developed reliable criteria to detect acute tissue damage in frozen sections, which are 1), the widening of the extracellular space, and 2), loss of glycogen in the muscle cells. In previous studies [Citation10], acute muscle damage has been investigated after 18–24 h and consisted of oedema, vascular damage, necrosis and granulocytic infiltration. In contrast, in our study the investigated acute phase was 2 to 4 h post exposure, post mortem. After this short time interval we did not observe oedema, necrosis or inflammatory infiltrations. Consequently, the apparent widening of the extracellular space should rather be attributed to the shrinkage of the muscle fibres due to loss of glycogen.
Three parameters, SAR-wb, T-max and CEM43, were investigated for RF exposure durations of 30 min or 60 min with respect to the occurrence of thermal damage, which was histopathologically identified by two score values: score 0 (no damage) and score 1 (damage). Microscopically and macroscopically, we identified a sharp boundary between normal, unaltered muscle (score 0) and muscle with acute thermal damage (score1). The tissue probes were taken at defined positions adjacent to the temperature sensors. Sensors 1 and 2 were placed in hot-spot areas that had been numerically predicted prior to the experiments using the method described in the Appendix of Nadobny et al. [Citation13]. Sensor 3 was placed in the periphery of the animal outside the body coil. Sensor R was placed into the rectum.
An overview of score values in makes evident that for causing thermal damage a combination of both high whole-body SAR levels and long duration times is necessary. Thus, the time factor is highly important. The only two exceptions were sensor 3 in animal 5 (60 min RF exposure time, however only moderate SAR-wb), and sensor 1 in animal 9 (high SAR-wb, but only 30 min RF exposure time). Furthermore, we show that SAR-wb alone does not correlate well with the tissue damage. This indicates again that SAR-wb alone is probably not adequate to ‘predict’ muscle damage. Note that SAR values are used as limits in IEC [Citation16].
Furthermore, in IEC [Citation16], limits for the maximum systemic body temperature (and temperatures in big body parts such as the head or trunk) are specified too. In our experiment the rectal temperature was used as representation of the systemic body temperature. The rectal maximum temperatures moderately correlated with the presence of thermal damage in muscle tissue at sensors 1–3. Maximum rectal temperatures above or equal to 41.5 °C were always associated with thermal damage in all muscles analysed. This temperature value seems to be the ‘upper’ threshold of rectal temperatures for occurrence of damage. The ‘lower’ threshold, below which no damage occurs, was as low as 38.3 °C, so there was a wide interval of more than 3 °C between both those thresholds, where both 0 and 1 damage score values randomly alternated with respect to T-max scale.
In contrast to the aforementioned systemic (whole-body-based) parameters, SAR-wb (week correlation) and rectal temperature (sensor R, moderate correlation), we observed a strong correlation between thermal damage and local thermal parameters (T-max and CEM43) in muscle tissue (sensors 1, 2 and 3). Moreover, for both T-max and CEM43 we are able to specify clear ‘lower’ and ‘upper’ thresholds for the aforementioned sensors. ‘Lower’ thresholds for sensors 1 and 2, i.e. in the hot-spot areas, were quite similar. The same was true for ‘upper’ thresholds. This indicates that the physiological behaviour of the two muscles, longissimus dorsi (for sensor 1) and obliquous externus and internus (for sensor 2) does not notably differ. In contrast, for sensor 3, i.e. in the periphery of the animal in the biceps femoris, much lower threshold values were found, although practically no SAR and therefore no high local temperature elevations were present in this region. Note that the temperatures at peripheral sensor 3 were very similar to the rectal temperatures, even in terms of the temporal behaviour.
Moreover, in terms of absolute values, ‘lower’ and ‘upper’ thresholds for T-max are closer together than those for CEM43. For instance, for sensor 1, the difference between these temperature thresholds was as low as 0.4 °C (T-up − T-low = 45.9 − 45.5 °C = 0.4 °C), but the difference between the CEM43 thresholds was as high as 119.9 min (CEM43-up − CEM43-low = 188 − 68.1 min = 119.9 min). For sensor 2 the respective differences were 2.2 °C and 168 min. Thus, the aforementioned ‘uncertainty interval’ was much larger for CEM43 than for T-max. Therefore, CEM43 can be seen as the less ambiguous parameter with respect to the classification/differentiation of score values (no damage/damage). Obviously, CEM43 has more potential than T-max with respect to ‘resolution’ of these ‘uncertainty intervals’ and thus, in terms of absolute values, this parameter has higher precision than T-max to ‘predict’/describe thermal damage in porcine muscle.
In fact, CEM43 is the parameter increasingly used in literature for describing thermal damage, whereas in early papers T-max was the reference parameter. For instance, using local RF hyperthermia, Martinez et al. [Citation10] reported (relatively minor) tissue damage in the porcine lateral skeletal muscle layer (1-day biopsies) above 44 °C. Note that sensor 2 in our paper (which was also located in a similar muscle layer) yields T-low = 44.4 °C.
In newer papers, CEM43 is discussed as the best parameter for ‘prediction’ of tissue damage since it reflects the entire history of thermal exposure as a cumulative effect even in situations with temporal variation of the tissue temperature [Citation1,Citation7,Citation8,Citation17]. According to Dewhirst et al. [Citation7] and Yarmolenko et al. [Citation8], first histologically detectable thermal tissue damage can be expected in the muscle tissue of pigs at the level of 41–80 CEM43. In van Rhoon et al. [Citation1], similar values of around 80 CEM43 were reported. Comparing these values with the ‘lower’ CEM43 thresholds from our study, we have to state that in our experiments these thresholds generally depend on whether the sensors were placed in hot-spot areas (sensors 1 and 2) or peripheral areas (sensor 3). It is worth noting that for sensors 1 and 2 CEM43-low showed values (68.1 min and 67 min) in the range of 41–80 min [Citation1,Citation7,Citation8]. In contrast, CEM43-low for sensor 3, lay clearly below 41 CEM43 from Dewhirst et al. [Citation7] and Yarmolenko et al. [Citation8].
For the peripheral sensor 3, even all CEM43 values with score = 1 were far below 30 min, except for the highest value in the highly damaged animal 14 from group 3, where a temperature value as high as 43.9 °C was reached at the end of the exposure. Incidentally, this value corresponds very well to the high value in the rectal sensor (44 °C), indicating that this animal was probably overheated as an organism. Note, however, that the highest temperatures in sensors 1 and 2 were reached not in animal 14, but in animal 13, indicating that the thermoregulation behaviour may vary from animal to animal in a highly individual way.
The very low damage-related values for sensor 3 may suggest that damage mechanisms leading to tissue damage may exist in areas where SAR is practically zero. This ‘indirect’ damage is present at much lower local temperatures and much lower CEM43 values than those in the hot-spot areas. In all probability, the damage at sensor 3 is not due to the local effects (high SAR, high local temperature, tissue pressure), but rather to the systemic exposure effects (increase of systemic temperature, respiration, heart rate). Note that all highly exposed animals of group 3 showed damage at sensor 3, but the general health condition in these last three animals may be comparable to ‘malignant hyperthermia’, whereby thermoregulation is strongly disturbed. Thus health conditions may be completely different to animals 4–11, with mostly no damage at sensor 3.
Non-thermal reasons for this damage are also theoretically conceivable. However, the damage was not caused by the local tissue pressure, for example, because during the whole experiment each pig was placed in the left lateral recumbency, but sensor 3 was positioned on the right lateral side of the animal.
In all, the reasons for the occurrence of the aforementioned damage at low local temperatures at the animal’s periphery remain unclear and further investigations are needed.
In conclusion, the present study suggests that both T-max and CEM43 are able to ‘predict’ thermal damage in porcine muscle. In terms of absolute values, the parameter with the highest resolution is CEM43.
Furthermore, a highly individual very complex thermoregulation behaviour can also be observed using local temperature curves for the sensors. Interestingly, under the special conditions of our experiment (e.g. constant power over time, animals under anaesthesia) temperature curves in all animals generally showed no temperature plateau, but in most cases rather a cycling-like behaviour, in most cases similar to types II–III, as reported in Chen and Roemer [Citation25]. The mechanisms influencing and regulating local temperature are quite complex as was shown for animals 12 and 6 in the Results section. The almost linear increase of temperature after starting the RF irradiation (phase 1) leads to the conclusion that during this phase the (initial) perfusion remains nearly constant (basal blood perfusion [Citation21]). The flattening of temperature increase in phase 2 and the decrease of temperature in phase 3 are obviously due to thermal regulation resulting in increased perfusion and increased respiratory and heart rates, for example. After this phase of ‘local cooling’, however, in phase 4 a re-increase of local temperatures took place, followed by the next ‘cooling’ phase due to increased perfusion. The question in which particular phase tissue damage is caused is still an open question.
In most cases the cycling behaviour is much more pronounced for sensor 1 than for sensor 2. Note that sensor 1 was placed 4 cm deep in the big muscle region while sensor 2 was subcutanously placed into a quite narrow muscle layer, thus the thermal behaviour at sensor 2 was affected by thermal transfer effects both into air and into the gastro-intestinal system. Finally, the temperature for both sensor 3 and the rectal temperature show a non-cycling but rather monotonously increasing behaviour.
In conclusion, RF exposures beyond values typically used in clinical MRI but within or slightly beyond the limits used of the IEC [Citation16] may cause acute tissue damage in porcine muscle. However, the question arises as to what extent the information obtained by these animal-related thresholds are transferable to humans. On one side, among available experimental animals, the pig is the most similar to human, and the young pigs used in these experiments had comparable size and weight. On the other side, however, lung volume and heart volume in pigs are smaller, the capillary density in the muscles is lower ([Citation26] in comparison to [Citation27]). Thus, the pig model seems to be more conservative one, i.e. in humans probably lower local temperatures would be present with the same exposure conditions. In addition, fortunately most exposure times of human patients are usually well below 60 min in the sense of cumulative pulse duration times.
Conclusion
Histopathological criteria were established to detect acute thermal tissue damage in frozen sections such as widening of intercellular space between the muscle fibres and loss of glycogen. In the investigated acute phase of 2–4 h post exposure, post mortem, we did not find any perivascular or interstitial oedema. Instead, the widening of the extracellular space is clearly due to shrinkage of the muscle fibres by glycogen loss and not caused by oedematous fluid. Clear tissue damage thresholds were found for maximum local temperature and CEM43 in porcine muscle. Thus, the present study suggests that both T-max and CEM43 are able to ‘predict’ acute thermal damage in porcine muscle. However, CEM43 is the less ambiguous parameter with respect to the classification/differentiation of score values (no damage/damage). RF exposures beyond values typically used in clinical MRI but within or slightly beyond the limits of the IEC [Citation16] may cause acute tissue damage in porcine muscle. However, how these results can be transferred to humans remains an open question.
Finally, the reasons for the occurrence of damage at low local temperatures for the animal’s periphery remain unclear and further investigations are needed.
Acknowledgements
The authors are deeply indebted to Eckart Stetter (Siemens) and Peter Wust (Charité) for initiating the study and for organising the financial, technical and logistic support from Siemens and Charité. Furthermore, we would like to thank Christian Grosse-Siestrup (Charité) who was responsible for the official authorisation to carry out the animal experiments and for supervising this project in the field of veterinary medicine, as well as for recruiting the veterinary staff listed below. We thank Chie Hee Cho (Charité) and Peter Wust for valuable contributions to the study with their experience in hyperthermia. The practical realisation of experiments could not have been achieved without Chie Hee Cho and the competent and skilful assistance of Sarah Ribéreau, Friederike Kobelt and Markus Piaskowski (all three students of the Veterinary Faculty of the Free University Berlin).
Declaration of interest
This research was supported by Siemens Healthcare Sector, Erlangen, and Charité Berlin. The authors report no conflicts of interest. The authors alone are responsible for the content and writing of the paper.
References
- van Rhoon GC, Samaras T, Yarmolenko PS, Dewhirst MW, Neufeld E, Kuster N. CEM43 °C thermal dose thresholds: A potential guide for magnetic resonance radiofrequency exposure levels? Eur Radiol 2013;23:2215–27
- Formica D, Silvestri S. Biological effects of exposure to magnetic resonance imaging: An overview. Biomed Eng Online 2004;3:11
- Shellock FG. Radiofrequency energy-induced heating during MR procedures: A review. J Magn Reson Imaging 2000;12:30–6
- Shellock FG, Crues JV. MR procedures: Biologic effects, safety, and patient care. Radiology 2004;232:635–52
- Marshall J, Martin T, Downie J, Malisza KA. Comprehensive analysis of MRI research risks: In support of full disclosure. Can J Neurol Sci 2007;34:11–17
- Shellock FG. Thermal responses in human subjects exposed to magnetic resonance imaging. Ann N Y Acad Sci 1992;649:260–72
- Dewhirst MW, Viglianti BL, Lora-Michiels M, Hanson M, Hoopes PJ. Basic principles of thermal dosimetry and thermal thresholds for tissue damage from hyperthermia. Int J Hyperthermia 2003;19:267–94
- Yarmolenko PS, Moon EJ, Landon C, Manzoor A, Hochman DW, Viglianti BL, et al. Thresholds for thermal damage to normal tissues: An update. Int J Hyperthermia 2011;27:320–43
- Shrivastava D, Hanson T, Kulesa J, DelaBarre L, Iaizzo P, Vaughan JT. Radiofrequency heating at 9.4T (400.2 MHz): In vivo thermoregulatory temperature response in swine. Magn Reson Med 2009;62:888–95
- Martinez AA, Meshorer A, Meyer JL Hahn GM, Fajardo LF, Prionas SD. Thermal sensitivity and thermotolerance in normal porcine tissues. Cancer Res 1983;43:2072–5
- Roemer RB, Fletcher AM, Cetas TC. Obtaining local SAR and blood perfusion data from temperature measurements: Steady state and transient techniques compared. Int J Radiat Oncol Biol Phys 1985;11:1539–50
- Meinke H, Gundlach F. Taschenbuch der Hochfrequenztechnik. Berlin: Springer-Verlag 1968, pp. 190–2
- Nadobny J, Szimtenings M, Diehl D, Stetter E, Brinker G, Wust P. Evaluation of MR-induced hot spots for different temporal SAR modes using a time-dependent finite difference method with explicit temperature gradient treatment. IEEE Trans Biomed Eng 2007;54:1837–50
- Nadobny J, Wlodarczyk W, Westhoff L, Gellermann J, Felix R, Wust P. A clinical water-coated antenna applicator for MR-controlled deep-body hyperthermia: A comparison of calculated and measured 3-D temperature data sets. IEEE Trans Biomed Eng 2005;52:505–19
- ICNIRP International Commission on Non-Ionizing Radiation. Protection guidelines for limiting exposure to time-varying electric, magnetic, and electromagnetic fields (up to 300 GHz). Health in Physics 1998;74:494–522
- IEC International Electrotechnical Commission. Medical electrical equipment – Part 2-33: Particular requirements for the safety of magnetic resonance equipment for medical diagnosis. 2002; IEC 60601-2-33:2002 + A1:2005 + A2:2007
- Sapareto SA, Dewey WC. Thermal dose determination in cancer therapy. Int J Radiat Oncol Biol Phys 1984;10:787–800
- Moritz AR, Henriques FC. Studies of thermal injury: II The relative importance of time and surface temperature in the causation of cutaneous burns. Am J Pathol 1947;23:695–720
- ASTM F2182-02a, ‘Standard Test Method for Measurement of Radio Frequency Induced Heating Near Passive Implants During Magnetic Resonance Imaging’. West Conshohocken, PA: ASTM International
- Brinker G, Grosse-Siestrup C, Cho CH, Reiter K, Habekost K, Wust P, Lazar R, Hebrank F, Stetter E, Nadobny J. Experimental setup with a whole-body resonator for investigating thresholds of tissue damage in swine model exposed at 123 MHz – First measurement results. Poster presented at ISMRM Annual Meeting 2010, Stockholm, Available: http://cds.ismrm.org/protected/10MProceedings/files/1443_3001.pdf]
- Pennes HH. Analysis of tissue and arterial blood temperatures in the resting human forearm. J Appl Physiol 1948;1:93–122
- Dubowitz VS, Sewry CA, Lane RJM. Muscle Biopsy A Practical Approach. Philadelphia: Saunders, 2007
- Brooke MH, Kaiser KK. Muscle fiber types: How many and what kind? Arch Neurol 1970;23:369–79
- Cumming, WJ. Color Atlas of Muscle Pathology. London: Mosby-Wolfe, 1994
- Chen C, Roemer RB. A thermo-pharmacokinetic model of tissue temperature oscillations during localized heating. Int J Hyperthermia 2005;21:107–24
- Jorgensen K, Nicholaisen T, Kato M. Muscle fiber distribution, capillary density, and enzymatic activities in the lumbar paravertebral muscles of young men. Significance for isometric endurance. Spine 1993;18:1439–50
- Ruusunen M, Puolanne E. Comparison of histochemical properties of different pig breeds. Meat Sci 1997;45:119–25