
 ?Mathematical formulae have been encoded as MathML and are displayed in this HTML version using MathJax in order to improve their display. Uncheck the box to turn MathJax off. This feature requires Javascript. Click on a formula to zoom.
Abstract
Purpose: The pleiotropic effects of heat on cancer cells have been well documented. The biological effects seen depend on the temperature applied, and the heating duration. In this study we investigate the cytotoxic effects of heat on colon cancer cells and determine how different cell death processes such as autophagy, apoptosis and necroptosis play a role in cell response. Materials and methods: The thermal dose concept was used to provide a parameter that will allow comparison of different thermal treatments. Two human colon cancer cell lines, HCT116 and HT29, were subjected to ablative temperatures using a polymerase chain reaction thermal cycler. Temperature was recorded using thermocouples. Cell viability was assessed using the MTT assay. Induction of apoptosis was estimated using an enzyme-linked immunosorbent assay that detects cleaved cytoplasmic nucleosomes. Protein regulation was determined using immunoblotting. The percentage of cells undergoing apoptosis and autophagy was determined with annexin V/propidium iodide staining and a cationic amphiphilic tracer using fluorescence-activated cell sorting analysis. Results: Exposure of colon cancer cells to ablative thermal doses results in decreased cell viability. The cytotoxic effect of heat is associated with induction of apoptosis and autophagy, the amount depending on both the thermal dose applied and on the time elapsed after treatment. Autophagy induction is mainly seen in live cells. RIPK3 protein levels are increased after exposure of cells to heat. A necroptosis inhibitor does not affect cell viability. Conclusions: Autophagy, apoptosis and necroptosis are associated with the response of these cancer cell lines to supra-normal temperatures.
Introduction
Cancer mortality accounts for more than 150,000 deaths a year in the UK [Citation1], with the most reliable estimate for the worldwide death toll being more than 8 million deaths in 2012 alone [Citation2]. Novel modalities that address the monitoring and treatment of this group of more than 200 diseases, collectively referred to as cancer, are therefore urgently needed.
One modality with promise for therapeutic benefit is high intensity focused ultrasound (HIFU). HIFU has found clinical application in neurosurgery [Citation3], ophthalmology [Citation4] and oncology [Citation5,Citation6]. It is currently an approved treatment option for uterine fibroids [Citation7,Citation8] and its application in patients with prostate cancer [Citation9,Citation10], breast cancer [Citation11] and liver cancer [Citation12] is also being investigated.
HIFU exposures selectively increase the temperature of target tissues and can result in cell necrosis [Citation6,Citation13]. The biological consequences of a tissue’s exposure to heat depend on both the temperature rise and the heating time. Thermal treatments are often described in terms of thermal dose (TD) which has the units of equivalent minutes at 43 °C (EM43). This concept attempts to provide a parameter that allows comparison of treatments delivered at different temperatures for varying lengths of time. Using knowledge of the temperature achieved as a function of time, and a mathematical description of this relationship for thermal damage, a treatment can be related to an exposure time at a chosen reference temperature. For hyperthermia treatments, the reference temperature chosen is 43 °C [Citation14]. The widely accepted TD formulation suggests that, for each 1 °C increase in temperature, treatment time should be halved to achieve the same TD. Equation Equation1(1)
(1) shows this mathematically:
(1)
(1)
where, t1 is the time at temperature T1, R = 0.25 for temperatures <43 °C, 0.5 for temperatures >43 °C. Since a typical temperature profile consists, at a minimum, of three phases: an initial heating period, a period of approximately constant temperature, and a cooling period, it is necessary to calculate the accumulated thermal dose using the expression in Equation Equation2
(2)
(2) :
(2)
(2)
where
is the average temperature during time Δt. This relationship has been tested and found to provide a reasonable prediction of thermal damage for temperatures up to 47 °C [Citation14], the range for which it was originally formulated, but has not been fully validated for ablative thermal treatments at high temperatures (>56 °C) for short times (<5 s). Clinically, a TD of 240 min is given to ensure that thermal ablation has been achieved. The work presented in this paper is part of a wider programme investigating the validity of TD in these rapid, high temperature heating regimes.
Several forms of programmed cell death are known to exist. These include apoptosis [Citation15], autophagy [Citation16,Citation17] and necroptosis [Citation18]. Apoptosis is a cell suicide process which eliminates damaged or unwanted cells in a controlled physiological manner. Its importance in disease is well documented. For example, dysregulation of apoptosis can contribute to cancer by the failure to eliminate unwanted cells. In addition, some chemotherapeutic drugs have been shown to damage cancer cells by activating apoptosis [Citation19]. Hallmarks of apoptosis include the release of cleaved cytoplasmic nucleosomes and phosphatidylserine exposure on the outer surface of plasma membrane [Citation20].
Autophagy is a recycling process which cells use to respond to stress conditions by catabolising their own components. It involves the formation of enclosed lipid membranes, referred to as autophagosomes, to contain proteins, organelles and nutrients. Autophagosomes are fused with lysosomes, nutrients are degraded, and the basic building blocks essential for the cell to survive are released [Citation17]. Autophagy has been implicated in physiological processes, and it has been proposed that tumours may hijack the autophagy machinery to enhance their survival opportunities [Citation21]. Hallmarks of autophagy include formation of the autophagosome, and increased levels of associated proteins such as LC3II [Citation17].
Necrosis was traditionally thought of as accidental cell death characterised by cell swelling, release of intracellular components and activation of inflammation. Recently, the dependence of some forms of necrosis on proteins such as the RIPK1/RIPK3 kinases has been suggested [Citation22]. The term necroptosis is used to describe gene-dependent forms of necrosis [Citation18].
In this study we determine the cytotoxic effects of increasing TD on HCT116 and HT29 colon cancer cells. These represent well-characterised models of epithelial adenocarcinoma with low basal levels of autophagy and apoptosis, thus making them suitable for our investigation. We investigate the association of autophagy, apoptosis and necroptosis with the cellular responses observed.
Materials and methods
Thermal exposures and thermometry
For this study, cells in suspension were placed in 0.2 mL medical grade polymerase chain reaction (PCR) tubes (Corning, NY, USA) with wall thickness ranging from 0.35 mm in the tip of the tube to 0.4 mm in its middle (measured in-house) and heated using a Biorad Tetrad2 DNA Engine PCR thermal cycler (Hercules, CA). In this system, the temperature of the thermal block can be varied in a discrete pre-programmed (thermal accuracy ± 0.3 °C at 90 °C, thermal uniformity ± 0.4 °C well-to-well at 90 °C, ramping speed up to 3 °C/sec, power 850 W max, 0.1 °C step size).
To record the correlation between the thermal cycler settings and the actual temperature in the tube, thermocouples were placed at different positions in each tube (e.g. centrally, or on the wall) and in different tube positions in the thermal block. Temperatures were recorded using T-type thermocouples (−50 °C to +200 °C) with 0.2 mm wire thickness, 0.57 mm probe diameter, and accuracy of ±0.5 °C up to 125 °C (cat. no. 6212164, RS Instruments, Corby, UK). Thermocouple offset was estimated at the National Physical Laboratory (Teddington, UK) using a source of known temperature at 20 °C. Thermocouples were placed in the PCR tubes, with the top of the block closed as in the cell experiments, and connected to a laptop via a cDAQ-9171 National Instruments data logger (Austin, TX). Temperature was recorded up to four times per second in discrete equal intervals using custom-written Matlab software (). The temperature was then converted to TD using Equation Equation2(2)
(2) . An example of the temperature–time profiles achieved is shown in . The thermal dose calculated using Equation Equation2
(2)
(2) for each thermocouple is 126.8 min (thermocouple 1), 127.3 min (thermocouple 2), 126.5 min (thermocouple 3), 124.4 min (thermocouple 4), 129.9 min (thermocouple 5), giving a mean TD of 127 ± 2 min ().
Figure 1. Variation of temperature with time as recorded on five thermocouples placed in different tubes in the thermal cycler during the same experiment. Temperature was recorded three times a second.
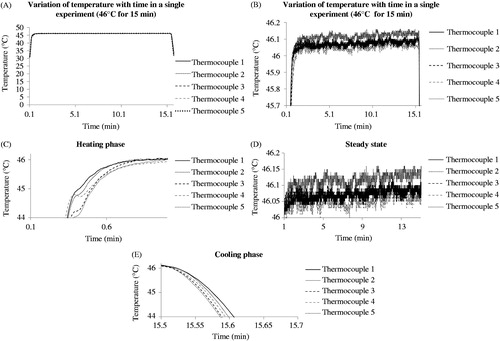
Table 1. Thermal exposure of colon cancer cells, and associated thermal dose accuracy.
Cell culture
HCT116 and HT29 cells were maintained in a sub-confluent monolayer at 37 °C in a humidified atmosphere containing 5% CO2. They were propagated using Hyclone McCoy’s 5 A medium supplemented with 10% foetal bovine serum (FBS), 2 mM L-glutamine, 50 U/mL penicillin, 50 mg/mL streptomycin B, and sub-cultured using Accutase (Sigma, Poole, UK). Screening for mycoplasma contamination was carried out on a monthly basis.
For the experiments, cells from culture were detached using Accutase and transferred to PCR tubes at 4 °C in equal volumes at a density of 106 cells/mL. Tubes were heated in three steps using the pre-programmed temperature/time combinations presented in . Initially, cells were kept at 4 °C for 1 min to ensure smooth transition from cell culture to the thermal cycler. This step ensured that all cells had the same low starting temperature at which intracellular enzymatic and kinase activity should be limited. This allowed the effects of heat alone to be assessed. Cells were then heated at 37 °C, 45 °C, 46 °C or 47 °C for 15 min to deliver corresponding thermal doses of 0, 60, 120 and 240 min. Finally cells in tubes were left at 4 °C for 1 min and transferred to ice. By placing cells at this temperature, their transfer to a laminar flow hood at a temperature which limits intracellular signalling activity is ensured. Cells were then placed in flasks or plates containing 37 °C medium for further processing.
Assays
Cell viability: MTT assay
An MTT assay was used to investigate cell viability. This assay is based on the reduction of the tetrazolium dye MTT 3-(4,5-dimethylthiazol-2-yl)-2,5-diphenyltetrazolium bromide to formazan in mitochondria. The signal from the assay correlates with live cell numbers over a range of 0–106 cells/mL. Following treatment, cell aliquots were pipetted into 96-well plates, 20 µL MTT dye (5 mg/mL)/100 µL of medium was added, and the plate was incubated at 37 °C for 2 h. Aliquots of 100 µL of 10% sodium dodecyl sulphate (SDS) were then added into each well. After overnight incubation at 37 °C, the signal was detected at 550–592 nm using a microplate reader.
Apoptosis induction: enzyme-linked immunosorbent assay (ELISA)
A Roche Cell Death Detection ELISA kit (Basel, Switzerland) was used to detect cleaved nucleosomes in the cytoplasm of cells. Their presence suggests the induction of apoptosis which can be studied using this semi-quantitative assay. Briefly, control and treated cells from 96-well plates were centrifuged at 200 g for 10 min and lysed for 30 min using the buffer provided with the kit. The cell lysate was then centrifuged at 200 g for 10 min. Aliquots of 20 µL of the supernatant (representing the cytosolic fraction) were transferred to streptavidin-coated wells. Incubation with anti-histone-biotin and anti-DNA-peroxidase antibody for 2 h at room temperature was followed by incubation with the 2,2-azino-bis(3-ethylbenzthiazoline-6-sulphonic acid) (ABTS) substrate for 10 min. Light absorbance at 405 nm was then determined using a colorimetric plate reader (Labtech, Uckfield, Sussex, UK). The enhancement ratio for apoptosis in treated cells was calculated by dividing their absorbance signal by that of control cells. The background signal was deducted from all values before calculation.
Apoptosis assessment: annexin V/propidium iodide staining
Combined annexin V and propidium iodide (PI) staining was used to determine the percentage of cells undergoing apoptosis. Phosphatidylserine exposure in the outer surface of the plasma membrane represents a hallmark of apoptosis initiation. Annexin V detects apoptotic cells by binding to phosphatidylserine. PI is a cell-impermeable DNA-intercalating dye that will stain cells only if plasma membrane has been compromised, as is the case in late apoptotic or necrotic cells. It is used to increase confidence that annexin V stains phosphatidylserine located in the outer surface of the plasma membrane only. Treated cells were detached from flasks using Accutase, washed with ice cold PBS and resuspended in annexin V binding buffer at a concentration of 106 cells/mL. Aliquots of 100 µL of the solution were then transferred to 5 mL FACS tubes and annexin V and PI were added for 15 min at room temperature in the dark. Finally, aliquots of 400 µL of binding buffer were added to each tube and cells were analysed within 1 h using flow cytometry. An LSRII analyser was used to detect cell fluorescent signals (BD, Franklin Lakes, NJ).
Autophagy induction and necroptosis regulation: immunoblotting
Immunoblotting was used to determine levels of the proteins LC3A/BII in order to explore the induction of autophagy, and of RIPK3 for investigation of necroptosis. Following treatment, cell aliquots were pipetted into 75 cm2 flasks then washed, scraped and centrifuged for 3 min at 1000 g. Whole cell lysates were prepared by adding SDS sample buffer (0.5 M Tris, pH 6.8, 50% glycerol, 10% SDS, 10 mM dithiothreitol, bromophenol blue) to the cell pellet. The resulting cell lysate was sonicated for 10-15 s and left on ice for 20 min. Samples were then centrifuged at 6000 g for 20 min at 4 °C and heated at 95 °C for 5 min. Soluble proteins were separated on a 12% SDS-polyacrylamide electrophoresis gel, transferred to polyvinylidene fluoride membranes and blocked using Tris-buffered saline (TBS), TBS/0.1% Tween-20 and 5% skimmed milk for 1 h at room temperature. The blots were incubated overnight at 4 °C with the primary antibody of interest (1:1000 dilution). After washing in TBS/0.1% Tween-20, the blots were incubated with peroxidase-conjugated secondary antibody at room temperature for 1 h and washed thrice. Blots were then subjected to enhanced chemiluminescence for signal detection, visualised using an X-ray developer. Semi-quantitative analysis was performed using ImageJ software to provide densitometry data for each blot.
Autophagy assessment: cationic amphiphilic tracer staining
The percentage of cells undergoing autophagy was estimated using a cationic amphiphilic tracer (CAT) kit (Abcam, Cambridge, UK) to stain autophagosomes selectively. Cells were detached from flasks using Accutase diluted to a density of 106 cells per mL, and pelleted at 1000 rpm for 5 min. Cells were resuspended in assay buffer and collected by centrifugation. Cells were then resuspended in 250 μL of indicator-free cell culture medium containing 5% FBS. Aliquots of 250 μL of the diluted green stain solution were added to each sample. The mixture was incubated for 30 min at 37 °C in the dark. After treatment, cells were collected by centrifugation and washed with assay buffer. The cell pellet was resuspended in 500 μL of fresh assay buffer and subjected to FACS analysis using a BD LSRII analyser. Based on FACS histograms of controls, a threshold of 5% was defined as a basal level below which it was assumed that cells were autophagy negative. These cells show decreased fluorescence intensity in FACS graphs. The effect of thermal treatment on the percentage of cells with increased fluorescent signal and hence increased autophagy levels was estimated, taking into account this basal level.
Statistical analysis of results
Thermometry and cell viability results are presented as means ± standard deviation (SD) for at least four replicates per experiment. All experiments were performed at least three times. All other results are presented as means ± standard error of the mean (SEM) of at least three independent experiments. Statistical significance was assessed using a t-test, assuming a one-tail distribution two-sample unequal variance, unless otherwise stated; p < 0.05 was considered to be significant.
Results
Thermometry
The time/temperature combinations used in the study were each recorded 25 times in each of five different positions in the PCR tubes to evaluate the accuracy of the thermal dose delivery of the thermal cycler (). The temperature recorded using thermocouple probes embedded in test tubes was within 0.1 °C of the target temperature. The error in thermal dose delivery achieved was within 11% of the target dose. A TD of 63 ± 3 min was achieved when the temperature was set at 45 °C for 15 min, and the TDs were 127 ± 7 and 248 ± 12 min when the temperatures were set at 46 °C and 47 °C for 15 min, respectively.
Cell viability
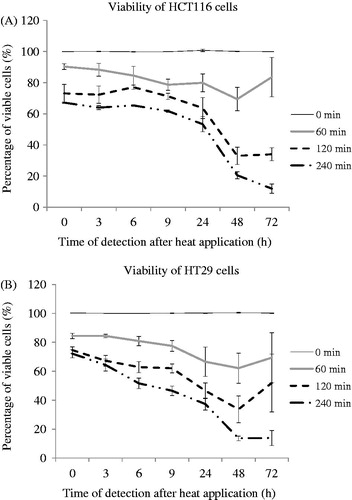
HCT116 and HT29 cells were treated with a TD of 0, 60, 120 or 240 min (37°, 45°, 46°, 47 °C respectively for 15 min; ) and cell viability was assessed at intervals up to 3 days after treatment. Viability of both cell lines decreased immediately after treatment with TD of 60, 120 and 240 min relative to control cells. Decreased viability relative to control cells was also seen 3, 6, 9, 24 and 48 h after treatment in cells treated with TDs of 60, 120 and 240 min. HCT116 cells treated with TD of 60 min and HT29 cancer cells treated with TD of 60 and 120 min exhibited a non-statistically significant increase in proliferation 72 h after treatment compared to that seen 48 h after treatment. HCT116 cells treated with TD of 120 min and HT29 cancer cells treated with a TD of 240 min appeared to reach a plateau by day 3. The viability of HCT116 cells treated with TD of 240 min was decreased on day 3. There was reduced cell viability by 47% (HCT116) and 63% (HT29), respectively, following treatment with TD 240 min, 24 h after treatment ().
Figure 2. Cell viability as a function of time after exposure for two colon cancer cell lines subjected to TDs of 0, 60, 120 and 240 min, assessed using an MTT assay. Results are presented as means + SD of three independent experiments (each of which provided four datasets).
Apoptosis induction
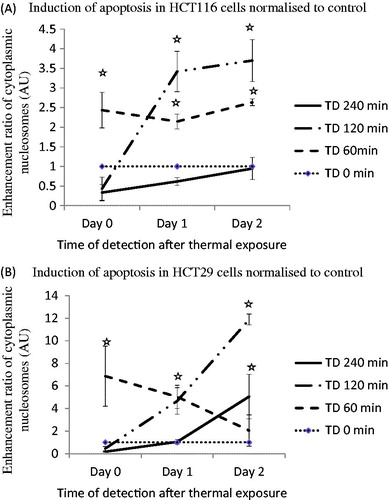
Apoptosis induction was initially determined using an ELISA assay to detect enhancement of cleaved cytoplasmic nucleosomes. TD of 120 min resulted in induction of apoptosis in both cell lines, and in HCT116 cells gave a cytoplasmic nucleosome enrichment factor of 0.43, 3.4 and 3.7 at 0, 1 and 2 days after treatment, respectively. Treatment of HCT116 cells with a TD of 60 min resulted in apoptosis enhancement factors of 2.43, 2.1 and 2.6, respectively on day 0, day 1 and day 2 (). Treatment of HT29 cells with a TD of 60 min resulted in apoptosis enhancement factors of 6.8, 5.0 and 2.1, respectively on days 0, 1 and 2. A TD of 120 min resulted in apoptosis enhancement factors of 4.7 and 11.9 at day 1 and day 2 after treatment, respectively in these cells ().
Figure 3. Induction of apoptosis in HCT116 and HT29 cells exposed to TDs of 0, 60, 120 and 240 min on days 0, 1 and 2, assessed using an ELISA assay. Statistically significant increases in cleaved cytoplasmic nucleosomes relative to controls (TD = 0) were seen in HCT116 cells treated with TDs of 60 min (day 0, day 1, day 2, Panel A) and 120 min (day 1, day 2, Panel A), and in HT29 cells treated with a TD of 60 min (day 0, day 1, Panel B), 120 min (day 1, day 2, Panel B) and 240 min (day 2, Panel B). Results are presented as mean + SEM of at least three experiments each of which provided two datasets. Statistical analysis was performed using a one-tail paired t-test; p < 0.05 was considered to be significant and is denoted by an asterisk.
To further characterise the apoptotic process, annexin V/PI staining was used to determine the percentage of cells undergoing apoptosis. Treatment of HCT116 and HT29 cells with TD of 120 min resulted in 21% of cells ( and ) and 9% of cells ( and ) respectively undergoing apoptosis on day 1. Treatment with TD of 120 min resulted in 12.5% of HCT116 cells and 10.2% of HT29 cells undergoing apoptosis on day 2 ( and ). Treatment of the same cells with TD of 240 min resulted in 9% of cells ( and ) and 13% of cells ( and ) respectively undergoing apoptosis on day 1. A lower percentage of cells undergoing apoptosis was seen when HCT116 and HT29 cells were treated with TDs of 60 min (, and ). When data from three experiments were pooled an increased percentage of apoptotic HCT116 and HT29 cancer cells of 24.6% and 14.2% respectively was evident on day 1 after treatment for the cells exposed to a TD of 120 min ( and ).
Figure 4. Percentage of cells undergoing apoptosis. HCT116 and HT29 cells were treated with TDs of 0, 60, 120 and 240 min. The percentage of cells undergoing apoptosis estimated on day 1 using FACS analysis and annexin V/PI staining are shown for HCT116 cells (Panel A) and HT29 cells (Panel B). Panels C and D show averaged data from all experiments for HCT116 and HT29 cells treated with TD of 0, 60, 120 and 240 min on day 0, day 1 and day 2. Statistically significant increases in the number of treated cells undergoing apoptosis relative to that in control cells (TD = 0) were seen in HCT116 cells treated with TDs of 60 min (day 0, day 2, Panel C) and 120 min (day 1, day 2, Panel C), and in HT29 cells treated with TD of 60 min (day 0, Panel D), 120 min (day 1, day 2, Panel D) and 240 min (day 0, day 2, Panel D). Results are presented as representative FSC/SSC and PI vs. annexin V FACS graphs (Panels A and B) and as means + SEM of three independent experiments (Panels C and D). Percentages provided in Panel A and Panel B represent the percentage of cells located in the annexin V positive/PI negative quadrangle and represent percentage of early apoptotic cells. The associated circles are graphics to aid clarity and have no functional significance. p < 0.05 was considered to be statistically significant and is denoted by an asterisk.
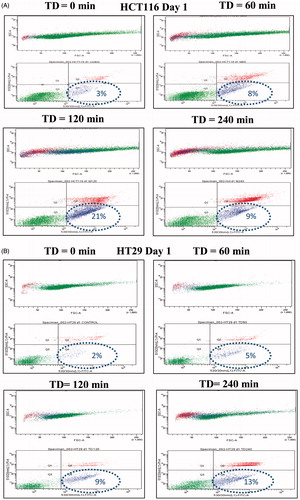
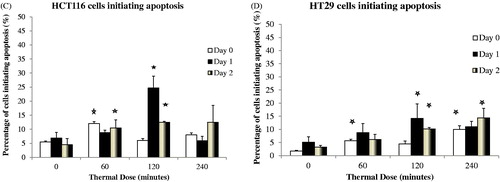
Table 2. Percentage of viable, necrotic and apoptotic cells (single experiment).
Autophagy induction
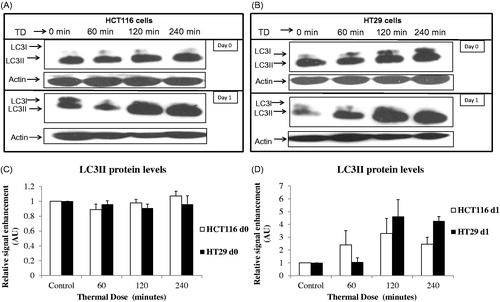
Induction of autophagy was explored by investigating the levels of LC3II using immunoblotting. Treatment of HCT116 cells with TD of 60 min, 120 min and 240 min and HT29 cells with TD of 120 min and 240 min resulted in increased LC3II 1 day after treatment, suggesting induction of autophagy. No change in protein levels of LC3II was evident immediately after treatment in either cell line ().
Figure 5. TD induced autophagy. HCT116 and HT29 cells exposed to TDs of 0, 60, 120 and 240 min. Autophagy was assessed on day 0 and day 1 after treatment using an antibody against LC3II levels. Results are presented as single set of representative blots (Panels A and B) and mean + SEM (Panels C and D) of densitometry data normalised for actin of three independent experiments.
To further characterise the autophagic process, the percentage of cells presenting increased numbers of autophagosomes was determined using FACS analysis with CAT staining. Treatment of HCT116 cells with TD of 60 min and 120 min resulted in 19% and 27% of cells, respectively, with increased autophagy levels 1 day after treatment ( and ). Treatment of HT29 cells with TD of 60 and 120 min resulted in 44% of cells and 64% of cells, respectively, with increased autophagy levels 1 day after treatment ( and B). In addition, treatment of HCT116 cells with TD of 240 min resulted in increased autophagy at both 1 and 2 days after treatment ( and ). Forward/side scatter (FSC/SSC) FACS plots suggested that the autophagy positive signal was associated mainly with live cell populations ( and ). When data from more than three experiments were pooled, an increase in the percentage of both HCT116 cells and HT29 cells undergoing autophagy was evident after treatment with TD of 60 and 120 min ( and ).
Figure 6. Percentage of cells undergoing autophagy. HCT116 and HT29 cells exposed to TD of 0, 60, 120 and 240 min. The percentage of cells undergoing autophagy was estimated on days 0, 1 and 2 using FACS analysis and CAT staining for HCT116 cells (Panels A and C) and HT29 cells (Panels B and D). Statistically significant induction of autophagy relative to controls was seen in HCT116 cells treated with TDs of 60, 120 and 240 min (day 1 and day 2, Panel C) and in HT29 cells treated with TD of 60 and 120 min (day 1 and day 2, Panel D). Results are presented as representative FSC/SSC dot plot FACS graphs and cell count vs. fluorescent intensity histograms from a single experiment (Panels A and B) and as mean + SEM (Panels C and D) of three independent experiments. p < 0.05 was considered to be statistical significant and is denoted by an asterisk.
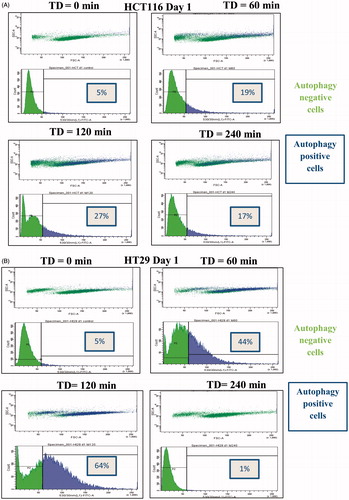
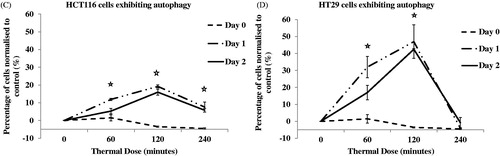
Table 3. Percentage of cells showing increased autophagy (single experiment).
Necroptosis
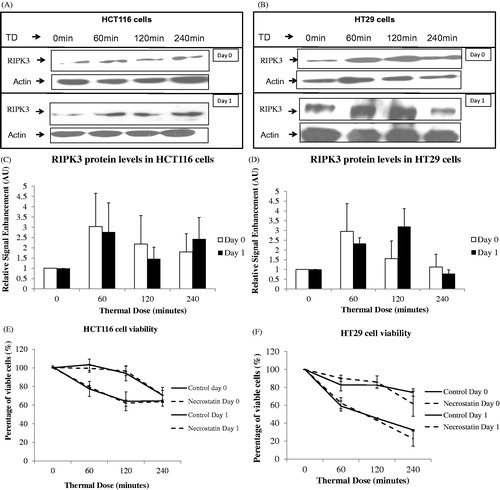
Necroptosis was investigated by determining RIPK3 protein levels using immunoblotting. HCT116 and HT29 cells treated with TD of 60 and 120 min show a moderate increase in RIPK3 expression 1 day after treatment (, , and ). We then investigated whether a necroptosis inhibitor such as necrostatin would affect viability of these cells. The concentration of necrostatin used was based on previously reported half maximal effective concentration (EC50) values for the compound [Citation23]. Exposure of HCT116 and HT29 cells to TDs of 60, 120 and 240 min with, or without, 500 nM necrostatin resulted in a reduction in viability of both cell lines relative to control cells. However, no statistically significant difference between percentage viability of control and necrostatin-treated cells was evident ( and ).
Figure 7. Effect of necrostatin on the viability of cells after exposure to heat. The RIPK3 protein levels of HCT116 (Panels A and C) and HT29 (Panels B and D) colon cancer cells exposed to TDs of 0, 60, 120 and 240 min was assessed using immunoblotting immediately, and 1 day, after treatment. Immunoblotting results are presented as a blot representative of three independent experiments. They are semi-quantified using densitometry normalised for actin showing mean + SEM (n = 3). HCT116 and HT29 cells exposed with or without necrostatin and TDs of 0, 60, 120 and 240 min are shown with cell viability assessed using the MTT assay (Panels E and F). MTT viability data are presented as mean ± SEM of three independent experiments (each of which provided 4 datasets).
Discussion
In this study we have investigated the cytotoxic effects and programmed cell death processes resulting from a range of TD (0 to 240 min) in two human colon cancer cell lines. We have shown that increases in TD achieved using temperatures in the range 45–47 °C applied to cells result in
a reduction of cell viability that depends on the TD used and the time elapsed after treatment,
induction of apoptosis,
induction of autophagy that correlates with the response of live cells to treatment,
an increase in RIPK3 protein levels suggesting that necroptosis may be associated with the TD-induced cellular response.
Based on our findings a map has been created showing the percentage of cells undergoing distinct programmed cell death processes in the same cell population.
HCT116 and HT29 cells are colon cancer adenocarcinoma cells. Both show epithelial morphology with doubling times of approximately 24 h. HCT116 cells have ras mutation in codon 13, express high levels of TGFβ1 and TGFβ2 and are carcinoembryonic (CEA) antigen positive. HT29 cells have braf mutation and express high levels of pro-angiogenic chemokines CXCL1 and CXCL8, as well as deregulated c-myc. Basal autophagy levels are low in both cell lines and this makes them a suitable model for autophagy investigation.
The effects of heat on the viability of cancer cells have previously been reviewed [Citation24]. The cytotoxic effects of hyperthermia have been associated with necrotic cell death [Citation25], induction of apoptosis [Citation26], protein unfolding and subsequent protein aggregation [Citation27], compromised plasma membrane [Citation28,Citation29] and nuclear matrix structure [Citation30], DNA double strand breaks [Citation31], DNA repair mechanism inhibition [Citation32,Citation33] and cell cycle arrest [Citation34]. In the present study we have shown that exposing both colon cancer cell lines to increasing TD decreases cell viability. We have also noted that the time elapsed after treatment can be a significant factor in determining the outcome of the thermal treatment. This suggests that gene-directed forms of cell death such as apoptosis, autophagy and necroptosis may be activated in the response of cells to TD.
Several forms of programmed cell death have been described, including autophagy, apoptosis and necroptosis [Citation35]. Each process has distinct features, and their importance in the response of cancer cells to treatment has been well documented [Citation21,Citation36,Citation37]. We have demonstrated for the first time the simultaneous occurrence of both autophagy and apoptosis on the same cell populations treated with near ablative temperatures, and that necroptosis may also be associated with this response. HCT116 and HT29 cells treated with TDs of 60 and 120 min showed basal levels of autophagy immediately after treatment. However, with time after treatment, levels of autophagy increased, as evidenced by both LC3II formation and an increase in autophagosome formation. Autophagy has been associated both with a death mechanism for tumours and with a cancer pro-survival mechanism [Citation38,Citation39]. In our study, autophagy was shown to be present mostly in live cells as evident in FSC/SSC FACS analysis dot plot graphs. When cells were treated with a TD of 240 min, low levels of autophagy were evident immediately and 1 day after treatment. However, increases in autophagy in cells exposed to TD of 240 min were evident two days after treatment. This further suggests that autophagy may be linked to survival strategies of heat-refractory cells.
Crosstalk between autophagy and other forms of programmed cell death such as apoptosis may occur [Citation21,Citation40,Citation41]. We therefore investigated whether induction of apoptosis might be associated with the response of colon cancer cells to heat. We have demonstrated differential pro-apoptotic effects of heat on colon cancer cells. Exposure of HCT116 and HT29 cells to TD of 120 min results in approximately 20% of cells undergoing apoptosis 1 day after treatment (). Exposure of cells to TD of 60 and 240 min resulted in approximately 10%, of cells undergoing apoptosis. It is interesting to note the high levels of apoptosis immediately after exposure of cells to TD of 60 min. This suggests a quick pro-apoptotic response in those cells. It is possible that stimulation of cancer cells with TD of 60 min accelerates the pro-apoptotic response of some already damaged cells. However, this is a hypothesis that awaits experimental verification.
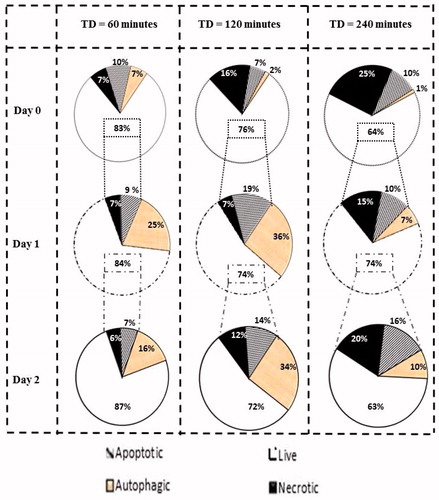
Figure 8. Percentage of cells undergoing each type of programmed cell death. Graphs show percentages of live cell populations and those undergoing necrosis, apoptosis and autophagy at different time points (0 to 2 days) in response to TDs of 60, 120 and 240 min. Cell populations undergoing autophagy may overlap with survival or dying cells.
Initiation of apoptosis as determined by phosphatidylserine exposure (an early apoptotic effect) only partially correlated with the presence of cleaved cytoplasmic nucleosomes (an end apoptotic effect) when HCT116 and HT29 cancer cells were treated with TD of 240 min. This was a repeat phenomenon in our experiments. To interpret it, apoptosis must be viewed as a cell process that requires intact biological signalling complexes for completion. For cleaved cytoplasmic nucleosomes to be observed, several pro-apoptotic signalling mechanisms first have to take place. For example, in the case of mitochondria-dependent apoptosis these include phosphatidylserine translocation from the inside to the outer side of the plasma membrane, re-balance of the protein levels of Bcl-2 family members and translocation to relevant cell compartments, inhibition of anti-apoptotic factors, cytochrome c release from mitochondria and apoptosome formation, initiator caspase activation such as caspase 9 activation, effector caspase activation such as caspase 3 activation, augmentation of the pro-apoptotic signal by feedback signalling loops. A TD of 240 min represents a near ablative TD that results in the cells undergoing a state of biological shock with denaturation of proteins, growth arrest, breakdown of major signalling processes, and finally necrotic cell death taking place. Hence we can envisage a situation where apoptosis is initiated as detected by staining positive for the translocation of phosphatidylserine from the inside to the outer side of the plasma membrane, but can only be fully completed when the biological cascades mentioned above have been restored.
These results suggest that apoptosis may play a role in the response of cells to heat, but may not be the primary effect of thermal treatment on cells when necrosis predominates.
Data suggesting induction of apoptosis, autophagy and necrosis due to heat were aggregated for both cell lines, thus allowing the creation of a map showing the percentage of cells undergoing different forms of cell death (). It can be seen that for a TD of 240 min, 64% of cells are alive on day 0. Of these survivors, only 74% are alive on day 1, and on day 2, 63% of the day 1 survivors remained (30% of the initial population). These results confirm the activation of differential cell death mechanisms in response to heat treatment. They should not be regarded as absolute numbers; rather they are suggestive of the existence of cell fractions undergoing different forms of death within the same thermally exposed cell population. Cells exposed to a TD of 240 min exhibit a high percentage of necrotic cell death while gene-directed processes such as apoptosis and autophagy that may promote cell death or cell survival are activated in a minority of the cell population, suggesting enhanced thermal tolerance for that population. Treatment of cells with TD of 120 min results in activation of signalling mechanisms to promote cell death such as apoptosis or induction of processes that may be associated with both cell death and cell survival such as autophagy. When cells are treated with mild hyperthermia, i.e. TD of 60 min, cell death is less pronounced. Eventually, cells will recover from thermal exposure and exhibit their proliferative nature.
To determine aspects of necrotic cell death we investigated the effects of heat on a gene-associated form of necrosis that has been labelled necroptosis, and is mediated by activation of RIPK3 and RIPK1. Regulation of protein levels of RIPK3 were investigated, as was the effect of a RIPK1 inhibitor on cell viability after exposure to heat. We observed an increase in the expression of RIPK3 in treated cells, relative to controls, 1 day after treatment although the magnitude was variable for different experiments. The application of the necroptosis inhibitor, necrostatin [Citation23], did not affect viability of TD-exposed cells significantly, suggesting that necroptosis is activated in a minor subpopulation of necrotic cells. However, further research is necessary to investigate the role of necroptosis in heat-induced cell death fully, and to determine whether its manipulation may have therapeutic benefit or whether other programmed cell death pathways are activated instead.
Overall, our results contribute to the understanding of the biological effects of heat on cancer cells, and suggest that different programmed cell death processes such as apoptosis, autophagy and necroptosis may be associated with this response. Further research is necessary to understand the interplay between these processes, and whether their genetic and pharmacological manipulation may influence the efficacy of thermal anti-cancer treatments. Additionally, it is important to investigate whether the mechanisms for cell death are the same when these thermal doses are achieved using temperatures above 50 °C for very short exposure times, since the original thermal dose formulation was not designed to include these exposures. This is the subject of an ongoing study.
Acknowledgements
The authors would like to acknowledge Yuen-Li Chung and Martin Leach from the Institute of Cancer Research, London, UK for providing colon cancer cell lines, and Adam Shaw and Elly Martin from the National Physical Laboratory (London, UK) for their contribution to estimating thermocouple offset.
Declaration of interest
This study was funded by the European Association of National Metrology Institutes (EURAMET) and the EU (Grant No.: HLT03-REG2; HLT03 DUTy). The authors alone are responsible for the content and writing of the paper.
References
- Cancer Research UK. Cancer stats: Cancer statistics for the UK. Available from http://www.cancerresearchuk.org/cancer-info/cancerstats/ (accessed14 August 2014)
- World Health Organization. Cancer. Fact sheet 297. Available from http://www.who.int/mediacentre/factsheets/fs297/en/ (accessed 14 August 2014)
- Serrone J, Kocaeli H, Douglas Mast T, Burgess MT, Zuccarello M. The potential applications of high-intensity focused ultrasound (HIFU) in vascular neurosurgery. J Clin Neurosci 2012;19:214–21
- Aptel F, Lafon C. Therapeutic applications of ultrasound in ophthalmology. Int J Hyperthermia 2012;28:405–18
- Jenne JW, Preusser T, Günther M. High-intensity focused ultrasound: Principles, therapy guidance, simulations and applications. Z Med Phys 2012;22:311–22
- ter Haar G. Therapeutic applications of ultrasound. Prog Biophys Mol Biol 2007;93:111–29
- Leslie TA, Kennedy JE. High intensity focused ultrasound in the treatment of abdominal and gynaecological diseases. Int J Hyperthermia 2007;23:173–82
- Van der Kooij SM, Ankum WM, Hehenkamp WJ. Review of nonsurgical/minimally invasive treatments for uterine fibroids. Curr Opin Obstet Gynecol 2012;24:368–75
- Illing R, Chapman A. The clinical applications of high intensity focused ultrasound in the prostate. Int J Hyperthermia 2007;23:183–91
- Barqawi AB, Crawford ED. Emerging role of HIFU as a noninvasive ablative method to treat localized prostate cancer. Oncology (Williston Park) 2008;22:123–9
- Li S, Wu PH. Magnetic resonance image-guided versus ultrasound-guided high-intensity focused ultrasound in the treatment of breast cancer. Chin J Cancer 2013;32:441–52
- Mearini L. High intensity focused ultrasound, liver disease and bridging therapy. World J Gastroenterol 2013;19:7494–9
- Lynn JG, Zwemer RL, Chick AJ, Miller AE. A new method for the generation and use of focused ultrasound in experimental biology. J Gen Physiol 1942;26:179–93
- Sapareto S, Dewey W. Thermal dose determination in cancer therapy. Int J Radiat Oncol Biol Phys 1984;10:787–800
- Kerr JF, Wyllie AH, Currie AR. Apoptosis: A basic biological phenomenon with wide-ranging implications in tissue kinetics. Br J Cancer 1972;26:239–57
- Ashford TP, Porter KR. Cytoplasmic components in hepatic cell lysosomes. J Cell Biol 1962;12:198–202
- Lamb CA, Yoshimori T, Tooze SA. The autophagosome: Origins unknown, biogenesis complex. Nat Rev Mol Cell Biol 2013;14:759–74
- Vanden Berghe T, Linkermann A, Jouan-Lanhouet S, Walczak H, Vandenabeele P. Regulated necrosis: The expanding network of non-apoptotic cell death pathways. Nat Rev Mol Cell Biol 2014;15:135–47
- Chu KF, Dupuy DE. Thermal ablation of tumours: Biological mechanisms and advances in therapy. Nature Rev Cancer 2014;14:199–208
- Taylor RC, Cullen SP, Martin SJ. Apoptosis: Controlled demolition at the cellular level. Nat Rev Mol Cell Biol 2008;9:231–41
- Marino G, Niso-Santano M, Baehrecke EH, Kroemer G. Self-consumption: The interplay of autophagy and apoptosis. Nat Rev Mol Cell Biol 2014;15:81–94
- Moriwaki K, Chan FK. RIP3: A molecular switch for necrosis and inflammation. Genes Dev 2013;27:1640–9
- Teng X, Degterev A, Jagtap P, Xing X, Choi S, Denu R, et al. Structure-activity relationship study of novel necroptosis inhibitors. Bioorg Med Chem Lett 2005;15:5039–44
- Roti Roti JL. Cellular responses to hyperthermia (40–46 °C): Cell killing and molecular events. Int J Hyperthermia 2008; 24:3–15
- Ito A, Honda H, Kobayashi T. Cancer immunotherapy based on intracellular hyperthermia using magnetite nanoparticles: A novel concept of ‘heat-controlled necrosis’ with heat shock protein expression. Cancer Immunol Immunother 2006;55:320–8
- Nagarsekar A, Tulapurkar ME, Singh IS, Atamas SP, Shah NG, Hasday JD. Hyperthermia promotes and prevents respiratory epithelial apoptosis through distinct mechanisms. Am J Respir Cell Mol Biol 2012;47:824–33
- Roti Roti JL, Kampinga HH, Malyapa RS, Wright WD, Van der Waal RP, Xu M. Nuclear matrix as a target for hyperthermic killing of cancer cells. Cell Stress Chaperones 1998;3:245–55
- Hayat H, Friedberg I. Heat-induced alterations in cell membrane permeability and cell inactivation of transformed mouse fibroblasts. Int J Hyperthermia 1986;2:369–78
- Csoboz B, Balogh GE, Kusz E, Gombos I, Peter M, Crul T, et al. Membrane fluidity matters: Hyperthermia from the aspects of lipids and membranes. Int J Hyperthermia 2013;29:491–9
- Lepock JR. Role of nuclear protein denaturation and aggregation in thermal radiosensitization. Int J Hyperthermia 2004;20:115–30
- Takahashi A, Matsumoto H, Nagayama K, Kitano M, Hirose S, Tanaka H, et al. Evidence for the involvement of double-strand breaks in heat-induced cell killing. Cancer Res 2004;64:8839–45
- Bergs JW, Krawczyk PM, Borovski T, Ten Cate R, Rodermond HM, Stap J, et al. Inhibition of homologous recombination by hyperthermia shunts early double strand break repair to non-homologous end-joining. DNA Repair (Amst) 2013;12:38–45
- Krawczyk PM, Eppink B, Essers J, Stap J, Rodermond H, Odijk H, et al. Mild hyperthermia inhibits homologous recombination, induces BRCA2 degradation, and sensitizes cancer cells to poly (ADP-ribose) polymerase-1 inhibition. Proc Natl Acad Sci USA 2011;108:9851–6
- Park H, Cho JA, Kim SK, Kim JH, Lee SH. Hyperthermia on mesenchymal stem cells (MSCs) can sensitize tumor cells to undergo cell death. Int J Hyperthermia 2008;24:638–48
- Chaabane W, User SD, El-Gazzah M, Jaksik R, Sajjadi E, Rzeszowska-Wolny J, et al. Autophagy, apoptosis, mitoptosis and necrosis: Interdependence between those pathways and effects on cancer. Arch Immunol Ther Exp (Warsz) 2013;61:43–58
- Janku F, McConkey DJ, Hong DS, Kurzrock R. Autophagy as a target for anticancer therapy. Nat Rev Clin Oncol 2011;8:528–39
- Kreuzaler P, Watson CJ. Killing a cancer: What are the alternatives? Nat Rev Cancer 2012;12:411–24
- White E. Deconvoluting the context-dependent role for autophagy in cancer. Nat Rev Cancer 2012;12:401–10
- Hsu SF, Chao CM, Huang WT, Lin MT, Cheng BC. Attenuating heat-induced cellular autophagy, apoptosis and damage in H9c2 cardiomyocytes by pre-inducing Hsp70 with heat shock preconditioning. Int J Hyperthermia 2013;29:239–47
- Zhang Y, Calderwood SK. Autophagy, protein aggregation and hyperthermia: A mini-review. Int J Hyperthermia 2011;27:409–14
- Mouratidis PX, Colston KW, Charolidi N, Pirianov G. Differential role of apoptosis and autophagy associated with anticancer effect of Lupulone (hop β-acid) derivatives on prostate cancer cells. Anti-Cancer Agents Med Chem 2014;14:1169–78