
Abstract
Purpose: Modulated electro-hyperthermia (mEHT), also known as oncothermia, shows remarkable treatment efficacies for various types of tumours, including glioma. The aim of the present study was to investigate the molecular mechanism underlying phenotypic changes in oncothermic cancer cells. Materials and methods: U87-MG and A172 human glioma cells were exposed to mEHT (42 °C/60 min) three times with a 2-day interval and subsequently tested for growth inhibition using MTS, FACS and microscopic analysis. To obtain insights into the molecular changes in response to mEHT, global changes in gene expression were examined using RNA sequencing. For in vivo evaluation of mEHT, we used U87-MG glioma xenografts grown in nude mice. Results: mEHT inhibited glioma cell growth through the strong induction of apoptosis. The transcriptomic analysis of differential gene expression under mEHT showed that the anti-proliferative effects were induced through a subset of molecular alterations, including the up-regulation of E2F1 and CPSF2 and the down-regulation of ADAR and PSAT1. Subsequent Western blotting revealed that mEHT increased the levels of E2F1 and p53 and decreased the level of PARP-1, accelerating apoptotic signalling in glioma cells. mEHT significantly suppressed the growth of human glioma xenografts in nude mice. We also observed that mEHT dramatically reduced the portion of CD133+ glioma stem cell population and suppressed cancer cell migration and sphere formation. Conclusions: These findings suggest that mEHT suppresses glioma cell proliferation and mobility through the induction of E2F1-mediated apoptosis and might be an effective treatment for eradicating brain tumours.
Introduction
Gliomas are the most common and deadly brain tumours, accounting for ∼80% of the primary malignancies of the brain [Citation1,Citation2]. Despite recently advanced multimodal therapies, such as surgery, chemotherapy and radiotherapy, the overall 5-year survival rate for malignant glioma remains less than 10% [Citation3]. Thus, new approaches to improve the treatment efficacy are needed.
Hyperthermia cancer therapy is currently used either for ablation purposes as an alternative to surgery or in combination with chemotherapy and/or radiation therapy to enhance the effects of those traditional therapies [Citation4]. Modulated electro-hyperthermia (mEHT) is a complementary treatment method effective against various types of tumours, including gliomas [Citation5,Citation6]. The principle of mEHT is based on classical hyperthermia, but the difference is that mEHT is physically designed to promote the direct absorption of the modulated radiofrequency current in the extracellular fluid. In mEHT, the extracellular liquid is heated, creating a slight temperature difference (1/1000 °C) between the inner and outer temperature of the cell. As a result, the heat flows into the cell through the membrane until the temperature difference is extinct, thereby destroying the membrane of the cancer cells [Citation7–9]. When combined with alkylating chemotherapy or the molecular targeting agent sorafenib, mEHT exhibits synergistic anti-cancer effects in clinical trials with glioma or hepatocellular carcinoma patients [Citation10,Citation11]. A recent study also showed that mEHT induces an abscopal effect, thereby enhancing the anti-tumour effects of immune therapy [Citation12].
Although the anti-tumour efficacy of mEHT has been extensively studied in both laboratory and clinical settings, the underlying molecular mechanisms of this treatment are not yet clearly understood. In the present study we aimed to elucidate the molecular mechanisms mediating the phenotypic changes in oncothermic tumour cells using a laboratory mEHT device for in vitro experiments and a glioma xenograft model. We also performed RNA sequencing and subsequent protein analysis to understand the mechanism on a whole genome scale. mEHT inhibited glioma cell growth and induced apoptosis. The growth inhibitory effects were induced through a subset of molecular alterations including the up-regulation of E2F1 and p53, which play a pivotal role in exerting apoptotic progression. In addition, mEHT effectively suppressed human glioma growth in a murine xenograft model. We also observed that mEHT dramatically reduced the size of the CD133+ glioma stem cell population and suppressed tumour cell migration and sphere formation. These results demonstrated that mEHT might be a treatment option for reducing tumour relapse via the elimination of cancer stem cells (CSCs) in the brain tumour microenvironment.
Materials and methods
Cell culture
Human brain cancer cell lines, U87-MG and A172, were purchased from the Korean Cell Line Bank (KCLB, Seoul, South Korea). U87-MG and A172 cells were cultured in MEM and RPMI-1640 medium, respectively, supplemented with 10% fetal bovine serum (HyClone, South Logan, UT, USA) and 1% of penicillin/streptomycin solution (HyClone), at 37 °C with 5% CO2. The phenotypes of these cell lines have been authenticated by the KCLB.
Modulated electro-hyperthermia (mEHT)
The LAB-EHY100 device (OncoTherm, Páty, Hungary) was used in in vitro and in vivo mEHT treatment. To mimic clinical conditions, mEHT (3 W power, 42 °C for 60 min) was administered to glioma cells three times at 2-day intervals. During the 60 min of mEHT, the radiofrequency (RF) power level was controlled using the fluorotopic temperature measurement system (Luxton m3300; Lumasense, Santa Clara, CA) to maintain the heating temperature at 42 °C. For in vivo experiments, 4-week old male BALB/c nude mice were purchased from Orientbio (Seongnam, South Korea). To elucidate the efficacy of mEHT against in vivo tumours, 1 × 10⁷ U87-MG cells were injected into the right flanks of nude mice and the xenografts were treated with mEHT using the same instrumental conditions on 9, 11, 13, 15, 17, 19 and 21 days after tumour cell injection. The tumour size was measured using a vernier caliper and calculated as the minor axis2 × the major axis × 1/2.
Measurement of cell proliferation and apoptotic cell death
Cell growth was measured using the CellTiter 96 Aqueous One Solution Cell Proliferation Assay (Promega, Madison, WI) according to the manufacturer’s instructions. The cells were treated as described above and incubated for 2 h at 37 °C in a humidified, 5% CO2 atmosphere. The coloured formazan products were determined by measuring the absorbance at 490 nm using a VersaMax microplate reader (Molecular Devices, Sunnyvale, CA). Annexin V and PI dual staining was used to detect apoptotic cells, but the cells were not fixed with 70% ethanol. Apoptotic cells were stained using the FITC Annexin V Apoptosis Detection Kit I (BD Pharmingen, San Jose, CA) according to the manufacturer’s instructions. The cell death was measured through FACSVerse flow cytometry (BD Bioscience, Franklin Lakes, NJ) and quantified using FlowJo software. The induction of apoptosis was also measured using the ApoStrand ELISA Apoptosis Detection Kit (Biomol International, Plymouth Meeting, PA). This method detects denatured single-stranded DNA in apoptotic cells, but not in necrotic cells or cells with DNA breaks.
Clonogenic assay
The effect of mEHT on the clonogenic survival of tumours was studied. The cells treated with mEHT were seeded onto 24-well culture plates at 1 × 10³ cells per well. The cells were maintained in culture for 12 days without medium change to let the viable cells propagate to sizeable colonies for quantification. The colonies were fixed with methanol-acetic acid 3:1 ratio and subsequently stained with 0.5% crystal violet for 60 min at room temperature. The numbers of colonies containing more than 50 cells were counted.
Western blot analysis
Total cell lysates were prepared by lysing the cells in RIPA buffer (Thermo Scientific, Rockford, IL), which contains 0.01% of a protease and phosphatase inhibitor cocktail (Thermo Scientific). Equal amounts (50 µg) of total proteins were fractionated through SDS-PAGE on a 10% gel and transferred to PVDF membranes (Roche, Basel, Switzerland). The membrane was blocked with 5% milk/Tris-buffered saline plus Tween 20 (TBST) and incubated with primary antibodies against human E2F1 (sc-251), p53 (sc-6243) and PARP-1 (sc-8007) (all from Santa Cruz Biotechnology, Santa Cruz, CA). HRP goat anti-mouse IgG (Santa Cruz) and HRP goat anti-rabbit IgG (Cell signaling, Danvers, MA) were used for secondary antibody. Immunoreactive bands were visualised using a LAS-3000 Imager (Fujifilm, Tokyo, Japan). Equal loading was assessed after probing the same membrane with β-actin antibody (Santa Cruz).
RNA sequencing
Total RNA was extracted using the RNeasy mini kit (Qiagen, Valencia, CA). The quantity and quality of the total RNA were evaluated using RNA electropherograms (Bio-Rad Experion, Hercules, CA) and the RNA quality was assessed based on the RNA quality indicator (RQI). The total RNA from each sample with an RQI value of 8.0 or higher was used. The resulting mRNA samples were processed for the sequencing libraries using the Illumina TruSeq stranded mRNA sample preparation kit (Illumina, San Diego, CA) according to the manufacturer’s protocols. RNA sequencing was performed using the Illumina HiSeq 2500 to generate non-directional, paired-end 100-base-pair reads. Quality-filtered reads were mapped to the human reference genome sequences, hg19 (UCSC Genome Bioinformatics, https://genome.ucsc.edu) using tophat2 (http://ccb.jhu.edu/software/tophat). The relative transcript abundance was estimated by counting the fragments per kilobase of exon model per million mapped sequence reads (FPKM) and differential expressed genes were evaluated using Cufflinks package (http://cole-trapnell-lab.github.io/cufflinks/). The significantly overlapping pathways and gene ontology categories with differential expressed genes were analysed using the DAVID bioinformatics database (http://david.abcc.ncifcrf.gov).
Detection of CD133+ glioma stem cells
The cells were harvested through enzymatic dissociation and resuspended in PBS supplemented with 2% FBS. To analyse the cell surface markers, 1 × 10⁶ cells were labelled with an allophycocyanin (APC)-conjugated anti-CD133 antibody (clone 293C3, Miltenyi Biotech, Bergisch Gladbach, Germany) for 30 min at 4 °C. APC-conjugated mouse IgG2b isotype control antibody was used to exclude non-specific binding. The cells were washed three times with PBS and subsequently analysed through FACSVerse flow cytometry (BD Bioscience).
Cell migration assay
A scratch wound-healing assay was performed to assess cell migration. The cells were seeded at 5 × 10⁵ in 6-well plates and incubated for 24 h until reaching the appropriate confluence on the day of experiment. An artificial scratch wound was made using a sterile 200-μL pipette tip on the cell monolayer. After the scraping, the floating cells were washed with PBS and fresh medium was added. Differences in the wound width were microscopically visualised at × 40 magnification at three time points (0, 9 and 18 h).
Sphere forming assay
After the third mEHT, the single-cell suspension was diluted to a concentration of 2 × 10⁴ cells/mL in serum-free DMEM/F12 medium (Invitrogen, Carlsbad, CA) supplemented with 20 ng/mL recombinant epidermal growth factor (EGF) (Invitrogen), 20 ng/mL basic fibroblast growth factor (bFGF) (Invitrogen), and 1X B27 supplement (Invitrogen) and subsequently plated onto 24-well ultra-low attachment plates (Corning, NY). After 5 days of culture, sphere formation was microscopically evaluated using NIS element BR software Version 4.2 to count the number of spheres greater than or equal to 40 μm in diameter, and to measure the size of each sphere.
Statistical analysis
Statistical comparisons were conducted using Student’s t-test with equal variance, bootstrap t-test with 10 000 random repetitions, or Poisson generalised linear model. All data are shown as the means ± SEM. Analyses were conducted using R statistical software (v. 3.0.1). p Values ≤ 0.05 (*) and ≤0.01 (**) were considered statistically significant.
Results
Electro-hyperthermia inhibits proliferation and induces apoptosis in glioma cells
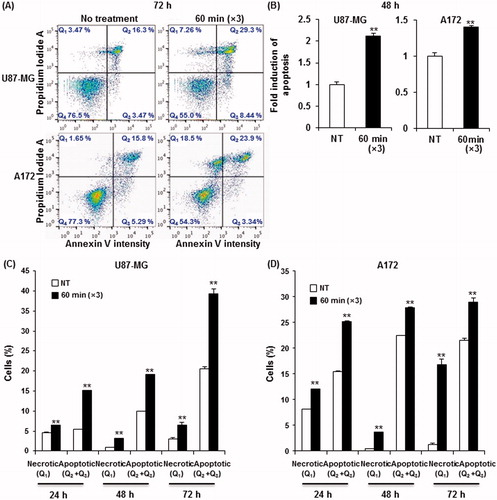
As shown in , the temperature within a treatment cup (a cup containing culture medium and a slide coated with cells) increased to 42 °C within 8 min and remained in a range of 42–43 °C during heating using a LAB-EHY100 device, which controls RF power. To examine the therapeutic efficacy of mEHT, two glioma cell lines, U87-MG and A172, were treated for 1 h with mEHT three times at 2-day intervals, and the cell growth was determined using an MTS assay. The mEHT treatments decreased cell proliferation more than 70% and 45% in U87-MG and A172 cells, respectively ( and ). This treatment condition was applied to all subsequent in vitro studies. Consistent with the results of the short-term phenotypic assay, mEHT was also effective in inhibiting long-term colony formation (). The magnitudes of the reduction in clonogenicity in response to mETH were similar to the growth inhibition, as determined using the MTS assay (). The growth inhibition of mEHT-treated glioma cells might reflect the strong induction of apoptosis as measured through the detection of the apoptotic marker Annexin V using FACS (). Namely, at 72 h after the third mEHT treatment, the percentage of late-apoptotic (Q2 region) plus early-apoptotic cell populations (Q3) in U87-MG and A172 cells increased by about 90% and 30%, respectively. To confirm the apoptotic induction through mEHT, we conducted an ELISA assay to detect the denatured single-stranded DNA formed in apoptotic cells but not in the necrotic cells or cells with DNA breaks. The results showed that mEHT significantly increased the apoptotic cell population in U87-MG and A172 cells approximately 2.2- and 1.4-fold, respectively, at 48 h after the third mETH (). To further observe the onset of apoptosis through mEHT, U87-MG and A172 cells were assayed through FACS analysis at various time points (24, 48 and 72 h) after the third mEHT. As shown in and , mEHT induced both necrosis and apoptosis at all time points examined in glioma cells. However, this treatment mainly increased the number of apoptotic cells at 24 h, the earliest time point examined. These data suggest that mEHT treatments induced apoptosis in human glioma cells.
Figure 1. Real-time monitoring of the constant mEHT temperature of 42 °C using sensor probes. Two probes were used to detect the temperature within a treatment cup connected to a LAB-EHY 100 device, and two more probes were placed outside the treatment cup to detect the temperature of the surroundings.
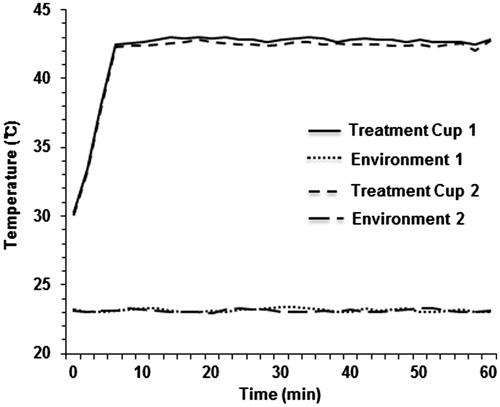
Figure 2. mEHT reduces viability and long-term colony formation in glioma cells. (A) Representative light microscopy images of U87-MG and A172 cells at 72 h after treating three times with mEHT. Scale bar, 100 µm. (B) Measurement of cell viability in U87-MG and A172 cells at 72 h after the third mEHT treatment. The data represent three independent experiments. NT, no treatment. **P < 0.01; *P < 0.05 by bootstrap t-test. (C) Observation of long-term colony formation using a clonogenic assay at 12 days after the third mEHT treatment. The data represent three independent experiments. **P < 0.01 using the Poisson generalised linear model.
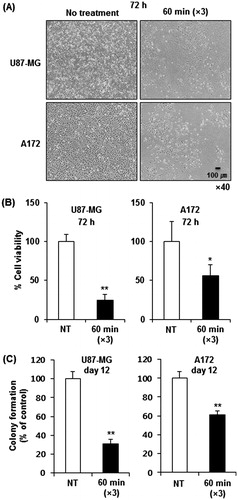
Figure 3. mEHT induces apoptosis in glioma cells. (A) Detection of the apoptotic cell population through FACS analysis with the intensity of apoptotic marker Annexin V at 72 h after the third mEHT treatment. (B) Detection of apoptosis at 48 h after the third mEHT treatment using the ApoStrand ELISA apoptosis detection kit. The data represent three independent experiments. NT, no treatment. **P < 0.01 by bootstrap t-test. (C, D) Detection of the apoptotic cell population through FACS analysis based on the intensity of the apoptotic marker Annexin V in U87-MG (C) and A172 (D) cells at 24, 48 and 72 h after the third mEHT treatment. The data represent duplicate experiments. **P < 0.01 by Student’s t-test with equal variance.
The molecular mechanisms underlying the growth inhibitory effects of electro-hyperthermia
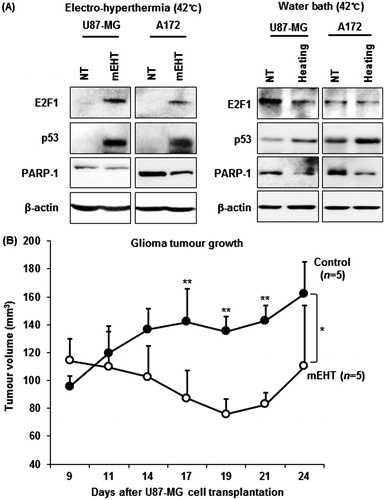
To determine the molecular basis of the observed growth inhibition through mEHT, we compared the global gene expression profiles of mEHT-treated U87-MG and A172 cells to those of sham-treated control cells using next-generation RNA sequencing. The paired-end mRNA sequencing analysis revealed that mEHT led to the up- and down-regulation of 684 genes in U87-MG and 488 genes in A172 cells (). Comparing these two gene sets to identify a common anti-cancer mechanism revealed a statistically significant overlap of 34 genes (19 genes up- and 15 genes down-regulated) defined using a bootstrap t-test with 10 000 repetitions and at least a 2-fold change (p < 0.001) (), and this effect is considered a common mEHT molecular signature in glioma cells. Ingenuity pathway analysis (IPA) showed that the 34 mRNA transcripts were functionally enriched in the top two networks shown in and . Consistent with phenotypic changes, mEHT co-ordinately impacts a restricted number of defined oncogenic pathways acting in concert to decrease cell proliferation and induce apoptosis, providing a rationale for the therapeutic use of mEHT in glioma. Consistently, the expression levels of E2F1 and CPSF2 involved in pro-apoptotic activity and growth suppression were up-regulated, whereas two key regulators of cell growth, PSAT1 and ADAR, were repressed. In particular, the transcription factor adenovirus E2 promoter-binding factor (E2F) 1 gene, which is functionally involved in exerting apoptotic progression [Citation13–15], was up-regulated through after mEHT treatment and this process was positioned at a central region of interactive top network 1 (). Subsequent Western blot analysis confirmed the increase of E2F1 protein with a concomitant increase of p53 tumour suppressor and decrease of PARP-1, a nuclear enzyme essential for genomic stability and chromatin remodelling in both U87-MG and A172 cell lines (). Next, to determine whether E2F1-mediated apoptotic induction was mEHT-specific, we assessed the levels of E2F1, p53 and PARP-1 in glioma cells heated three times for 1 h with a two-day interval in a water bath with 42 °C, compared with mEHT-treated cells. As shown in (right panel), while heat stress up-regulated p53 and down-regulated PARP-1 expression, it did not change the levels of E2F1. This finding identifies E2F1-mediated apoptosis as an essential and common mechanism of growth suppression in mEHT-treated glioma cells.
Figure 4. Transcriptomic analysis of gene expression by RNA sequencing following the mEHT treatment. (A) Venn diagrams representing the number of mRNA transcripts up- or down-regulated in U87-MG or A172 cells after mEHT treatment. (B) A heat map of the 34 commonly deregulated genes in U87-MG and A172 cells after normalisation to the corresponding sham-treated cells (10 000 repetitions in bootstrap ANOVA with contrast tests and a threshold cut-off of twofold change, **P < 0.001, red (induced) and green (repressed), log2-based scale). (C, D) Two putative top networks with high scores (>19) strongly associated with E2F1 (C) and ubiquitin C (UBC) (D) based on Fisher’s exact test (p value <10−19), indicating a high probability of biological interactions. Up- and down-regulated genes are shown in red and green, respectively. The genes shown in grey are associated with the regulated genes.
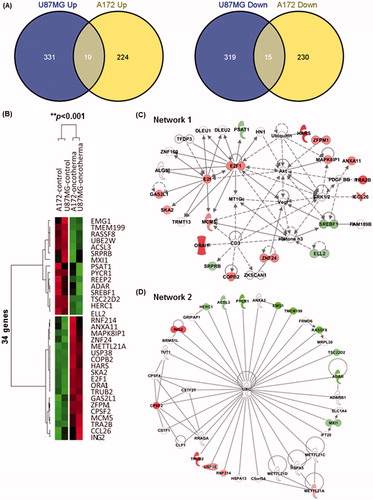
Figure 5. mEHT activates E2F1-mediated apoptotic signalling in glioma cells and inhibits tumour growth in mice. (A) Western blot analysis of E2F1, p53 and PARP-1 functionally involved in apoptotic progression. Whole-cell lysates were prepared at 72 h after the third mEHT treatment or at 72 h after the third water-bath heating. β-actin was included as a loading control. NT, no treatment. (B) Kinetics of tumour growth: mEHT was directly applied to the surface of each tumour after inoculation with 1 × 10⁷ U87-MG cells, and the tumour diameters were measured at the indicated days using digital calipers. The results are shown as the mean tumour volume ± SD. **P < 0.01; *P < 0.05 (n = 5 vs. n = 5) using Student’s t-test with equal variance.
Electro-hyperthermia inhibits glioma growth in vivo
We next investigated whether mEHT could suppress glioma tumorigenicity. To test the therapeutic efficacy of mEHT in vivo, we used a U87-MG xenograft in nude mice. All mice received subcutaneous injection of 1 × 10⁷ U87-MG glioma cells in the right flank and on day 9 when tumours had reached an average volume of ∼100–120 mm3, the mice were randomly assigned to either mEHT treatment or control groups. Electro-hyperthermia was directly applied seven times on the surface of each tumour 9, 11, 13, 15, 17, 19 and 21 days after the glioma cell transplantation, and tumour growth was monitored using a caliper ruler. The results showed that mEHT treatments significantly suppressed the growth of human glioma xenografts () (*P < 0.05).
Electro-hyperthermia inhibits the maintenance of glioma stem cells
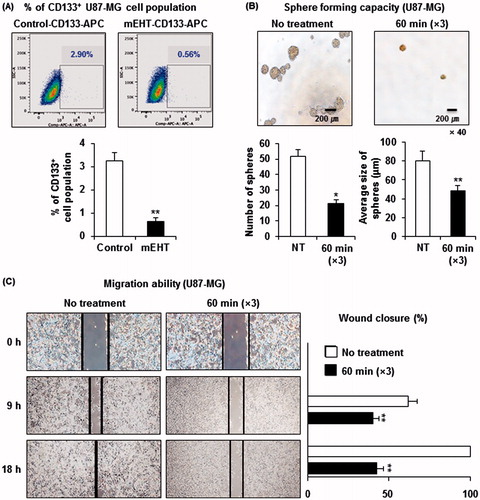
Increasing evidence has indicated that a small fraction of cancer cells are CSCs, responsible for tumour persistence and relapse, metastasis, chemo-resistance and radio-resistance. As shown in , we observed that mEHT down-regulated the adenosine deaminase acting on dsRNA (ADAR, also known as ADAR1) and up-regulated the cleavage and polyadenylation specificity factor subunit 2 (CPSF2), both of which are functionally associated with CSC biology. Recent studies have demonstrated that ADAR1 knockdown impaired the in vivo self-renewal capacity of chronic myeloid leukaemia progenitors [Citation16], and the loss of CPSF2 expression was associated with an increase in thyroid cancer invasion and the CSC population, particularly up-regulating the level of a CSC marker CD133 [Citation17]. It has also been reported that glioma CSCs express CD133 and grow in spheroid patterns in special growth medium [Citation18,Citation19]. Thus, we examined whether mEHT could affect the maintenance of glioma stem cells. To accomplish this, we first measured the change in the percentage of CSC portion after the third mEHT treatment. Next, 20 000 U87-MG cells treated with mEHT in the same way were plated on a 24-well plate and cultured for 5 days to observe the change in sphere-forming capacity by counting the number of spheres greater than or equal to 40 μm in diameter and measuring the size of each sphere. As expected, mEHT eliminated the CD133+ U87-MG cell population by ∼80% () and significantly decreased cancer stemness by reducing both the number (48 spheres formed in no treatment versus 20 in mEHT) and the average size of spheres () when compared with control treatments. In addition, the scratch wound-healing test showed that mEHT suppressed U87-MG cell migration, indicating the decreased stemness of the cells (). These data indicate that mEHT could prevent glioma recurrence through the elimination of CSCs in the brain tumour microenvironment.
Figure 6. mEHT reduces glioma stemness. (A) Detection of the CD133+ U87-MG cell population through FACS analysis. A total of 1 × 10⁶ cells exposed to the indicated treatments were labelled with APC-conjugated anti-CD133 antibody and subsequently analysed through flow cytometry. The data represent duplicate experiments. **P < 0.01 by Student’s t-test with equal variance. (B) Measurement of the sphere formation. After mEHT or sham treatment, the single cell suspension was diluted to a concentration of 2 × 10⁴ cells/mL and plated onto ultra-low attachment 24-well plates. After 5 days of culture, sphere formation was evaluated using a microscope and NIS element BR software to count the number of spheres greater than or equal to 40 μm in diameter and to measure the size of each sphere. The data represent duplicate experiments. NT, no treatment. *P < 0.05 by Student’s t-test with equal variance, **P < 0.01 by bootstrap t-test. (C) Measurement of cancer cell migration ability. Representative images of the migration of sham- or mEHT-treated U87-MG cells in the scratch wound-healing assay. The bar graphs show the means ± SD of the gap width of wounds at the indicated time points from three independent assays. **P < 0.01 using the bootstrap t-test.
Discussion
mEHT concentrates the modulated radiofrequency current to intercellular electrolytes, generating a temperature gradient between the inside and outside of cells [Citation5]. This gradient destroys the tumour cell membrane, leading to apoptosis or necrosis [Citation6,Citation20,Citation21]. Numerous clinical studies have demonstrated that mEHT is effective for controlling advanced primary and metastatic malignancies, such as bone (metastatic), breast cancer and malignant glioma [Citation10,Citation22–24]. However, the molecular mechanism underlying the induction of cancer cell death through mEHT remains unclear. In the present study, mEHT induced extensive apoptosis in both U87-MG and A172 glioma cell lines (). The phenotypic changes induced through mEHT were associated with the coordinated and common dysregulation of 34 genes (), as assessed through a global transcriptomic analysis for RNA sequencing, including the up-regulation of E2F1, a transcription factor that plays a pivotal role in accelerating apoptotic progression [Citation13–15]. We also observed that the up-regulation of E2F1 parallels the increase of p53 tumour suppressor, a downstream effector of E2F1, and decreases PARP-1 (), providing a mechanism for the mEHT-mediated inhibition of cell cycle progression and induction of apoptosis in glioma cells. This finding is consistent with recent studies showing that the stabilisation of p53 drives apoptosis via the Rb/E2F1 signalling pathway [Citation15], and the attenuation of PARP-1 increases E2F1 transactivation to inhibit cell cycle progression [Citation14]. The E2F1-mediated apoptosis induced through mEHT might be an essential molecular mechanism explaining the clinical efficacy of mEHT and therefore requires thorough investigation.
Glioblastoma is the most common primary brain tumour, with a highly invasive nature. CSCs in glioblastoma are radio-resistant and chemo-resistant. Thus, targeting the CSCs might be an efficient therapy to prevent tumour recurrence after treatment [Citation25,Citation26]. A previous study reported that conventional hyperthermia effectively reduced a portion of breast CSCs in both single treatment and combinatory treatment with metformin [Citation27]. Through whole-genome RNA sequence analysis, we observed in this study that the inhibition of glioma cell growth through mEHT is associated with the down-regulation of ADAR1 transcripts, which was functionally validated to increase self-renewal [Citation16]. In addition, the CPSF2 gene, up-regulated through mEHT treatment, was correlated with increased CSC invasion when decreased in expression [Citation17]. These molecular clues prompted us to determine whether mEHT could therapeutically eliminate glioma stem cells. The results of various CSC assays revealed that mEHT showed remarkable efficacy in eliminating the CD133+ glioma stem cell population and decreasing sphere formation and migration. These findings suggest that mEHT could be a novel treatment option for preventing glioma recurrence.
In conclusion, in the present study using human glioma cell lines, we showed that mEHT induced the inhibition of cell proliferation and clonogenicity, induced apoptosis in vitro, and suppressed the growth of a glioma xenograft in nude mice. The anti-tumorigenic effects of mEHT might reflect the up-regulation of the E2F1 transcriptional factor. mEHT also eliminated cancer stem cells or stem-cell-like glioma cells, indicating that mEHT might be effective in preventing the recurrence and metastasis of tumours.
Declaration of interest
This project was financially supported through the Hospicare Corporation (2013-31-0557), South Korea, and through grants from the Korean Health Technology R&D Project, Ministry of Health & Welfare (A121982) and the Bio & Medical Technology Development Program, Ministry of Science, ICT & Future Planning (NRF-2012M3A9C7050149), South Korea. The authors alone are responsible for the content and writing of the paper.
References
- Louis DN, Ohgaki H, Wiestler OD, Cavenee WK, Burger PC, Jouvet A, et al. The 2007 WHO classification of tumours of the central nervous system. Acta Neuropathol 2007;114:97–109
- Schwartzbaum JA, Fisher JL, Aldape KD, Wrensch M. Epidemiology and molecular pathology of glioma. Nat Clin Pract Neurol 2006;2:494–503
- Ohgaki H, Dessen P, Jourde B, Horstmann S, Nishikawa T, Di Patre PL, et al. Genetic pathways to glioblastoma: A population-based study. Cancer Res 2004;64:6892–9
- Taraya-Brown S, Fiering S. Local tumour hyperthermia as immunotherapy for metastatic cancer. Int J Hyperthermia 2014;30:531–9
- Andocs G, Renner H, Balogh L, Fonyad L, Jakab C, Szasz A. Strong synergy of heat and modulated electromagnetic field in tumor cell killing. Strahlenther Onkol 2009;185:120–6
- Andocs G, Szasz O, Szasz A. Oncothermia treatment of cancer: From the laboratory to clinic. Electromagn Biol Med 2009;28:148–65
- Hegyi G, Szigeti GP, Szasz A. Hyperthermia versus oncothermia: Cellular effects in complementary cancer therapy. Evid Based Complement Alternat Med 2013;2013:672873
- Szasz O. Essentials of Oncothermia. Conference Papers in Medicine: Vol. 2013. Cairo: Hindawi Publishing, 2013
- Szasz A. Electromagnetic effects of nanoscale range. Oncothermia J 2013;9:11–25
- Wismeth C, Dudel C, Pascher C, Ramm P, Pietsch T, Hirschmann B, et al. Transcranial electro-hyperthermia combined with alkylating chemotherapy in patients with relapsed high-grade gliomas: Phase I clinical results. J Neurooncol 2010;98:395–405
- Gadaleta-Caldarola G, Infusino S, Galise I, Ranieri G, Vinciarelli G, Fazio V, et al. Sorafenib and locoregional deep electro-hyperthermia in advanced hepatocellular carcinoma: A phase II study. Oncol Lett 2014;8:1783–7
- Qin W, Akutsu Y, Andocs G, Suganami A, Hu X, Yusup G, et al. Modulated electro-hyperthermia enhances dendritic cell therapy through an abscopal effect in mice. Oncol Rep 2014;32:2373–9
- Wei WY, Yan LH, Wang XT, Li L, Cao WL, Zhang XS, et al. E2F-1 overexpression inhibits human gastric cancer MGC-803 cell growth in vivo. World J Gastroenterol 2015;21:491–501
- Kumari A, Iwasaki T, Pyndiah S, Cassimere EK, Palani CD, Sakamuro D. Regulation of E2F1-induced apoptosis by poly(ADP-ribosyl)ation. Cell Death Differ 2015;22:311–22
- Lv H, Liu R, Fu J, Yang Q, Shi J, Chen P, et al. Epithelial cell-derived periostin functions as a tumor suppressor in gastric cancer through stabilizing p53 and E-cadherin proteins via the Rb/E2F1/p14ARF/Mdm2 signaling pathway. Cell Cycle 2014;13:2962–74
- Jiang Q, Crews LA, Barrett CL, Chun HJ, Court AC, Isquith JM, et al. ADAR1 promotes malignant progenitor reprogramming in chronic myeloid leukemia. Proc Natl Acad Sci USA 2013;110:1041–6
- Nilubol N, Boufraqech M, Zhang L, Kebebew E. Loss of CPSF2 expression is associated with increased thyroid cancer cellular invasion and cancer stem cell population, and more aggressive disease. J Clin Endocrinol Metab 2014;99:E1173–82
- Singh SK, Hawkins C, Clarke ID, Squire JA, Bayani J, Hide T, et al. Identification of human brain tumour initiating cells. Nature 2004;432:396–401
- Galli R, Binda E, Orfanelli U, Cipelletti B, Gritti A, De Vitis S, et al. Isolation and characterization of tumorigenic, stem-like neural precursors from human glioblastoma. Cancer Res 2004;64:7011–21
- Meggyeshazi N, Andocs G, Balogh L, Balla P, Kiszner G, Teleki I, et al. DNA fragmentation and caspase-independent programmed cell death by modulated electrohyperthermia. Strahlenther Onkol 2014;190:815–22
- Andocs G, Meggyeshazi N, Balogh L, Spisak S, Maros ME, Balla P, et al. Upregulation of heat shock proteins and the promotion of damage-associated molecular pattern signals in a colorectal cancer model by modulated electrohyperthermia. Cell Stress Chaperones 2015;20:37–46
- Bogovic J, Douwes F, Muravjov G, Istomin J. Posttreatment histology and microcirculation status of osteogenic sarcoma after a neoadjuvant chemo- and radiotherapy in combination with local electromagnetic hyperthermia. Onkologie 2001;24:55–8
- Feyerabend T, Wiedemann GJ, Jager B, Vesely H, Mahlmann B, Richter E. Local hyperthermia, radiation, and chemotherapy in recurrent breast cancer is feasible and effective except for inflammatory disease. Int J Radiat Oncol Biol Phys 2001;49:1317–25
- Fiorentini G, Giovanis P, Rossi S, Dentico P, Paola R, Turrisi G, et al. A phase II clinical study on relapsed malignant gliomas treated with electro-hyperthermia. In Vivo 2006;20:721–4
- Khan IS, Ehtesham M. Targeting glioblastoma cancer stem cells: The next great hope? Neurosurg Focus 2014;37:E7
- Cho DY, Lin SZ, Yang WK, Lee HC, Hsu DM, Lin HL, et al. Targeting cancer stem cells for treatment of glioblastoma multiforme. Cell Transplant 2013;22:731–9
- Lee H, Park HJ, Park CS, Oh ET, Choi BH, Williams B, et al. Response of breast cancer cells and cancer stem cells to metformin and hyperthermia alone or combined. PLoS One 2014;9:e87979