
Abstract
Objectives: The objective of this study was to identify an injection strategy leading to repeatable nanoparticle deposition patterns in tumours and to quantify volumetric heat generation rate distribution based on micro-CT Hounsfield unit (HU) in magnetic nanoparticle hyperthermia. Methods: In vivo animal experiments were performed on graft prostatic cancer (PC3) tumours in immunodeficient mice to investigate whether lowering ferrofluid infusion rate improves control of the distribution of magnetic nanoparticles in tumour tissue. Nanoparticle distribution volume obtained from micro-CT scan was used to evaluate spreading of the nanoparticles from the injection site in tumours. Heating experiments were performed to quantify relationships among micro-CT HU values, local nanoparticle concentrations in the tumours, and the ferrofluid-induced volumetric heat generation rate (qMNH) when nanoparticles were subject to an alternating magnetic field. Results: An infusion rate of 3 µL/min was identified to result in the most repeatable nanoparticle distribution in PC3 tumours. Linear relationships have been obtained to first convert micro-CT greyscale values to HU values, then to local nanoparticle concentrations, and finally to nanoparticle-induced qMNH values. The total energy deposition rate in tumours was calculated and the observed similarity in total energy deposition rates in all three infusion rate groups suggests improvement in minimising nanoparticle leakage from the tumours. The results of this study demonstrate that micro-CT generated qMNH distribution and tumour physical models improve predicting capability of heat transfer simulation for designing reliable treatment protocols using magnetic nanoparticle hyperthermia.
Introduction
Hyperthermia is defined as elevating tissue temperature above 43 °C for minutes or hours. It is a promising approach either as a singular therapy or an adjuvant therapy with radiation and/or drug delivery in cancer treatment. Traditional hyperthermia treatments for cancer include microwave, radio-frequency, laser and ultrasound. All those methods require either a wave or current passing through a tissue and interacting with molecules to generate heat in tissue. The strength of the wave will decay along its path; therefore, before the wave reaches the targeted tissue region, most of the energy may have been absorbed by the superficial tissue layer. This may lead to either insufficient heating in the targeted region or collateral thermal damage to the surrounding healthy tissue.
To overcome limitations of traditional hyperthermia approaches, it is proposed to use nanotechnology to concentrate heat only in targeted tumours. The method of using iron oxide nanoparticles for treating cancer was developed initially in the 1950s to treat cancer in lymph nodes [Citation1]. This method is attractive to clinicians due to the biocompatibility of iron oxide-based nanoparticles in human tissue [Citation2–4]. In this approach, magnetic nanoparticles can deliver adequate heating to tumours when being exposed to a relatively low alternating magnetic field at a low frequency (∼100 kHz). The major heating mechanisms for particles include Néel relaxation and Brownian motion of the particles; however, other mechanisms such as hysteresis and eddy currents may also contribute to heating. Previous clinical and animal studies have shown substantial temperature elevations above the baseline temperature in tumours using this method [Citation5–12]. Most importantly, the thermal dosage delivered to tumours depends on distribution of nanoparticles deposited in tumours, once the nanoparticles are manufactured and the magnetic field strength and frequency are fixed.
In hyperthermia treatment using nanostructures, nanostructure distribution is a dominant factor that determines the spatial temperature elevations in tumours. Previous experimental data have suggested that the nanostructure concentration would not be uniform after delivery [Citation12–15]. Since tissue is opaque, nanostructure distribution is usually indirectly quantified via temperature measurements in tumours using inverse heat transfer analyses [Citation12]. Recently, micro-CT imaging has been demonstrated as a non-invasive and non-destructive method for investigating nanoparticle distribution in tumours. Although micro-CT (∼µm) does not allow direct visualisation of individual nanoparticles (∼nm), the accumulation of nanoparticles results in density variations in tissue that can be detected by a micro-CT system [Citation9,Citation14]. Our recent studies have demonstrated the feasibility of imaging and quantifying detailed 3D nanoparticle distribution in both gels and tumours [Citation9,Citation14]. From the high-resolution micro-CT images, it is evident that nanoparticle deposition patterns are not well controlled from one tumour to another, especially when the infusion rate is large (>10 µL/min). The irregular shape of the nanoparticle deposition pattern [Citation7,Citation9,Citation14] cannot be explained by the traditional porous medium theory with constant transport properties. One possible reason is morphological variance from one tumour to another.
Another possible reason is that the imposed injection pressure on tissue causes changes in the microstructures in tumours. There are several limitations in the previous studies by our group [Citation9,Citation16]. The three infusion rates (5, 10 and 20 µL/min) in the previous study resulted in large variations in the calculated nanoparticle distribution volume under the same infusion rate. The standard deviation of the nanoparticle distribution volume in each infusion group was often either compatible or twice the value of the average distribution volume. To make the volumetric heat generation distribution rate obtained applicable to any future animal or clinical study, one needs to identify an infusion strategy that leads to relatively repeatable nanoparticle distribution in the tumours studied, i.e. to minimise the standard deviation in the same infusion group. One possible approach to achieve this goal is to further decrease the infusion rate, therefore lowering the probability of crack formation.
To achieve a controllable thermal dosage in hyperthermia treatment using magnetic nanoparticles, one has to not only induce a relatively repeatable nanoparticle deposition volume in tumours, but also minimise any leakage of ferrofluid from the needle track and/or from the tumour to the surrounding healthy tissue. It has been reported from previous studies that a significant amount of ferrofluid leaked from tumours by observation either at the needle puncture hole or at the tumour–tissue interface after tumour resection [Citation7,Citation9,Citation16]. In our previous calculation of the total heat generation rate in PC3 tumours [Citation16], the inconsistency of the value based on the micro-CT scans obtained previously [Citation14] implies that not all the injected ferrofluid remains in the resected tumours. Therefore, additional investigations are warranted to ensure consistency between the known ferrofluid injection amount and the calculated total energy rate deposited in tumours.
Another limitation of our previous studies [Citation9,Citation16] was the use of the micro-CT greyscale value to correlate the local nanoparticle concentration in tumours. Micro-CT greyscale values depend on the X-ray source power level, the type of the X-ray source, the filter, the exposure time, and the distance from the source to the object. Therefore, the previously determined linear relationship between the ferrofluid-induced volumetric heat generation rate (qMNH) and greyscale values is only applicable to the specific scan setting in the previous study. The Hounsfield unit (HU), on the other hand, is a standard unit of measurement for CT imaging systems to describe the radiodensity of a material. A relationship between the universal HU and local nanoparticle concentration is clinically relevant since the relationship can be applicable to future studies using the same kind of nanoparticles and for comparison with results from other research groups.
With the advancement of computational and storage resources in the past decade, modelling biotransport in tissue is no longer implemented in simplified geometries such as rectangular columns, cylinders, and spheres. The available computational resource makes it possible to import the acquired 3D micro-CT images of tumour geometries and detailed nanoparticle concentration distribution, to commercial software packages for accurate heat transfer simulation. A heat transfer model based on image-generated tumour geometry and qMNH distribution would greatly improve model predicting power and lead to individualised and reliable treatment designs for various tumour sizes and types. Our previous study [Citation16] generated a prototype tumour model using only 13–30 micro-CT scan slices, and the tumour physical model was mounted on a rectangular volume representing the mouse body. Although the rough representation of the tumour and mouse geometry may not affect the simulation accuracy of tumour temperatures significantly, it may still be an important advancement to accurately model the details in those geometries, especially when point-to-point comparisons are necessary in some future theoretical simulation applications.
In this study, in vivo animal experiments were performed on prostate cancer xenograft tumours in immunodeficient mice to investigate how the infusion rate affects the distribution of magnetic nanoparticles in the tumour tissue. We hypothesised that distribution of nanoparticles would be more confined and more controllable at lower infusion rates due to lower interstitial pressure. An infusion rate to result in the most repeatable nanoparticle distribution in tumours was identified. Later, heating experiments were performed to determine the relationship between the HU and the nanoparticle-induced volumetric heat generation rate. Subsequently, the micro-CT images obtained can be used to extract qMNH distribution with tumour-generated physical models to improve accuracy of future heat transfer simulations to design reliable treatment protocols using magnetic nanoparticle hyperthermia.
Methods and materials
Animal and tumour models
Human PC3 prostate cancer cells were selected for this study. The PC3 cell line lacks androgen receptors, prostate-specific antigen (PSA), and 5α-reductase, and it produces poorly differentiated tumours when inoculated heterotopically into the flank of nude mice [Citation17,Citation18]. PC3 cells also have a higher level of holoclones, a colony-forming ‘stem cell’ with a higher growth potential (∼10% of total cell culture) than other canonical prostate cancer cell lines including DU145 and LNCaP. These properties make PC3 an ideal cell line for testing since they divide and grow at a faster rate than many other prostate cancer cell lines and are easy to differentiate from healthy tissue in in vivo and in situ tests.
To culture the PC3 cells, Petri dishes 15 cm in diameter were used, containing 25 mL of RPMI-1640 1× media with l-glutamine supplemented with 10% fetal bovine serum to stimulate cell growth. It was further supplemented with 50 μL of Plasmocin™ (InvivoGen, San Diego, CA) and 5 mL of penicillin–streptomycin (Corning Cellgro®, Mediatech, Manassas, VA) for every 500 mL of medium. The cells were then incubated at 37 °C in 5% CO2 for 3–4 days. The cells were finally suspended in a 1× phosphate buffered saline (PBS) (Fisher BioReagents™, Fisher Scientific, Springfield, NJ), counted, and diluted to appropriate concentrations for xenotransplantation.
Fifteen Balb/c Nu/Nu female mice (26.5 ± 3.2 g) were used (Jackson Laboratory, Bar Harbor, ME). These mice were inbred to ensure minimum variability among them. The mice were also immunodeficient to ensure that the xenograft cancer cells grew uninhibited. Aliquots of 5 × 10⁶ of the prepared PC3 cells were injected into each flank of the mouse using a 25 gauge needle (Tuberculin syringe with needle by BD, Fischer Scientific, Springfield, NJ). Tumour growth was observed and measured using a Vernier caliper and the tumours were allowed to reach a minimum size of 10 mm in diameter, which usually took 3–6 weeks.
Once the tumours reached the minimal diameter of 10 mm, the mice were anaesthetised with sodium pentobarbital solution injection (40 mg/kg, intraperitoneally (i.p.)). The mice were placed on a heating pad to maintain a core body temperature of approximately 37 °C, due to possible loss of a significant amount of body heat under the effects of anaesthesia. The animal protocols have been approved by the University of Maryland Baltimore County Institutional Animal Care and Use Committee.
Nanoparticle infusion
A commercially available water-based ferrofluid (EMG 700, Ferrotec, Bedford, NH) with a concentration of 5.8% magnetite nanoparticles per volume was used throughout this study. The particles had a nominal diameter of 10 nm with a log-normal standard deviation of approximately σln = 0.25. The particles were coated with an anionic surfactant to prevent particle agglomeration and displacement of the carrier fluid. The ferrofluid had a heat capacity of 3979 J/kg·K, a density of 1290 kg/m3, and its saturation magnetisation was 32.5 mT. All of this information was provided by the Ferrotec Corporation.
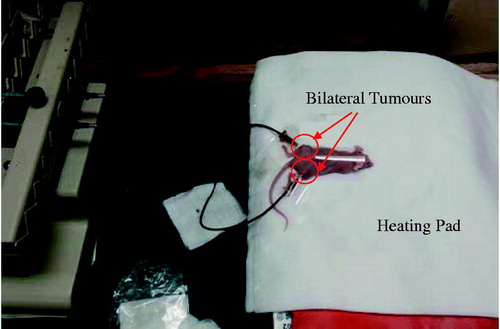
For each tumour, 0.1 cm3 of the ferrofluid was loaded into a 1-cm3 syringe (Norm-ject®, Fischer Scientific, Springfield, NJ) and injected directly into the tumour centre using a 26 gauge needle with a standard bevel tip (BD PrecisionGlide™ needle, Fischer Scientific, Springfield, NJ). The equivalent amount of iron delivered to the tumour was approximately 25.2 mg Fe, well below toxic levels of 60 mg Fe per kg of body mass and lethal levels of 250 mg Fe per kg of body mass [Citation19]. To determine how the infusion rate affected the repeatability and controllability of nanoparticle deposition in tumours, three infusion rates were evaluated. Three infusion rates lower than those of a previous study [Citation9] were selected to test the hypothesis whether lower infusion rates would lead to a more controllable nanoparticle distribution in tumours. As shown in , a syringe pump (KD Scientific S230, Holliston, MA) was used to control the infusion rate.
Figure 1. Experimental set-up for injecting ferrofluid into bilateral tumours using a syringe pump. The mouse is placed on an electric heating pad during the injection process.
The infusion rates were 5, 4, and 3 μL/min, with corresponding injection times of 20, 25, and 33 min, respectively, to finish the infusion to the tumour. There were five tumours in total in each infusion rate group.
After the injection, the needle was left inside the tumour for 15 min to minimise any backflow/leakage from the needle track. Then the needle was removed and the mice were allowed to rest for 30 min. The mice were then euthanised via sodium pentobarbital overdose (160 mg/kg, i.p.). The tumours were then surgically resected for micro-CT imaging.
Micro-CT imaging
Each resected tumour was scanned immediately after resection in a high-resolution micro-CT imaging system (Skyscan 1172, Microphotonics, Allentown, PA). The tumour was placed in a low-density styrofoam container to minimise photon absorption and prevent movement of tumours during scanning. A medium resolution scan was used with a pixel size of 17 μm (voxel size of 17 × 17 × 17 μm3) and a power setting of 100 kV and 100 μA with no filter. Flat-field correction was used prior to each scan to minimise noise and artefacts. The scan time for each tumour after a 360° rotation, 885 second exposure time, and a 0.3° rotation step was approximately 90 min and each scan resulted in over 500 individual images.
The images obtained from the micro-CT imaging system were reconstructed using NRecon®, a software package provided by Microphotonics. The images were converted into a series of cross-sectional images (2000 pixels by 2000 pixels). Before reconstruction, parameters such as beam hardening, ring artefacts, and smoothing were adjusted to minimise artefacts. Throughout the study, constant reconstruction parameters were used. The resultant reconstructed images were greyscale images where the pixel intensities ranged from 0 being black to 255 being white. One limitation of using greyscale values to extract nanoparticle concentration in tumours was that greyscale values depend on the X-ray source power level, type of X-ray source, filter, exposure time, and distance from the source to the object. To make the results obtained more clinically relevant, they were converted into the HU, a standard unit of measurement for CT imaging systems to describe the radiodensity of a material. It is given as:
(1)
where GS is the greyscale value of the tested specimen, or the water sample, or the air in the chamber. Deionised water was included with each scan as a reference material so that the data could be normalised to the HU scale and to verify consistency from scan to scan. On the HU scale, air has a value of −1000, water has a an HU value of 0, soft tissue has a HU value between −100 and 300, and bone has a value higher than 1000. The Hounsfield scale has been used to evaluate the composition of tumours in previous studies due to its broad acceptance in clinical applications [Citation11]. It has been found that the HU value of a tumour can be anywhere from −50 to 100, depending on its composition either with or without a contrast agent [Citation20–22]. To determine the relationship between the HU value and nanoparticle concentration in tumours, several specimens of ferrofluid of varying concentrations were scanned in the micro-CT imaging system and reconstructed using the same parameters used on the tumours. A linear curve was fitted to the data and the resulting expression used to estimate the spatial nanoparticle concentration in the tumour tissue.
Determination of nanoparticle-induced volumetric heat generation rate
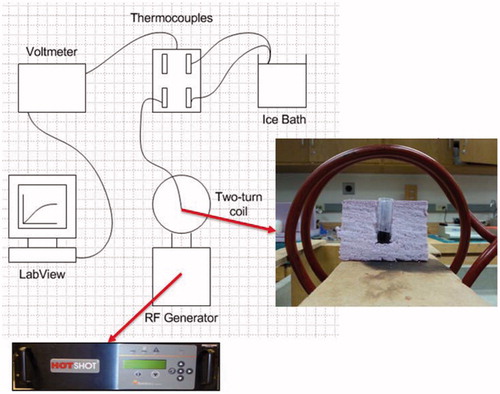
Our objective was to convert the HU from the micro-CT images to qMNH at a specific tumour pixel location. In the study we first conducted a simple heating experiment to determine the volumetric heat generation rates of the ferrofluid at specific concentrations. A ferrofluid with a known concentration was placed in a container in the centre of a two-turn water-cooled coil (160 mm inner diameter) connected to an RF generator (Hotshot 2, Ameritherm®, Scottsville, NY) to induce an alternating magnetic field [Citation12,Citation13], shown in . A current of 400 A was applied to the induction coil at a frequency of 190 kHz. To approximate the magnetic field strength, we assumed that our two-turn coil could be expressed as two loops with equal current and diameter [Citation23]. The analytical expression used to estimate magnetic field at the centre of the two loops is expressed as:
(2)
Figure 2. Schematic diagram of the heating experiment with 0.1 cm3 of ferrofluid in an insulated container inside a two-turn water-cooled coil.
Based on the parameters used in our study, we substituted the following values into the formula: R was the average coil radius (0.08 m), d was the distance between the two loops (0.028 m), and I was the current (400 A). The calculation is given below:
(3)
The estimation of the magnetic field strength was approximately 5 kA/m. The temperature at the centre of the ferrofluid sample was measured using a T-type thermocouple (Omega®, Stamford, CT) connected to LabVIEW® software via a switch/control unit (3488A, Hewlett Packard, Palo Alto, CA). The commercially available ferrofluid was diluted with deionised water to achieve a desired concentration (0–5.8% by volume). The qMNH was determined from time-dependent calorimetric measurements [Citation24–25]. To determine the qMNH, defined as the dissipated heating power per volume of the ferrofluid, the following expression was used:
(4)
where ρ was the density of the ferrofluid (1290 kg/m3), c was the specific heat of the ferrofluid (3979 J/kg·K), and the partial derivative represents the initial linear temperature elevation rate (K/s). This expression is essentially a reduced form of the heat conduction equation where qMNH is the source term. At the initial heating instant, the thermal effects of conduction and geometry can be ignored. The initial linear portion of the temperature rising curve was selected so that the R2 value was at least 0.95. Each ferrofluid specimen with a known nanoparticle concentration was then scanned. Assuming that the specimen was uniform, we expected that a single HU value was obtained for each specimen. With the newly obtained curve showing the relationship between the qMNH and ferrofluid concentration, a linear relationship was proposed to convert the HU value into a value of the qMNH, as shown in the following linear equation:
(5)
where C is a constant to be determined from the heating experiment.
The next step was to determine the nanoparticle generated qMNH distribution in the tumour. The challenge here was how to export it into a file that commercial numerical simulation software packages would accept and handle. Due to the vast amount of data (over 40,000 kb per text file for 500+ text files), the HU values were averaged over a pixel cluster of 7 × 7 × 7 pixels using SAS® (SAS institute, Cary, NC) to reduce the overall amount of data. The average HU of each pixel cluster was then converted to its associated qMNH obtained from the heating experiment and micro-CT imaging. Linear interpolation among data points was used to generate a qMNH file acceptable by both MATLAB and COMSOL software packages. The total amount of heat deposited into the tumour per unit of time can also be calculated by the MATLAB codes because of the known volume of each voxel. Since we did not vary the total amount of the ferrofluid injected into each tumour, it was expected that the obtained heat deposition rate in tumours should be consistent from one tumour to another.
Generation of a tumour model and quantification of nanoparticle deposition volume
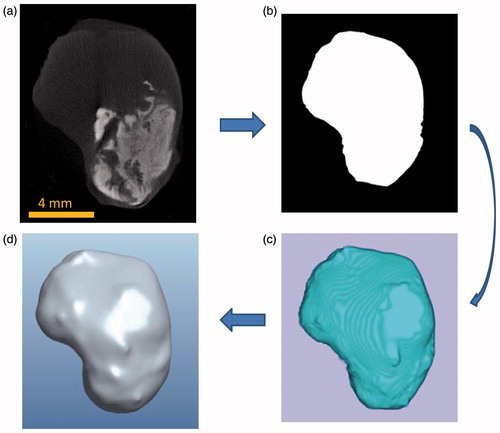
Based on the images obtained from the micro-CT imaging system, tumour prototypes were generated. shows an individual micro-CT slice of a tumour. The tumour boundary is evident in the figure. The white cloud shown in represents the region where nanoparticles are present. The higher the local nanoparticle concentration, the larger the greyscale number at the pixel location. Each individual micro-CT slice was imported into MATLAB® (Natick, MA) to be converted into a binary image using image processing tools in MATLAB. To reduce the effect of noise, the region inside the boundary is made uniformly white while the outside of the boundary is made uniformly black, and the boundary is smoothed (). The binary images were then imported into ImageJ, an open source image processing software developed by the US National Institutes of Health (NIH), and stacked to form a rough tumour prototype in the stereolithography (Stl) format which uses triangular elements to form the surface (). The file for the 3D prototype tumour was then imported into Pro/Engineer software (Parametric Technology Ccorporation) for format correction to be accepted into other 3D image processing software. Finally, the tumour model was imported into Rhinoceros 5.0 (McNeel North America, Seattle, WA) to convert the ImageJ model into a series of 3D spline curves in order to achieve a smooth surface boundary and eliminate the appearance of layers and rough edges (), ready for future numerical simulation software packages. The tumour model obtained using this method was a significant improvement from the previous study performed by our group where 13–30 slices from the micro-CT imaging system were extruded and stacked forming a rough representation of the actual tumour [Citation16]. In this study, all of the CT images were used and processed using new algorithms to obtain a much more accurate representation of the tumour model.
Figure 3. Processes of generating a tumour model from a micro-CT image (a), to a MATLAB generated tumour boundary (b), to an ImageJ tumour geometry (c), and to a smoothed tumour model by Rhinoceros (d).
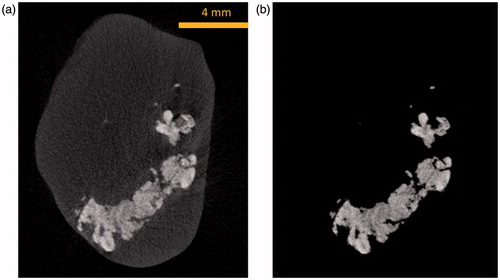
We used the nanoparticle distribution volume as a parameter to determine how far the nanoparticles migrate from the injection site. The nanoparticle distribution volume is defined as the combined volume of voxels where nanoparticles are present, represented by the white cloud in . The brighter the cloud region in the tumour tissue, the higher the local density. To quantify the nanoparticle distribution volume, the maximum greyscale value of the tumour tissue without nanoparticles was used as a threshold. All pixels with greyscale values below the threshold were made black, while all pixels above the threshold were white. The number of white pixels in all micro-CT images was summed and multiplied by the voxel volume to obtain the nanoparticle distribution volume. An example of thresholding using the algorithm can be seen in , where after the threshold is applied, only the voxels containing nanoparticles are shown.
Figure 4. (a) A typical micro-CT image before applying the threshold, and (b) a micro-CT image showing only voxels containing nanoparticles to determine the nanoparticle distribution volume.
Statistical analysis
All results in individual groups are expressed as mean ± SD. Comparisons between two groups were performed via Student’s t-test. Analysis of variance (ANOVA) was also employed to confirm the results obtained by the t-test, since performing multiple two-sample t-tests can result in an increased chance of committing a statistical type I error (incorrect rejection of a true null hypothesis). Statistically significant difference between two groups was defined when the p-value was smaller than 0.05.
Results
Generation of a tumour geometry model
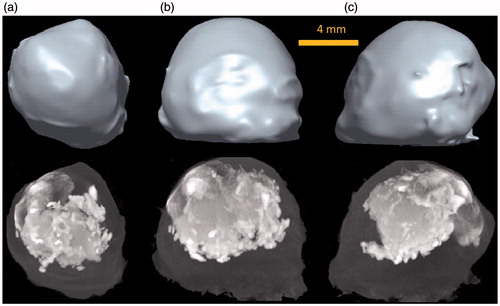
The tumour model generated can be seen in , compared to the maximum intensity projection (MIP) images to show a pseudo-3D representation of the same tumour in micro-CT scans. The tumour model generated corresponds very well to the shape and size of the actual tumour. The average volume of all tumours in the study is approximately 0.91 ± 0.12 cm3.
Figure 5. Pro/Engineer models and corresponding maximum intensity projection (MIP) images of a scanned tumour in the (a) axial plane, (b) sagittal plane, and (c) coronal plane.
Nanoparticle distribution volume
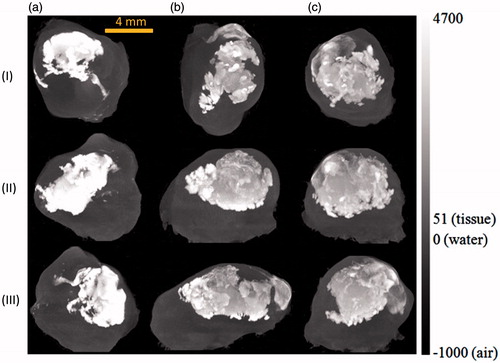
As shown in , the presence of nanoparticles in tumours results in an elevation of the Hounsfield values, represented by the cloud in the images. The shape of the nanoparticle cloud varies from one tumour to another. The nanoparticles are more confined to the tumour region when the nanoparticle cloud appears brighter in the image. After examining the effects of the infusion rate on the nanoparticle distribution in tumours, one can conclude that the tumours with a lower infusion rate have a smaller nanoparticle distribution volume. In addition, due to the same amount of ferrofluid injected, the confined nanoparticles are more concentrated when the infusion rate is lower.
Figure 6. MIP images of tumours injected at an infusion rate of (a) 3 μL/min, (b) 4 μL/min, and (c) 5 μL/min in the axial (I), sagittal (II), and coronal (III) planes.
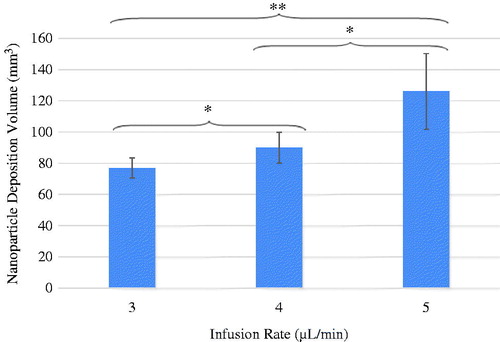
illustrates the average value and standard deviation of the nanoparticle istribution volumes of the three infusion rate groups. The nanoparticle deposition volumes for the infusion rate of 3, 4 and 5 μL/min are 77 ± 6.3, 90 ± 9.9, and 126 ± 24.3 mm3, respectively. Noted in is a smaller standard deviation in the 3 µL/min infusion group (77 ± 6.3 mm3) than in the other two groups. It suggests that using the 3 µL/min infusion rate would result in a relatively repeatable particle distribution volume. Since one of the objectives of nanoparticle hyperthermia is to achieve repeatable thermal dosage in treatment, the infusion rate of 3 µL/min may be a suitable injection strategy in future clinical studies to design controllable heating protocols. Using student’s t-test to compare the difference of any two infusion rate groups, the difference between any two groups was found to be significant. Since more than two groups were being analysed, ANOVA was also employed. The p-value obtained by ANOVA was 0.001, confirming statistically significant differences among the three groups.
Figure 7. Dependence of the nanoparticle distribution volume and its standard deviation on the infusion rate. The symbol * represents p < 0.05 and ** represents p < 0.001.
Determination of the volumetric heat generation rate distribution in tumours
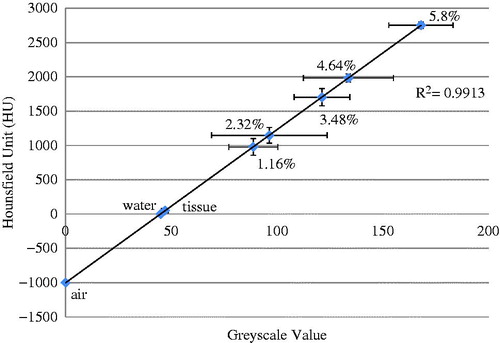
Scanning a deionised water sample with ferrofluid with a known nanoparticle concentration allowed us to determine a relationship between the HU and the greyscale values in the micro-CT images. shows the experimental data by scattered symbols and their standard deviations. A linear line was used to fit the average values in the sample groups. The linear relationship was used in the following analyses to convert the micro-CT image HU to a qMNH value for heat transfer simulations. The HU values obtained in this study were in the expected range [Citation11,Citation26].
Figure 8. Linear approximation of the relationship between the micro-CT HU and greyscale values, based on micro-CT scans of air, water, and ferrofluid samples at various concentrations (n = 5).
As mentioned in the Methods section, the qMNH value of a ferrofluid specimen with a known nanoparticle concentration was determined from the slope of the initial temperature rise curve in the heating experiment. Using the initial linear portion of the temperature rising curve and Equation Equation4(4) , the qMNH values are determined for ferrofluid with concentrations ranging from 0–5.8%. illustrates the relationship between the qMNH value and the ferrofluid concentration under the specific magnetic field. Experiments were repeated and standard deviations of groups are given. The results have demonstrated that a linear straight line could be used to model the relationship with an R2 value equal to 0.97. In many previous studies by other groups, specific loss power (SLP) is used, indicating SLP per iron mass, in W/g Fe. Based on the given density of 1.29 g/mL of the ferrofluid at 5.8% Fe3O4 concentration by volume, one can calculate that there is 0.252 g of Fe in 1 mL of the ferrofluid. Therefore, the energy generation rate per gram of Fe (SLP) for the specimen of the ferrofluid at 5.8% volume was converted from the qMNH as 13.5 W/g Fe. Similarly, all the qMNH values for other ferrofluid specimens were converted to SLP. It was found that the SLPs are almost independent of the ferrofluid concentration. The average value and standard deviation of all the SLPs obtained were expressed as 14.24 ± 1.49 W/g Fe. Shown in , the SLP values obtained from this study were compared with previous SLP values by other groups. Our results agree in general with those by other research groups using similar magnetic field strengths [Citation26,Citation27,Citation29].
Figure 9. Effect of the ferrofluid concentration on the volumetric heat generation rate (qMNH). Symbols and error bars represent experimental measurements, while the straight line gives the curve fitted relationship between the qMNH and the ferrofluid concentration. The sample size of each group is three.
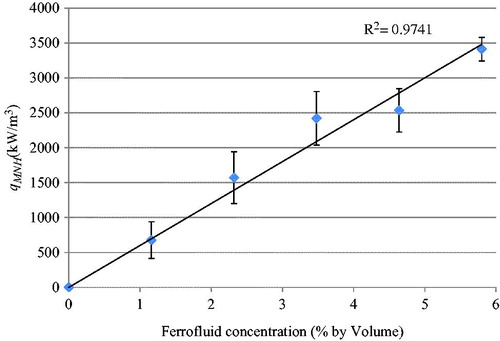
Table 1. Comparison of the obtained SLP range with that in previous studies.
The results of and were then combined to determine the relationship between the HU in micro-CT scans and the resulting qMNH values under the specific magnetic field strength. The linear relationship shown in can be used to convert the micro-CT HU value to the qMNH value using:
(6)
Figure 10. An obtained linear relationship between the qMNH and micro-CT HU values.
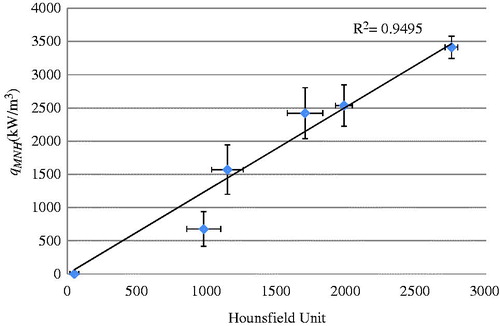
The linear relationship between the qMNH and the HU values is valid when the HU values is above a threshold HU value (HUtissue), obtained from that in tumour tissue without nanoparticles. When the HU value at a pixel location is lower than the threshold HU value (i.e. HUtissue), no heat generation occurs and the qMNH is zero. In Equation Equation6(6) , HUferrofluid at 5.8% represents the HU value of the ferrofluid having a concentration of 5.8%, while the value 3.4 × 10⁶ gives the qMNH value measured with the ferrofluid specimen from the simple heating experiment. Equation Equation6
(6) allows the conversion of any micro-CT scan results obtained by us to a distribution of the qMNH in the tumour, therefore, the qMNH file can be used later to simulate temperature elevations in tumours under the same magnetic field in this study.
Generation of the qMNH file
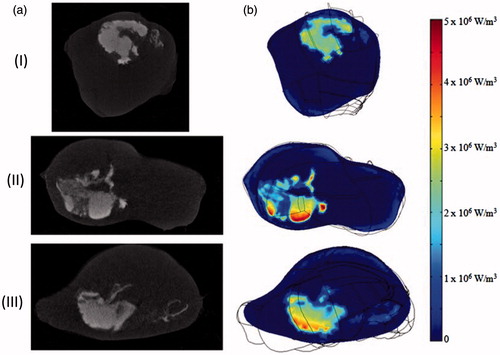
The generated qMNH distribution inside the tumour geometry can be visualised using the COMSOL 4.3 software. shows the micro-CT images of three slices of a tumour and their corresponding qMNH distribution contours by the COMSOL software. The qMNH distributions appear very similar to the white cloud in the micro-CT images with the brighter white regions corresponding to higher local qMNH values, confirming the accuracy of the generated qMNH file. The qMNH values vary from 2 × 10⁶ to 5.8 × 10⁶ W/m3. Note that the average qMNH value is similar to the order of magnitude generated by the ferrofluid before its injection into the tumour (3.4 × 10⁶ W/m3).
Figure 11. (a) Nanoparticle distribution from micro-CT imaging system and (b) the corresponding qMNH distribution in COMSOL in the axial (I), sagittal (II), and coronal (III) plane, respectively.
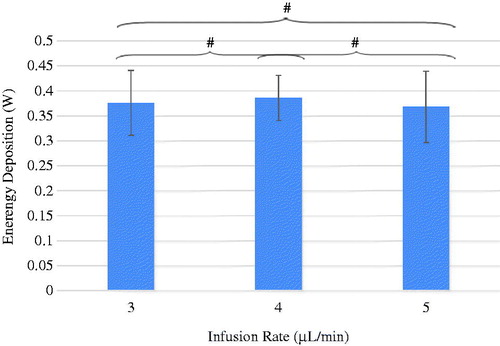
Using the relationship between the qMNH and the HU, one can calculate how much energy was deposited in the tumours during the hyperthermia experiment under the same magnetic field in our experimental settings. The total energy deposition rate calculated in the three groups of the infusion rate of 3 μL/min, 4 μL/min, and 5 μL/min is 0.38 ± 0.06, or 0.39 ± 0.05, or 0.37 ± 0.07 W, respectively, as shown in . The total energy rates deposited in the tumours were very similar from one infusion rate group to another. Statistical analyses were performed to calculate the p-values between any two groups and the p-values are all larger than 0.9, indicating no statistically significant difference between them. Since the total infusion amount is fixed in the study as 0.1 cm3 and the same ferrofluid is used, very similar energy deposition rates in all three infusion groups suggest improvement in minimising nanoparticle leakage from the tumours.
Figure 12. The effect of the infusion rate on the total energy deposition rate in the tumours. #p > 0.9.
Discussion
In this study we focused on evaluation of nanoparticle deposition via direct intratumoural injection of ferrofluid into xenograft prostate cancer tumours in nude mice, although nanoparticle delivery to tumours can be either systemic or local. Since the spatial distribution of nanoparticles in the tumour tissue dominated the spatial temperature elevation during heating, it was imperative to identify an infusion strategy for repeatable and controllable nanoparticle dispersions. Micro-CT imaging has demonstrated its ability to visualise and quantify the density increase due to the presence of iron-based nanoparticles in tumour tissue, allowing quantification of nanoparticle distribution volume and energy deposition distribution in tumours. The relationship between the micro-CT HU value obtained and the local nanoparticle concentration in tumours was determined, and it agrees well with other studies [Citation7,Citation14]. Micro-CT imaging currently appears to be a good tool for nanoparticle visualisation because it can detect higher local nanoparticle concentrations than MRI [Citation30–32]. It has also been demonstrated that micro-CT imaging technology can be used to generate accurate tumour geometries and qMNH distributions. One does need to be aware that one disadvantage of using micro-CT imaging is the exposure to X-ray for an extended period of time. There is a potential risk of secondary forms of cancer due to prolonged X-ray exposure [Citation33–34].
This study tested three different infusion rates to evaluate their effect on the nanoparticle distribution volume. Significant changes were found between the three infusion rates that differ by only 1 μL/min. As the infusion rate decreased, the average nanoparticle volume decreased. The standard deviation of the nanoparticle distribution volume also got smaller as the infusion rate decreased, suggesting more repeatable particle distribution volumes associated with slower infusion rates. On the other hand, a higher infusion rate resulted in a larger variation in the nanoparticle distribution volume. Using the Hagen-Poiseuille’s equation, increasing the infusion rate from 3 to 5 μL/min resulted in a 66% increase in pressure. We speculate that more crack formations in tumours due to higher pressures at the injection site is the major reason for the more spread out nanoparticle patterns, similar to that observed in previous studies [Citation9,Citation14,Citation35,Citation36]. Using the 3 µL/min infusion rate, the standard deviation of the nanoparticle distribution volume was approximately 8% of its average value, while it was more than 20% when the infusion rate was 5 µL/min. Based on the observed trend, we speculate that the standard deviation of the nanoparticle distribution volume would have further decreased if the infusion rate was smaller than the one used in this study, therefore, leading to a more repeatable nanoparticle deposition in PC3 tumours. However, a slow infusion rate implies a long infusion time, and it already takes more than 33 min to infuse 0.1 cm3 of the ferrofluid into the tumours when the infusion rate is 3 µL/min. If the current approach is implemented in future clinical studies one has to consider tolerance of patients of a long infusion time. Nevertheless, although the 3 µL/min infusion rate does not completely eliminate the nanoparticle deposition volume variation from one tumour to another, we consider that the 8% variation is sufficiently small; therefore, the 3 µL/min infusion rate will be used in our future experimental studies to achieve repeatable nanoparticle deposition in PC3 tumours.
The energy deposition rate calculated for each infusion rate group suggests that the infusion rate has a minor effect on the total nanoparticles deposited in the tumour. Ideally, these values should be the same since the same amount of the same ferrofluid was infused to the tumours. During the infusion process, the needle stayed inside the tumour for another 15 min after the infusion ended. A very small amount of ferrofluid was observed leaking out once the needle was withdrawn, although the amount of backflow was difficult to quantify. We were also very careful when resecting the tumours from the mouse bodies to minimise any loss of ferrofluid to the mouse body. These techniques seem to have resulted in significant improvement over previous experiments to control the total amount of nanoparticles deposited in tumours. One previous study reported that 89% of the injected nanoparticles were detected in the tissue while the remaining 11% leaked out and/or were carried away by the needle [Citation7]. Another experiment also showed more than 50% variation in the calculated total energy deposition rate in PC3 tumours, implying inconsistent total amounts of nanoparticles deposited in those tumours [Citation16].
The cross-sectional images obtained from the micro-CT imaging system are used to generate an accurate physical model of the PC3 tumour. It takes a considerable effort to generate a model that is acceptable to commercial simulation software packages. It was found that low resolution tumour models minimise the errors that may occur during meshing and to comply with the available memory. Our current processes may be simplified in the future to eliminate some of the steps when better computational resources become available.
A relationship between the qMNH values and the greyscale number can only be used for a specific X-ray setting; therefore the relationship is not general. To overcome this limitation, we adopted the HU via scanning the tumour with a water sample in each scan. It was expected that the relationship between the universal HU and the qMNH values would be independent of the X-ray setting, and may be used by other researchers in the future. Using the HU also allows for standardised quantification of local nanoparticle concentrations for accurate prediction of temperature elevations for planning treatment protocols.
One limitation of this study involved using 8-bit greyscale values ranging from 0 to 255. In our study, a value of 168 is associated with a nanoparticle concentration of 5.8% volume. Any considerably larger nanoparticle concentration would only register as the value of 255; therefore the truncation underestimates the local nanoparticle concentration, leading to a smaller qMNH value than it actually is. The HU has also been affected similarly. In the future 16-bit greyscale values would extend the scale range to 0–65,536; therefore it is more accurate to quantify the qMNH distribution in tumours.
The calibration curve for determining the volumetric heat generation rates was performed on diluted ferrofluid solutions. This is a limitation of this study since the composition of the ferrofluid may be slightly different from actual tumour tissue. An idealised situation would be to use a specimen of real tumour having uniform physiological properties and morphology with a known nanoparticle concentration. A recent paper [Citation29] has suggested that nanoparticles may agglomerate in PBS or agarose gels, leading to a decreased qMNH value from that in its original ferrofluid concentration. It is unclear whether the same conclusion is applicable to the in vivo biological environment with nanoparticles deposited in tumours. Future studies are warranted to continue to improve the calibration process via comparing in vivo temperature elevation measurements in tumours with that predicted by theoretical simulations based on the qMNH values.
In summary, we use micro-CT imaging to quantify nanoparticle distribution in opaque tumours. An infusion strategy was identified to result in repeatable and controllable nanoparticle distribution patterns in PC3 tumours. The micro-CT greyscale values were converted into the universal HU, and heating experiments were performed to obtain a linear relationship between the qMNH and the HU values to generate a qMNH file and a realistic tumour model for future temperature elevation simulations. The total energy deposition rate in tumours was calculated and the similar energy deposition rates in all three infusion rate groups suggest improvement in minimising nanoparticles leakage from the tumours.
Declaration of interest
This study was supported in part by a US National Science Foundation research grant CBET-1335958 and the Graduate Assistance in Areas of National Need Program at the University of Maryland Baltimore County (UMBC). The research was performed in partial fulfilment by Alexander LeBrun of the requirements for the PhD degree from UMBC. The authors alone are responsible for the content and writing of the paper.
References
- Gilchrist RK, Medal R, Shorey WD, Hanselman RC, Parrott JC, Taylor BC. Selective inductive heating of lymph nodes. Ann Surg 1957;146:596–606
- Moroz P, Jones SK, Gray BN. Magnetically mediated hyperthermia: Current status and future directions. Int J Hyperthermia 2002;18:267–84
- Reddy LH, Arias JL, Nicolas J, Couvreur P. Magnetic nanoparticles: Design and characterization, toxicity and biocompatibility, pharmaceutical and biomedical applications. Chem Rev 2012;112:5818–78
- Jain TK, Reddy MK, Morales MA, Leslie-Pelecky DL, Labhasetwar V. Biodistribution, clearance, and biocompatibility of iron oxide magnetic nanoparticles in rats. Mol Pharmacol 2008;5:316–27
- Hilger I, Frühauf K, Andrä W, Hiergeist R, Hergt R, Kaiser WA. Heating potential of iron oxides for therapeutic purposes in interventional radiology. Acad Radiol 2002;9:198–202
- Johannsen M, Thiesen B, Jordan A, Taymoorian K, Gneveckow U, Waldöfner N, et al. Magnetic fluid hyperthermia (MFH) reduces prostate cancer growth in orthotopic Dunning R3327 rat models. Prostate 2005;64:83–92
- Johannsen M, Gneveckow U, Thiesen B, Taymoorian K, Cho CH, Waldöfner N, et al. Thermotherapy of prostate cancer using magnetic nanoparticles: Feasibility, imaging, and three-dimensional temperature distribution. Eur Urol 2007;52:1653–62
- Maier-Hauff K, Ulrich F, Nestler D, Niehoff H, Wust P, Thiesen B, et al. Efficacy and safety of intratumoral thermotherapy using magnetic iron-oxide nanoparticles combined with external beam radiotherapy on patients with recurrent glioblastoma multiforme. J Neuro-Oncol 2011;103:317–24
- Attaluri A, Ma R, Qiu Y, Li W, Zhu L. Nanoparticle distribution and temperature elevations in prostatic tumours in mice during magnetic nanoparticle hyperthermia. Int J Hyperthermia 2011;27:491–502
- Rodrigues HF, Mello FM, Branquinho LC, Zufelato N, Silveira-Lacerda E, Bakuzis AF. Real-time infrared thermography detection of magnetic nanoparticle hyperthermia in murine model under a non-uniform field configuration. Int J Hyperthermia 2013;29:752–67
- Dibaji SAR, Al-Rjoub MF, Myers MR, Banerjee RK. Enhanced heat transfer and thermal dose using magnetic nanoparticles during HIFU thermal ablation – an in vitro study. J Nanotechnol Eng Med 2013;4:041003-1–8
- Salloum M, Ma R, Zhu L. An in-vivo experimental study of temperature elevations in animal tissue during magnetic nanoparticle hyperthermia. Int J Hyperthermia 2008;24:589–601
- Salloum M, Ma R, Weeks D, Zhu L. Controlling nanoparticle delivery in magnetic nanoparticle hyperthermia for cancer treatment: Experimental study in agarose gel. Int J Hyperthermia 2008;24:337–45
- Attaluri A, Ma R, Zhu L. Using microCT imaging technique to quantify heat generation distribution induced by magnetic nanoparticles for cancer treatments. ASME J Heat Transf 2011;133:011003-1–5
- Maier-Hauff K, Ulrich F, Nestler D, Niehoff H, Wust P, Thiesen B, et al. Efficacy and safety of intratumoral thermotherapy using magnetic iron-oxide nanoparticles combined with external beam radiotherapy on patients with recurrent glioblastoma multiforme. J Neuro-Oncol 2011;103:317–24
- LeBrun A, Manuchehrabadi N, Attaluri A, Wang F, Ma R, Zhu L. MicroCT imagegenerated tumour geometry and SAR distribution for tumour temperature elevation simulations in magnetic nanoparticle hyperthermia. Int J Hyperthermia 2013;29:730–8
- Kaighn ME, Narayan KS, Ohnuki Y, Lechner JF, Jones LW. Establishment and characterization of a human prostatic carcinoma cell line (PC-3). Invest Urol 1979;17:16–23
- Tai S, Sun Y, Squires JM, Zhang H, Oh WK, Liang CZ, Huang J. PC3 is a cell characteristic of prostatic small cell carcinoma. Prostate 2011;71:1668–79
- Goldhaber SB. Trace element risk assessment: Essentiality vs toxicity. Regul Toxicol Pharmacol 2003;38:232–42
- Boland GW, Lee MJ, Gazelle GS, Halpern EF, McNicholas MM, Mueller PR. Characterization of adrenal masses using unenhanced CT: An analysis of the CT literature. Am J Roentgenol 1998;171:201–4
- Ho LM, Paulson EK, Brady MJ, Wong TZ, Schindera ST. Lipid-poor adenomas on unenhanced CT: Does histogram analysis increase sensitivity compared with a mean attenuation threshold? Am J Roentgenol 2008;191:234–8
- Yoh T, Hosono M, Komeya Y, Im SW, Ashikaga R, Shimono T, et al. Quantitative evaluation of norcholesterol scintigraphy, CT attenuation value, and chemical-shift MR imaging for characterizing adrenal adenomas. Ann Nucl Med 2008;22:513–19
- Wangsness RK. Electromagnetic Fields. 2nd ed. Hoboken, NJ: Wiley, 1979 , ISBN-13 is 978-0471811862
- Jordan A, Wust P, Fähling H, John W, Hinz A, Felix R. Inductive heating of ferrimagnetic particles and magnetic fluids: Physical evaluation of their potential for hyperthermia. Int J Hyperthermia 1993;9:51–68
- Hiergeist R, Andrä W, Buske N, Hergt R, Hilger I, Richter U, et al. Application of magnetite ferrofluids for hyperthermia. J Magn Magn Mat 1999;201:420–2
- Gneveckow U, Jordan A, Scholz R, Brüss B, Waldöfner N, Ricke J, et al. Description and characterization of the novel hyperthermia – and thermoablation-system MFH 300F for clinical magnetic fluid hyperthermia. Med Phys 2004;31:1444–51
- Bordelon DE, Cornejo C, Grüttner C, Westphal F, DeWeese TL, Ivkov R. Magnetic nanoparticle heating efficiency reveals magneto-structural differences when characterized with wide ranging and high amplitude alternating magnetic fields. J Appl Phys 2011;109:124904-1–8
- Kalambur VS, Longmire EK, Bischof JC. Cellular level loading and heating of superparamagnetic iron oxide nanoparticles. Langmuir 2007;23:12329–36
- Etheridge ML, Hurley KR, Zhang J, Jeon S, Ring HL, Hogan C, et al. Accounting for biological aggregation in heating and imaging of magnetic nanoparticles. Technology 2014;2:214–28
- Wabler M, Zhu W, Hedayati M, Attaluri A, Zhou H, Mihalic J, et al. Magnetic resonance imaging contrast of iron oxide nanoparticles developed for hyperthermia is dominated by iron content. Int J Hyperthermia 2014;30:192–200
- Kalambur VS, Han B, Hammer BE, Shield TW, Bischof JC. In vitro characterization of movement, heating and visualization of magnetic nanoparticles for biomedical applications. Nanotechnology 2005;16:1221–33
- Johannsen M, Thiesen B, Wust P, Jordan A. Magnetic nanoparticle hyperthermia for prostate cancer. Int J Hyperthermia 2010;26:790–5
- de González AB, Darby S. Risk of cancer from diagnostic X-rays: Estimates for the UK and 14 other countries. Lancet 2004;363(9406):345–51
- Hall EJ, Brenner DJ. Cancer risks from diagnostic radiology. Br J Radiol 2008;81(965):362–78
- McGuire S, Zaharoff D, Yuan F. Nonlinear dependence of hydraulic conductivity on tissue deformation during intratumoral infusion. Ann Biomed Eng 2006;34:1173–81
- Boucher Y, Brekken C, Netti PA, Baxter LT, Jain RK. Intratumoral infusion of fluid: Estimation of hydraulic conductivity and implications for the delivery of therapeutic agents. Br J Cancer 1998;78:1442–48