
Abstract
Introduction The reliability of hyperthermia treatment planning (HTP) is strongly dependent on the accuracy of the electric properties of each tissue. The values currently used are mostly based on ex vivo measurements. In this study, in vivo conductivity of human muscle, bladder content and cervical tumours, acquired with magnetic resonance-based electric properties tomography (MR-EPT), are exploited to investigate the effect on HTP for cervical cancer patients. Methods Temperature-based optimisation of five different patients was performed using literature-based conductivity values yielding certain antenna settings, which are then used to compute the temperature distribution of the patient models with EPT-based conductivity values. Furthermore, the effects of altered bladder and muscle conductivity were studied separately. Finally, the temperature-based optimisation was performed with patient models based on EPT conductivity values. Results The tumour temperatures for all EPT-based dielectric patient models were lower compared to the optimal tumour temperatures based on literature values. The largest deviation was observed for patient 1 with ΔT90 = −1.37 °C. A negative impact was also observed when the treatment was optimised based on the EPT values. For four patients ΔT90 was less than 0.6 °C; for one patient it was 1.5 °C. Conclusions Electric conductivity values acquired by EPT are higher than commonly used from literature. This difference has a substantial impact on cervical tumour temperatures achieved during hyperthermia. A higher conductivity in the bladder and in the muscle tissue surrounding the tumour leads to higher power dissipation in the bladder and muscle, and therefore to lower tumour temperatures.
Introduction
Regional radiofrequency (RF) hyperthermia aims at heating the tumour to a temperature of 41–43 °C. Several randomised controlled trials [Citation1–3] have shown an increased tumour response and overall survival for hyperthermia combined with radiotherapy or chemotherapy. However, tumour-specific heating without inducing overheating in healthy tissue is technically challenging. Therefore, hyperthermia treatment planning (HTP) is an essential step to improve treatment quality. In HTP the optimal antenna settings (amplitudes and phases) are computed via electromagnetic (EM) field and thermal modelling. However, accurate tissue data acquisition, such as electric conductivity and permittivity, are critical for correct EM simulations and subsequent thermal dose computation in HTP. Values currently used in patient models are mostly based on ex vivo measurements of animal and human tissues [Citation4,Citation5]. Furthermore, as was shown in a review of the literature, there is a large variation in reported values between the different studies [Citation6]. This variation can be explained by the use of tissues of various species and differences in measuring conditions (tissue temperature, in vivo, in vitro and ex vivo). Due to practical and ethical reasons, human in vivo electric property (EP) measurements are scarce. Only easily accessible tissue types (e.g. skin, tongue) [Citation4] and liver [Citation7] have been measured in vivo.
Various deep HT studies [Citation8–10] have investigated the impact of inaccurate input data on the accuracy of HTP in the cervical region. Van de Kamer et al. [Citation8] found an error of 50% in the input data (the physical properties of fat, muscle and bone) resulting in an average error of <20% in power deposition (PD) and temperature distribution. They furthermore showed that, in particular, accurate knowledge of the conductivity values decreases this error [Citation8]. We previously reported [Citation9] that the sensitivity to uncertainty increases with increasing numbers of antennas and frequency; for all five clinical HTP models tested it was shown that an input data uncertainty might lead to a lower tumour T90 (temperature achieved in at least in 90% of the tumour volume) of up to 0.6 °C and 1.4 °C, for 4- and 12-channel systems, respectively. Canters et al. [Citation10] investigated 20 patient models wherein they observed a maximum difference from the optimal T90 of around −3 °C if uncertainties of input data (electric and thermal properties) were taken into account. Moreover, these studies showed that input uncertainties might lead to the occurrence of ‘hotspots’ in healthy tissue causing patient discomfort. In practice, the occurrence of hotspots limits the maximum achievable tumour temperature, which is essential for the clinical outcome.
Therefore, much effort has been focused on acquiring more accurate electric properties for HTP as well as for other applications such as evaluation of safety in telecommunications [Citation11] and magnetic resonance imaging (MRI) [Citation12–14]. Some non-invasive studies focused on acquiring these values based on MRI greyscale intensity [Citation15,Citation16] which mainly relates the electric properties to tissue water content. These techniques are sensitive to RF field inhomogeneities that influence the greyscale intensity. Furthermore, these techniques do not account for other factors that determine electric properties, such as blood content, ionic concentrations [Citation17] and tumour specific physiological changes. Recently, other non-invasive MR-based methods have received increased attention as they reconstruct EP values by exploiting the interaction of tissue with the EM fields generated by the RF MR coils. One such technique is electric property tomography (EPT) [Citation18–22] which reconstructs electric properties using field measurements acquired by standard MR systems.
Studies wherein the impact of uncertainty of electric property values were investigated [Citation8–10] assumed the conductivity of tumour to be equal to muscle tissue. However, various studies have shown that conductivity values of tumours of the breast [Citation23–25], liver [Citation7,Citation26,Citation27], bladder [Citation28] and gliomas of the brain [Citation29] are elevated compared to healthy tissues. Furthermore, these studies did not take into account the high conductivity of urine as shown in [Citation30–32]. Therefore, in a previous study we used EPT to determine the conductivity values of muscle, bladder content and cervical tumour tissue in vivo [Citation32]. Large discrepancies between the available literature values were reported in that study.
The aim of this study is to evaluate the effect of these discrepancies for HTP. For this purpose, we first evaluated the effect of measured conductivity on T50 and T90 for a HTP plan optimised using conductivity values available from the literature. Secondly, we evaluated the difference between optimised plans based on literature, or on EPT-based conductivity values.
Methods and materials
Patient models
To study the effect of EPT-based conductivity values on HTP, real life models were derived from CT-scans (voxel size 0.9375 × 0.9375 × 5.00 mm3) from five patients with cervical cancer who received regional hyperthermia as part of their treatment. These scans were made under the same treatment set-up regarding mattresses and water bolus as during a hyperthermia treatment. Tissue segmentation for bone, fat, inner air and muscle was based on thresholding by Hounsfield units [Citation33], with manual delineation of the bladder and the cervical tumour by a radiation oncologist. Finally, the patient models were down-sampled based on the winner-takes-all principle [Citation34] to 2.5 × 2.5 × 5.0 mm voxel size and finite difference time domain (FDTD) simulations [Citation35] were conducted using the 70 MHz AMC-4 and AMC-8 system configurations as described in van Dijk et al. [Citation36] and Crezee et al. [Citation37], respectively. These two systems are similar except for using four and eight antennas, respectively. This difference in the number of antennas affects the steering capabilities and was shown to affect the impact of deviations in conductivity input data [Citation9].
Temperature optimisation
Temperature-based optimisation was performed to determine patient-specific phase-amplitude settings leading to optimal tumour heating [Citation38–40]. Temperature-based optimisation is preferred over specific absorption rate (SAR) optimisation as the former takes the relevant heating and cooling mechanisms in human anatomy into account. Tumour temperatures are in the end the determining factor for clinical outcome.
Tissue temperature computations were based on the conventional Pennes’ bio-heat transfer equation [Citation41]:
(1)
where c is the specific heat capacity, ρ the tissue density [kg/m3], k the thermal conductivity [W m−1 K−1], cb the specific heat of blood [J kg−1 K−1], Wb the volumetric perfusion rate [kg m−3 s−1], Tart the local arterial or body core temperature (37 °C) and P the power density [Wm−3] added by the heating system. The latter is directly affected by the varied conductivity values in this study as P = σ E(σ, ɛr )2 /2. The term ∇ (k∇T) represents the heat conduction in tissue and cb Wb (T − Tart) models the perfusion. Thermal properties shown in are taken from the literature [Citation42,Citation43]. The blood perfusion reported in the literature, however, is generally based on measurements conducted in resting conditions. Therefore we have used elevated perfusion values to account for thermal stress under hyperthermic conditions [Citation44].
Table 1. Thermal properties assigned to different tissue types used for hyperthermia treatment planning. Values are based on [Citation42,Citation43].
The optimisation process aimed at a tumour temperature of 43 °C by minimising the following objective function:
(2)
which minimises the tumour volume with a temperature below 43 °C. To avoid excessive normal tissue heating, a maximum tolerable normal tissue temperature of 45 °C was imposed. Constraints were further imposed on the antenna contributions to the total delivered power such that for the AMC-4 a single antenna contribution was set to at least 10% and a maximum of 40% to the total power. For the AMC-8 the constraints were set to 5% and 25%, respectively. This procedure was optimised using CFSQP (C routines for feasible sequential quadratic programming) [Citation45]. The temperature-based optimisation exploited in this paper is described in more detail in Kok et al. [Citation40].
Tumour temperatures of the optimised temperature distributions were expressed as T50 and T90, representing the temperatures achieved in at least 50% and 90% of the tumour volume, respectively. Moreover, the SAR corresponding to the optimal antenna settings was analysed as well.
Impact of EPT-based conductivity values
To assess the effect on tumour temperature, electromagnetic field simulations were conducted for each patient for five different combinations of dielectric properties. We first established the tumour T90 and T50 after optimisation with literature values and then recalculated T50 and T90 with the same antenna settings but now using EPT-based data for one or more tissue types.
The EPT reconstructions were performed using amplitude measurements and the transceiver phase approximation (
) was applied as described in the literature [Citation19,Citation21,Citation46,Citation47]. The central equation of the EPT method is the homogenous Helmholtz equation
(3)
where
is the complex transmit field (
), ω is the Larmor angular frequency, μ0 and ɛ0 are the permeability and permittivity of vacuum, respectively, and ɛr and σ are the unknown relative permittivity and conductivity of the object of interest, respectively. Using the measured
and the ϕ± distribution the conductivity can be reconstructed by
(4)
and the relative permittivity by
(5)
In case I the tissue properties for muscle, air, bone and fat are based on literature [Citation5,Citation42,Citation43,Citation48] and the tumour and bladder are assigned muscle electric property values. In case II the conductivity values were based on EPT [Citation32]. In Balidemaj [Citation32], only the conductivity values of muscle, bladder filling and cervical tumour were acquired; therefore other tissue parameters were kept the same as in case I. In case III the bladder conductivity was higher than in case II, while other properties were the same as in case II. Based on Balidemaj [Citation32], the inter-patient variation of bladder content conductivity was higher and the maximum observed bladder conductivity was approximately 2.50 S/m; similar values were also observed [Citation49–51]. Cases IV and V consisted of dielectric patient models where the conductivity of bladder or muscle only, respectively, was assigned based on EPT [Citation32], while the other values were kept the same as in case I. We have investigated the effect of bladder and muscle separately to gain more insights on tissue- and organ-specific contributions. In Balidemaj [Citation32], the conductivity values at 128 MHz (3 T field strength) were measured; therefore 3% lower values were used for 70 MHz frequency, which is in accordance with the deviation found in this frequency range for various tissue types [Citation5]. An overview of all tissue parameters used for EM field computations is given in .
Table 2. Electrical properties assigned to different tissue types at 70 MHz used for hyperthermia treatment planning. Values are based on Gabriel et al. [Citation5,Citation42,Citation43,Citation48]. Bold type denotes electrical conductivity values based on EPT [Citation32].
Temperature-based optimisation was conducted for the literature-based model (case I) for all patients resulting in optimised antenna settings for each patient valid for literature data. Those antenna settings were then applied to patient models with different conductivity values as in cases II–V. The T50, T90 and SAR were then compared to case I, the model using literature-based conductivity values.
The uncertainty of EPT-based conductivity values is around 15% for muscle and cervical tumour tissue as reported in Balidemaj et al. [Citation22,Citation32]. The variation of bladder content conductivity was larger (30%), as there is also a large variation of sodium content in urine between different individuals [Citation30,Citation50]. Therefore, to evaluate the effect of uncertainty of EPT values, we have conducted additional simulations for minimal and maximal conductivity values of muscle, cervical tumour, and bladder content, respectively, as shown between the brackets in case II ().
Impact of muscle permittivity variation
Based on the equation for SAR (SAR = σ E(σ, ɛr)2 /2ρ [W/kg]) one would expect a determinative effect on HTP due to uncertainties in tissue conductivity values. However, the electric field is also influenced to some extent by the tissue permittivity. As we have previously reported [Citation32] only conductivity values, the effect of permittivity uncertainties was investigated by considering the uncertainty of muscle permittivity only, as it constitutes a large volume that has the largest relative permittivity value in the pelvic region. Therefore, the largest effect on the temperature distribution would be caused by deviations from the literature value for muscle tissue. In general, EPT is able to reconstruct permittivity value as well; however, the reliability of the permittivity reconstruction at 3 T is less reliable, as shown in van Lier [Citation21]. EM field and thermal modelling were performed for two patients using muscle permittivity values deviating 20% from the literature value. More specifically, EM simulations were conducted for patients 1 and 5 with conductivity values as described in case II () while muscle permittivity was fixed at 60, 70, 75, 80 and 90 for each simulation. Patients 1 and 5 were chosen because the effect of muscle conductivity on T90 was lowest and highest, respectively, for these patients. We denote these cases as IIɛr, m = 60 − 90. All other permittivity values remained unchanged. Antenna settings optimised for the literature-based model (case I) were used to compute the temperature distributions for different permittivity values.
EPT-based versus literature data-based temperature optimisation
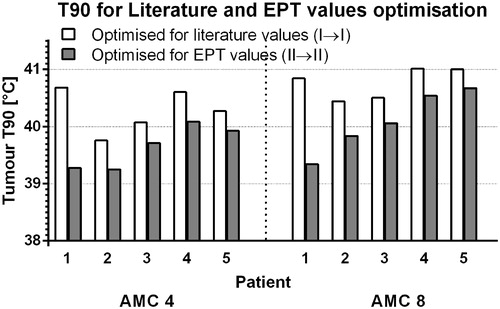
Temperature -based optimisation was also performed for the patient model using EPT-based conductivity values of all patients (case II) to compute the tumour temperature achievable for EPT conductivity values. These results were then compared to the tumour temperature achieved when optimisation was conducted using the literature-based dielectric models (case I). We compared the tumour T90 between optimisation with literature values (case I) and optimisation with EPT values (case II).
In an overview is given which shows the dielectric case on which the temperature optimisation was performed (data-set optimisation) and for which dielectric case these antenna settings were applied (actual parameters). For example label I→II means that antenna settings optimised for case I were applied to dielectric case II.
Table 3. An overview of the dielectric data sets used for optimisation (second row) and the dielectric data set on which the optimised antenna setting was applied (third row). Data sets are listed in Table 2. Results are depicted in Figures 1–4.
Results
Impact of EPT-based conductivity values
Tumour T90 and T50 for dielectric cases I–V are shown in . The tumour temperatures for all EPT-based dielectric patient models (cases II–V) are lower compared to the literature-based model of the corresponding patients 1–5. The largest deviation can be seen in patient 1 where ΔT90 = −1.37 °C (AMC-8) is observed for the EPT-based dielectric model (case II) and a ΔT90 = −1.81 °C (AMC-8) in combination with an elevated bladder conductivity value (case III). The impact of different dielectric models on tumour T90 in patients 2–5 was relatively low (ΔT90 ≤ −0.57 °C). The lowest impact on T90 can be observed when EPT conductivity values were assigned only to the bladder (case IV). This was the case for patients 2–5; however, in patient 1 the T90 was substantially influenced by the conductivity of bladder (case IV). In the tumour SAR is shown for all patient models as presented in . A similar trend regarding tumour SAR can be observed for all dielectric cases.
Figure 1. Tumour T90 (top) and T50 (bottom) in patients 1–5 for AMC-4 and AMC-8 system. The white bar represents the optimised case for properties based on literature values. Using the same antenna settings, the tumour temperature for different cases are computed and represented by other bars.
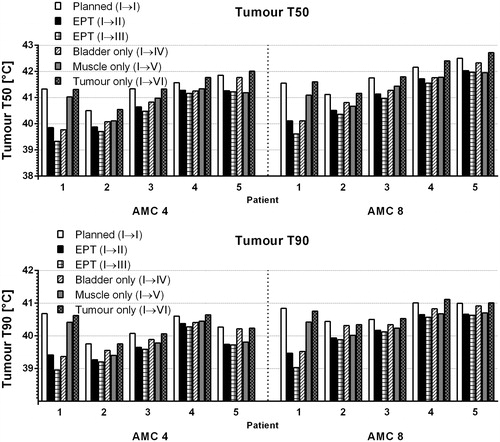
Figure 2. Tumour SAR in patients 1–5 for AMC-4 and AMC-8 system. The white bar represents the optimised case for properties based on literature values. Using the same antenna settings, the tumour temperatures for different cases are computed and represented by other bars.
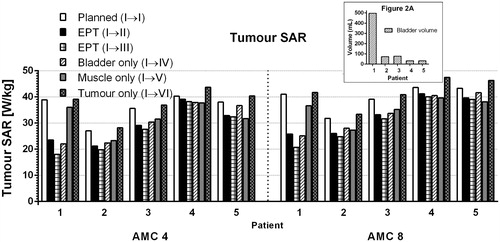
Since the conductivity of bladder content, based on [Citation32], is higher than the currently used value based on literature, the absorbed power in the bladder is higher and, therefore, the average SAR in the tumour is lower, as observed in . An even stronger impact on T50 and T90 can be observed when assigning an even higher bladder conductivity (case III) that might occur as reported in Balidemaj [Citation32] and Kavukcu et al. [Citation49–51]. The same trend can be observed for the cervical tumour SAR, as more power is dissipated in the bladder. The impact of varying only the bladder conductivity was also investigated (case IV) and the difference observed in T50 and T90 for patients 2–5 was less than 0.5 °C, whereas in patient 1 the T90 deviation was 1.32 °C. in effect this difference can be compared with the difference in bladder volume for patients 1–5 plotted in , an insert in , where we can see that bladder volume varies between 33 mL for patient 4 and 5 and 497 mL for patient 1.
The impact of a higher muscle conductivity was also observed in case V where the EPT-based conductivity value was assigned only to muscle ( and ). The impact due to correction limited to the conductivity values for muscle differs from patient to patient. Because of the high volume of muscle and tumour tissue, the highest impact was observed in patient 5 (ΔT90 = −0.46 °C for AMC-4). The impact of higher tumour conductivity (case VI) on tumour temperature was very limited, as can be observed in and . Tumour T90s are very similar to case I; however, a slight increase of T50 by 0.20 °C and 0.16 °C (for AMC-4) can be observed for patients 4 and 5, respectively, which have the largest tumour size in this patient population. For AMC-8 the T50 increase for patients 4 and 5 is slightly higher, 0.25 °C and 0.21 °C, respectively. An increase of tumour SAR can also be observed in these two patient models ().
The impact on T50 and T90 of using EPT-derived conductivity values (case II) is the largest for patient 1 (ΔT90 = −1.37 °C, for AMC-8), presumably due to the larger bladder volume compared to other patients. Furthermore, hotspots occurred for all patients outside the target region for all dielectric cases II–V. The local temperature exceeded the constraint of 45 °C by 1.0–1.7 °C for case II, 1.0–2.8 °C for case III and 0.9–1.6 °C for case V. Regarding case IV, the local temperature in patient 1 exceeded the tolerable temperature by 3.2 °C, while three patients had no hotspots for the AMC-4 system.
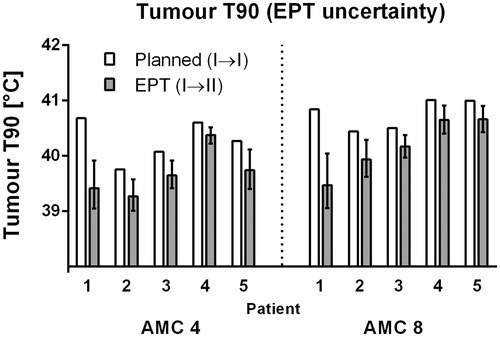
The impact of uncertainty of EPT data on tumour T90 is shown in . The lowest conductivity values for muscle, cervical tumour, and bladder content lead to a higher tumour temperature compared to the mean values in case II. The difference between planned (case I) and lowest conductivity values is then 0.80 °C for patient 1, and less than 0.18 °C for all other patients. On the other hand, the highest conductivity values obviously have an even higher negative impact on tumour temperature as indicated by the corresponding lower part of the error bars in .
Figure 3. Tumour T90 in patients 1–5 for AMC-4 and AMC-8 system. The white bar represents the optimised case for properties based on literature values. The error bars represent the minimum and maximum tumour T90s when using highest and lowest conductivity values, respectively, as presented in case II (Table 2).
Impact of muscle permittivity variation
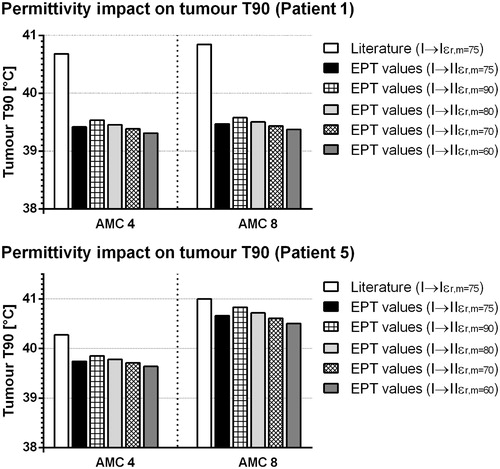
In the impact of muscle permittivity variation (case IIɛr, m = 60 − 90) on tumour T90 for patients 1 and 5 is shown. For easy comparison, the T90 for cases I and II as depicted in , are repeated in this graph. It can be observed that the impact of permittivity variation on the tumour T90 is relatively low for patient 1. The maximum error in tumour T90 does not exceed 0.11 °C (AMC-4) between highest and lowest possible permittivity, whereas the application of EPT values (case II) on this patient lead to a ΔT90 of −1.26 °C (AMC-4). The variation of permittivity in patient 5 resulted in a relatively larger (but still small) error of 0.16 °C (AMC-8) whereas the T90 deviation due to EPT values (II) was 0.34 °C (AMC-8).
Figure 4. Tumour T90 for patients 1 (top) and 5 (bottom) for optimised cases with literature value (white) and for EPT-based conductivity values of muscle, cervical tumour and bladder filling (black). The other bars represent tumour T90 values for different values of muscle permittivity.
Impact of EPT-based patient model on optimised temperature distribution
In the tumour T90s for a literature-based dielectric model are represented by white bars for patients 1–5 as also shown in . The grey bars in represent the tumour T90 when temperature-based optimisation is performed using the EPT-based patient models. It can be observed that the tumour T90 is lower for all patients when optimised using EPT conductivity values. The difference in T90 varied between −1.50 °C (patient 1; AMC-8) and −0.33 °C (patient 5; AMC-8).
Figure 5. Tumour T90 for patients 1–5 based on literature values (white) and on EPT-based conductivity values (grey). The applied antenna settings were computed separately by temperature-based optimisation for both cases.
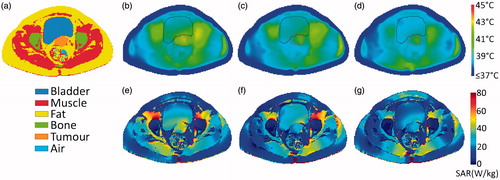
In an example of a transversal slice of patient 1 is shown with the resulting temperature distribution for the cases (I→I), (I→II) and (II→II). Hotspots arise due to application of antenna settings optimised for literature values to EPT-based model (I→II, ), these are not visible in the slice shown, as they occurred on transversal slices outside the tumour volume. The corresponding SAR distributions are shown in the second row of .
Figure 6. An example of the resulting temperature distribution of patient 1 corresponding to transverse slice (a) for the case, (b) planned with literature values (I→I), and (c) the case where the same antenna settings are applied on the EPT-based model (I→II). In (d) is shown the distribution resulting for temperature-based optimisation based on EPT model (II→II). (e–g) The corresponding SAR distributions are shown.
Discussion
In this study we investigated the difference in planned hyperthermia temperatures between electric conductivity values from the literature and values assessed in vivo by MRI-based EPT in cervical cancer patients [Citation32]. The impact of EPT values for muscle, bladder and tumour values was investigated in CT datasets of five patients and for both the AMC-4 and the AMC-8 system operating at 70 MHz. A lower tumour temperature was observed when using EPT-based conductivity values both when phase and amplitude were optimised for literature values and when they were optimised for the actual EPT-based values ( and ).
As cervical tumours are surrounded by muscle tissue, for which the in vivo conductivity value is higher [Citation32], more power is dissipated in the muscle, and therefore the tumour SAR is lower, as is shown in . This subsequently results in lower tumour T50 and T90 (). Based on the patient models used, a large bladder volume has a negative impact on the maximum tumour SAR, and hence on the tumour T50 and T90. The negative impact of ‘bladder only’ on T50 and T90 might seem slightly counter-intuitive as one would expect a bladder with a higher conductivity to reach higher temperatures and subsequently, through heat transfer, to lead to a higher tumour temperature, but this was not the case for patient models used in this study. However, it should be noted that the fluid inside the bladder is modelled as a solid, so that the effects of convection are ignored, and the amount of heat transferred is probably underestimated [Citation52]. The T90 and the SAR in the bladder (not shown here) were slightly lower in most patients. A higher local maximum temperature was, however, observed in the bladder in most patients due to elevated bladder conductivity. Finally, in dielectric cases (I→II, I→III, I→V) the temperature constraint of 45 °C for normal tissues was violated for all patients.
As observed in , the tumour T90 is lower in all cases of electric conductivity values, even though the temperature optimisation is based on EPT conductivity values (II→II). The worst case can be observed in patient 1 (ΔT90 = −1.50 °C, for AMC-8), whereas for other patients the maximum tumour T90 was less than 0.6 °C lower compared to the literature-based model. This indicates that the higher conductivity value of muscle limits the maximum tumour temperature that can be achieved. As tissue conductivity increases with temperature (for muscle about 2%°C−1) [Citation53] and since the EPT measurements were performed at non-hyperthermic temperatures, the power dissipation in the muscle may be even higher during hyperthermia. However, the additional effect on tumour T90 due to the tissue temperature increase is expected to be relatively low since a 24% muscle conductivity increase (case V) leads to ΔT90 ≤ −0.46 °C (see ). Furthermore, future studies should focus on the benefit of EPT-based treatment planning in a clinical setting.
EPT can be easily incorporated in the current clinical practice, as in general all cervical cancer patients undergo an MR examination for diagnostic purposes. An MR provides higher soft tissue contrast, allowing for more accurate definition of tumour region, and in addition, MR-only based radiotherapy is feasible [Citation54–56]. Due to the increased utilisation of MR in the clinic, acquisition of B1 maps for EPT can be efficiently included in the clinical workflow.
Various studies have demonstrated that the tissue electric conductivity is determinative for SAR [Citation8,Citation57]; nevertheless, the electric permittivity affects EM behaviour inside human anatomy as well. We have limited the permittivity uncertainty to muscle only as it has a relatively high permittivity compared to other tissue in the pelvic region, and represents a high tissue volume. Therefore, its uncertainty was expected to have the largest impact. As observed in , the variation of electric permittivity of muscle by 20% around the literature value has a relatively low impact on the tumour T90 compared to the impact of conductivity values (). The uncertainty of 20% for permittivity is quite high, and in practice a lower uncertainty is expected. Based on Schmid et al. [Citation58] the permittivity of porcine brain tissue, permittivity drops by 3% after animal death (at 900 and 1800 MHz), while the same study reported a 15% drop of conductivity value after death. Furthermore, Kraszewski et al. [Citation59] reported an approximately 5% higher permittivity value for skeletal cat muscle when measured in vivo at 100 MHz. Therefore, the lower permittivity uncertainty compared to conductivity and its low impact on tumour T90 (), indicate that in particular the measurement of in vivo conductivity values contributes strongly to a reliable HTP. In contrast to conductivity, a slightly higher muscle permittivity seems to have a positive effect on tumour T90 (), probably due to the higher penetration depth of EM fields at higher tissue permittivity [Citation60].
In this study we have not considered the uncertainty of thermal properties [Citation61]; however, it has been investigated in other studies [Citation9,Citation62]. We previously studied the impact of ± 25% uncertainty in perfusion parameters alone (of muscle and fat) [Citation9]. The difference between optimal and realised T90 for five patients was on average 0.2 °C and 0.3 °C lower, for the AMC-4 and AMC-8 systems, respectively. The present paper shows that the tissue properties have a profound impact on the amount of energy one is able to get into the tumour. This impact remains important, even when the role of perfusion is taken into account. Other uncertainties that were not considered include the patient position, organ deformation and manual versus automatic tissue segmentation [Citation12,Citation63–68]. Furthermore, the temperature distributions in this study were based on the Pennes bioheat model which is commonly used in the literature. A more accurate but also more complex way to compute temperature distributions is by modelling discrete blood vessels [Citation69] which requires additional data of the vasculature in the heated region and information regarding the blood flow during hyperthermia treatment. Therefore, in absence of the additional data we have used the standard thermal model. Regardless, the SAR computations are only influenced by electric properties and showed a decrease of tumour SAR due to EPT conductivity values.
In this study we have limited the impact of EPT-based conductivity values on cervical tumour tissue which is generally located in the central pelvic region. However, the impact on pelvic tumours located in the periphery would suffer less from higher muscle or bladder conductivity compared to cervical tumours. For instance, if the bladder is the target region [Citation70–72] then it would likely be less affected by the higher muscle conductivity. In addition, a full bladder might be more beneficial for the treatment of bladder tumours than an empty bladder; however, additional simulations are required to confirm this effect. For the treatment of cervical tumours, however, an empty bladder seems to be beneficial as more power is deposited in the tumour. Only patient 1 had a completely full bladder, having the largest negative impact on tumour temperature, whereas patients 4 and 5 with practically empty bladders showed the lowest impact.
We have investigated the impact of EPT values on heating with the AMC-4 and AMC-8 systems. However, the impact on tumour temperatures when using a configuration with more than 8 channels and/or systems operating at higher frequencies is expected to be even higher, as also shown in de Greef et al. [Citation9] for a 12 and 18 channel system. Since the penetration depth of EM fields decreases with increasing frequency, it should be investigated to what extent the EPT-based values impede tumour heating. As the conductivity of urine is much higher [Citation42,Citation43,Citation48] than currently considered in models, it should be explored if an empty bladder would be beneficial for the tumour temperature. Results in this study suggested that a small bladder volume has a positive impact on the tumour T90, but this should be investigated in a larger population and verified by measurement during hyperthermia. Finally, as a higher muscle conductivity had a determinative effect on tumour T90 for four out of five patients ( and ), research should also be focused on how to circumvent the higher power dissipation outside the target region.
Conclusion
Electric conductivity values acquired by EPT are higher than the literature values used until now, which has a substantial impact on cervical tumour temperatures achieved during hyperthermia. A higher muscle conductivity value surrounding the tumour leads to higher power dissipation in the muscle, and therefore lower tumour temperatures. This effect can be observed when the treatment is performed using the optimised antenna settings for a literature-based dielectric model, as well as for the case where the treatment is optimised based on the EPT values. For four patients the difference between the optimal tumour T90 and realised with EPT values (II→II) was less than 0.6 °C; for one patient it was 1.5 °C. A large bladder volume also leads to a lower tumour SAR and T90; therefore, an empty bladder is beneficial for treatment of cervical tumours. Application of amplitude/phase settings optimised for the literature-based model lead in most cases to treatment-limiting hotspots, confirming the necessity for optimisation based on correct input data.
Disclosure statement
This study was supported by grant UVA 2010-4660 of the Dutch Cancer Society. The authors alone are responsible for the content and writing of the paper.
References
- Overgaard J, Gonzalez Gonzalez D, Hulshof MC, Arcangeli G, Dahl O, Mella O, et al. Randomised trial of hyperthermia as adjuvant to radiotherapy for recurrent or metastatic malignant melanoma. European Society for Hyperthermic Oncology. Lancet 1995;345(8949):540–3.
- van der Zee J, González González D, van Rhoon GC, van Dijk JD, van Putten WL, Hart AA. Comparison of radiotherapy alone with radiotherapy plus hyperthermia in locally advanced pelvic tumours: A prospective, randomised, multicentre trial. Dutch Deep Hyperthermia Group. Lancet 2000;355(9210):1119–25.
- Issels RD, Lindner LH, Verweij J, Wust P, Reichardt P, Schem B-C, et al. Neo-adjuvant chemotherapy alone or with regional hyperthermia for localised high-risk soft-tissue sarcoma: A randomised phase 3 multicentre study. Lancet Oncol 2010;11:561–70.
- Gabriel S, Lau RW, Gabriel C. The dielectric properties of biological tissues. II: Measurements in the frequency range 10 Hz to 20 GHz. Phys Med Biol 1996;41:2251–69.
- Gabriel C. Compilation of the dielectric properties of body tissues at rf and microwave frequencies. Brooks Air Force Tech Rep 1996;AL/OE-TR:0037.
- Gabriel C, Gabriel S, Corthout E. The dielectric properties of biological tissues: I. Literature survey. Phys Med Biol 1996;41:2231–49.
- O’Rourke AP, Lazebnik M, Bertram JM, Converse MC, Hagness SC, Webster JG, et al. Dielectric properties of human normal, malignant and cirrhotic liver tissue: In vivo and ex vivo measurements from 0.5 to 20 GHz using a precision open-ended coaxial probe. Phys Med Biol 2007;52:4707–19.
- Van De Kamer JB, Van Wieringen N, De Leeuw a a C, Lagendijk JJW. The significance of accurate dielectric tissue data for hyperthermia. Int J Hyperthermia 2001;17:123–42.
- de Greef M, Kok HP, Correia D, Borsboom P-P, Bel A, Crezee J. Uncertainty in hyperthermia treatment planning: The need for robust system design. Phys Med Biol 2011;56:3233–50.
- Canters RAM, Paulides MM, Franckena M, Mens JW, van Rhoon GC. Benefit of replacing the Sigma-60 by the Sigma-Eye applicator. A Monte Carlo-based uncertainty analysis. Strahlenther Onkol 2013;189:74–80.
- Christ A, Gosselin M-C, Christopoulou M, Kühn S, Kuster N. Age-dependent tissue-specific exposure of cell phone users. Phys Med Biol 2010;55:1767–83.
- Murbach M, Neufeld E, Kainz W, Pruessmann KP, Kuster N. Whole-body and local RF absorption in human models as a function of anatomy and position within 1.5 T MR body coil. Magn Reson Med 2013;845:839–45.
- Kwon OI, Chauhan M, Kim HJ, Jeong WC, Wi H, Oh TI, et al. Fast conductivity imaging in magnetic resonance electrical impedance tomography (MREIT) for RF ablation monitoring. Int J Hyperthermia 2014;30:447–55.
- Fu F, Xin SX, Chen W. Temperature- and frequency-dependent dielectric properties of biological tissues within the temperature and frequency ranges typically used for magnetic resonance imaging-guided focused ultrasound surgery. Int J Hyperthermia 2014;30:56–65.
- Farace P, Pontalti R, Cristoforetti L, Antolini R, Scarpa M. An automated method for mapping human tissue permittivities by MRI in hyperthermia treatment planning. Phys Med Biol 1997;42:2159–74.
- Mazzurana M, Sandrini L, Vaccari A, Malacarne C, Cristoforetti L, Pontalti R. A semi-automatic method for developing an anthropomorphic numerical model of dielectric anatomy by MRI. Phys Med Biol 2003;48:3157–70.
- Pethig R. Dielectric properties of biological materials: biophysical and medical applications. IEEE Trans Electr Insul 1984;EI-19:453–74.
- Haacke EM, Petropoulos LS, Nilges EW, Wu DH. Extraction of conductivity and permittivity using magnetic resonance imaging. Phys Med Biol 1991;36:713–34.
- Katscher U, Voigt T, Findeklee C, Vernickel P, Nehrke K, Dössel O. Determination of electric conductivity and local SAR via B1 mapping. IEEE Trans Med Imaging 2009;28:1365–74.
- Liu J, Zhang X, Schmitter S, Van de Moortele P-F, He B. Gradient-based electrical properties tomography (gEPT): A robust method for mapping electrical properties of biological tissues in vivo using magnetic resonance imaging. Magn Reson Med 2015;74:634–46.
- van Lier AL, Raaijmakers A, Voigt T, Lagendijk JJ, Luijten PR, Katscher U, van den Berg CA. Electrical properties tomography in the human brain at 1.5, 3, and 7 T: A comparison study. Magn Reson Med 2014;71:354–63.
- Balidemaj E, Van Lier ALHMW, Crezee H, Nederveen AJ, Stalpers LJA, Van Den Berg CAT. Feasibility of electric property tomography of pelvic tumors at 3 T. Magn Reson Med 2014;73:1505–13.
- Lin JC. Advances in electromagnetic fields in living systems. Vol. 4. New York, NY: Springer; 2005.
- Joines WT, Zhang Y, Li C JR. The measured electrical properties of normal and malignant human tissues from 50 to 900 MHz. Med Phys Phys 1994;21:547–50.
- Surowiec AJ, Stuchly SS, Barr JB, Swarup A. Dielectric properties of breast carcinoma and the surrounding tissues. IEEE Trans Biomed Eng 1988;35:257–63.
- Stauffer PR, Rossetto F, Prakash M, Neuman DG, Lee T. Phantom and animal tissues for modelling the electrical properties of human liver. Int J Hyperthermia 2003;19:89–101.
- Haemmerich D, Staelin ST, Tsai JZ, Tungjitkusolmun S, Mahvi DM, Webster JG. In vivo electrical conductivity of hepatic tumours. Physiol Meas 2003;24:251–60.
- Keshtkar A, Salehnia Z, Keshtkar A, Shokouhi B. Bladder cancer detection using electrical impedance technique (Tabriz Mark 1). Patholog Res Int 2012;470101.
- Lu Y, Li B, Xu J, Yu J. Dielectric properties of human glioma and surrounding tissue. Int J Hyperthermia 1992;8:755–60.
- Peyman A, Gabriel C. Dielectric properties of porcine glands, gonads and body fluids. Phys Med Biol 2012;57:N339–44.
- Yuan Y, Cheng K-S, Craciunescu OI, Stauffer PR, Maccarini PF, Arunachalam K, et al. Utility of treatment planning for thermochemotherapy treatment of nonmuscle invasive bladder carcinoma. Med Phys 2012;39:1170–81.
- Balidemaj E., de Boer P., van Lier ALHMW., Remis RF., Stalpers LJA., Westerveld GH., Nederveen AJ, van den Berg CAT and Crezee J In vivo electric conductivity of cervical cancer patients based on maps at 3T MRI. Physics in Medicine and Biology 2016;61:1596-1607.
- Hornsleth S, Mella O, Dahl O. A new segmentation algorithm for finite difference based treatment planning systems. Hyperthermic Oncol 1996;2:521–3.
- James BJ, Sullivan DM. Direct use of CT scans for hyperthermia treatment planning. IEEE Trans Biomed Eng 1992;39:845–51.
- Taflove A, Hagness SC. Computational electrodynamics: The finite-difference time-domain method. 2nd ed. Norwood (MA): Artech; 2000.
- van Dijk JDP, Schneider CJ, van Os R, Blank LECM, Gonzalez DG. Results of deep body hyperthermia with large waveguide radiators. Adv Exp Med Biol 1990;267:315–19.
- Crezee J, Van Haaren PM, Westendorp H, De Greef M, Kok HP, Wiersma J, et al. Improving locoregional hyperthermia delivery using the 3-D controlled AMC-8 phased array hyperthermia system: a preclinical study. Int J Hyperthermia 2009;25:581–92.
- Das SK, Clegg ST, Samulski TV. Computational techniques for fast hyperthermia temperature optimization. Med Phys 1999;26:319–28.
- Tsuda N, Kuroda K, Suzuki Y. An inverse method to optimize heating conditions in RF-capacitive hyperthermia. IEEE Trans Biomed Eng 1996;43:1029–37.
- Kok HP, Van Haaren PM, Van de Kamer JB, Wiersma J, Van Dijk JDP, Crezee J. High-resolution temperature-based optimization for hyperthermia treatment planning. Phys Med Biol 2005;50:3127–41.
- Pennes H. Analysis of tissue and arterial blood temperatures in the resting human forearm. J Appl Physiol 1948;1:93–122.
- Hasgall P, Di Gennaro F, Baumgartner C, Neufeld E, Gosselin M, Payne D, et al. IT’IS database for thermal and electromagnetic parameters of biological tissues, Version 2.6, January 13th, 2015. Available at www.itis.ethz.ch/database
- ESHO Taskgroup Committee 1992 Treatment planning and modelling in hyperthermia Task Group Report of the European Society for Hyperthermic Oncology. Rome (Italy): Tor Vergata; 1992.
- Kok HP, de Greef M, Wiersma J, Bel A, Crezee J. The impact of the waveguide aperture size of the 3D 70 MHz AMC-8 locoregional hyperthermia system on tumour coverage. Phys Med Biol 2010;55:4899–916.
- Lawrence C, Zhou JL, Tits AL. User’s guide for CFSQP version 2.5: A C code for solving (large scale) constrained nonlinear (minimax) optimization problems, generating iterates satisfying all inequality constraints. College Park (MD): Electrical Engineering Department and Institute for Systems Research University of Maryland; 1999, pp 1–73.
- van Lier ALHMW, Brunner DO, Pruessmann KP, Klomp DWJ, Luijten PR, Lagendijk JJW, et al. B1(+) phase mapping at 7 T and its application for in vivo electrical conductivity mapping. Magn Reson Med 2012;67:552–61.
- Voigt T, Katscher U, Doessel O. Quantitative conductivity and permittivity imaging of the human brain using electric properties tomography. Magn Reson Med 2011;66:456–66.
- Andreuccetti D, Fossi R, Petrucci C. An Internet resource for the calculation of the dielectric properties of body tissues in the frequency range 10 Hz–100 GHz. Florence (Italy): IFAC-CNR; 1997. Available at http://niremf.ifac.cnr.it/tissprop/.
- Kavukcu S, Turkmen M, Faculty M. Could conductivity be used as a parameter in grinalaysis? J Pakistan Med Assoc 1998;48:238–40.
- Fazil Marickar YM. Electrical conductivity and total dissolved solids in urine. Urol Res 2010;38:233–5.
- Grimmes S, Martinsen OG. Bioimpedance and bioelectricity basics. Amsterdam: Elsevier; 2008.
- Schooneveldt G, Kok HP, Geijsen ED, van Ommen F, Bakker A, de La Rosette JJMCH, et al. Improved temperature monitoring and treatment planning for loco-regional hyperthermia treatments of non-muscle invasive bladder cancer (NMIBC). Proc World Congr Med Phys Biomed Eng 2015;51:1691–4.
- Schwan HP, Piersol GM. The absorption of electromagnetic energy in body tissues, Part I. J Phys Med 1954;33:371–404.
- Andreasen D, Van Leemput K, Hansen RH, Andersen JA, Edmund JM. Patch-based generation of a pseudo CT from conventional MRI sequences for MRI-only radiotherapy of the brain. Med Phys 2015;42:1596–605.
- Edmund JM, Kjer HM, Van Leemput K, Hansen RH, Andersen J Al, Andreasen D. A voxel-based investigation for MRI-only radiotherapy of the brain using ultra short echo times. Phys Med Biol 2014;59:7501–19.
- Lambert J, Greer PB, Menk F, Patterson J, Parker J, Dahl K, et al. MRI-guided prostate radiation therapy planning: Investigation of dosimetric accuracy of MRI-based dose planning. Radiother Oncol 2011;98:330–4.
- Restivo MC, van den Berg CA, van Lier AL, Polders DL, Raaijmakers AJ, Luijten PR, Hoogdui H. Local specific absorption rate in brain tumors at 7 Tesla. Magn Reson Med 2015. PMID 25752920.
- Schmid G, Neubauer G, Illievich UM, Alesch F. Dielectric properties of porcine brain tissue in the transition from life to death at requencies from 800 to 1900 MHz. Bioelectromagnetics 2003;24:413–22.
- Kraszewski A, Stuchly MA, Stuchly SS, Smith A. In vivo and in vtiro dielectric properties of animal tissues at radio frequencies. Bioelectromagnetics 1982;3:421–32.
- Komarov V, Wang S, Tang J. “Permittivity and Measurements” in Encyclopedia of RF and Microwave Engineering. K. Chang (ed.), Hoboken, NJ: Wiley, 2005, pp.19.
- Dillon CR, Payne A, Christensen DA, Roemer RB. The accuracy and precision of two non-invasive, magnetic resonance-guided focused ultrasound-based thermal diffusivity estimation methods. Int J Hyperthermia 2014;30:362–71.
- Fujita S, Tamazawa M, Kuroda K. Effects of blood perfusion rate on the optimization of RF-capacitive hyperthermia. IEEE Trans Biomed Eng 1998;45:1182–6.
- Seebass M, Beck R, Gellermann J, Nadobny J. Electromagnetic phased arrays for regional hyperthermia: Optimal frequency and antenna arrangement. Int J Hyperthermia 2001;17:321–36.
- Gellermann J, Göke J, Figiel R, Weihrauch M, Cho CH, Budach V, et al. Simulation of different applicator positions for treatment of a presacral tumour. Int J Hyperthermia 2007;23:37–47.
- Canters RA, Franckena M, Paulides MM, Van Rhoon GC. Patient positioning in deep hyperthermia: Influences of inaccuracies, signal correction possibilities and optimization potential. Phys Med Biol 2009;54:3923–36.
- De Greef M, Kok HP, Bel A, Crezee J. 3D versus 2D steering in patient anatomies: A comparison using hyperthermia treatment planning. Int J Hyperthermia 2011;27:74–85.
- Bakker JF, Paulides MM, Christ A, Kuster N, van Rhoon GC. Assessment of induced SAR in children exposed to electromagnetic plane waves between 10 MHz and 5.6 GHz. Phys Med Biol 2011;55:3115–30.
- Verhaart R, Fortunati V, Verduijn GM, van Walsum T, Veenland JF, Paulides MM. CT-based patient modeling for head and neck hyperthermia treatment planning: Manual versus automatic normal-tissue-segmentation. Radiother Oncol 2014;111:158–63.
- Van den Berg C a T, Van de Kamer JB, De Leeuw A a C, Jeukens CRLPN, Raaymakers BW, van Vulpen M, et al. Towards patient specific thermal modelling of the prostate. Phys Med Biol 2006;51:809–25.
- Inman BA, Stauffer PR, Craciunescu OA, Maccarini PF, Dewhirst MW, Vujaskovic Z. A pilot clinical trial of intravesical mitomycin-C and external deep pelvic hyperthermia for non-muscle invasive bladder cancer. Int J Hyperthermia 2014;30:171–5.
- Geijsen ED, de Reijke TM, Koning CC, Zum Vörde Sive Vörding PJ, de la Rosette JJ, Rasch CR, et al. Combining mitomycin C and regional 70 MHz hyperthermia in patients with non-muscle invasive bladder cancer: a pilot study. J Urol 2015:1202–8.
- Juang T, Stauffer PR, Craciunescu OA, Maccarini PF, Yuan Y, Das SK, et al. Thermal dosimetry characteristics of deep regional heating of non-muscle invasive bladder cancer. Int J Hyperthermia 2014;30:176–83.