
Abstract
Purpose: The aim was to study by computer simulations the insulating role of the reactive zone surrounding a cortical osteoid osteoma (OO) in terms of electrical and thermal performance during radiofrequency ablation (RFA). Material and methods: We modelled a cortical OO consisting of a nidus (10 mm diameter) enclosed by a reactive zone. The OO was near a layer of cortical bone 1.5 mm thick. Trabecular bone partially surrounds the OO and there was muscle around the cortical bone layer. We modelled RF ablations with a non-cooled-tip 17-gauge needle electrode (300 s duration and 90 °C target temperature). Sensitivity analyses were conducted assuming a reactive zone electrical conductivity value (σrz) within the limits of the cortical and trabecular bone, i.e. 0.02 S/m and 0.087 S/m, respectively. In this way we were really modelling the different degrees of osteosclerosis associated with the reactive zone. Results: The presence of the reactive zone drastically reduced the maximum temperature reached outside it. The temperature drop was proportional to the thickness of the reactive zone: from 68 °C when it was absent to 44 °C when it is 7.5 mm thick. Higher nidus conductivity values (σn) implied higher temperatures, while lower temperatures meant higher σrz values. Changing σrz from 0.02 S/m to 0.087 S/m reduced lesion diameters from 2.4 cm to 1.8 cm. Conclusions: The computer results suggest that the reactive zone plays the role of insulator in terms of reducing the temperature in the surrounding area.
Introduction
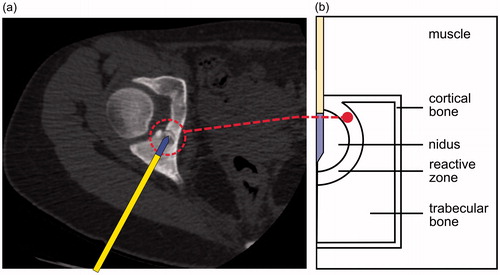
Osteoid osteoma (OO) is a common bone tumour, representing approximately 10% of all benign skeletal lesions, that involves progressively worsening pain [Citation1]. Although OO is benign and spontaneous remission occasionally occurs, an intervention for definitive relief of pain is sometimes required [Citation2]. Among other techniques [Citation3], radiofrequency ablation (RFA) is a minimally invasive technique which allows thermal destruction of the OO [Citation4–6]. The most common location of OO is in the long bones [Citation5]. Most OOs are cortical and macroscopically consist of a nidus of active bone surrounded by a reactive zone. The nidus, usually 5–10 mm in diameter [Citation2], is the actual tumour, and hence the target of the RFA. The reactive zone of a cortical OO is partially surrounded by the cortex (cortical bone) while the rest is enclosed by trabecular bone (). It has been suggested that the presence of cortical bone during RFA could play the role of a thermal insulator and hence grant protection to the adjacent soft tissues [Citation7–9]. We have already observed this performance in a previous modelling study [Citation10], which could be explained by the lower electrical conductivity of the cortical bone than the surrounding tissues.
Figure 1. (a) Cortical osteoid osteoma consisting of a nidus surrounded by cortical and trabecular bone. The RF applicator is introduced into the nidus through a drill hole prior to RF application. (b) Theoretical model of cortical OO consisting of a nidus enclosed by a reactive zone.
The reactive zone is histologically characterised by very dense reactive sclerotic bone [Citation1] and can in fact be radiographically observed as a cortical thickening. For these reasons, and even though there are no experimental data available on electrical and thermal characteristics of the reactive zone, one could assume that its characteristics could somehow be similar to those of cortical bone. With all these issues in mind, we hypothesised that the reactive zone could also play an important role as thermal insulation during RFA of a cortical OO. As a detailed assessment of this issue has not been carried out to date, our aim was to build computer models to study the temperature distributions during RFA in the tissues involved in a cortical OO, with a special focus on assessing the possible insulating effect of the reactive zone and identifying the factors involved. Computer modelling technique is a methodological approach broadly employed to study the impact of factors on temperature distributions during RF heating of biological tissues [Citation11].
Materials and methods
Physical situation
We considered a spherical nidus surrounded by a reactive zone, more or less next to the cortex of a long bone. Access to the OO to conduct an ablation is not a straightforward task. Firstly, a biopsy trochar is advanced under image guidance to the cortex (cortical layer). Then the cortex is drilled to within 1 mm or less of the tumour [Citation6]. The RF applicator, which includes a metallic electrode on its distal part, is introduced into the nidus through the drill hole [Citation12] (). The result of this approach is a physical arrangement as sketched in , in which the RF applicator passes through the cortical bone, and is exactly the physical situation modelled in this study. We considered a non-cooled tip needle-like electrode with 17-gauge diameter and a 5 mm exposed tip (including a sharp zone 1 mm long).
Geometry of the model
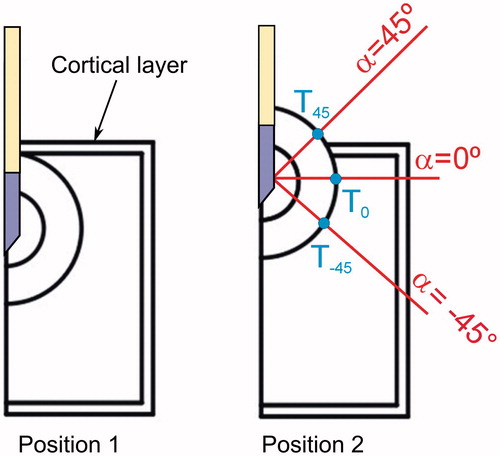
shows the geometry of the cortical OO model, consisting of a nidus (10 mm diameter) enclosed by a reactive zone of variable thickness (2.5, 5.0 and 7.5 mm). We considered two relative positions of the OO and the cortical bone layer, as shown in (Positions 1 and 2). Both positions are relevant because they represent the two limits between which the cortical OO can be located in relation to the cortical bone layer, which was assumed to be 1.5 mm thick. Position 2 represents a case in which the presence of the OO has caused a periosteal reaction, i.e. an elevation of the periosteum from the cortex [Citation13]. The model includes muscle beyond this layer. Likewise, we defined three relevant directions in which temperature profiles were computed: −45°, 0° and 45° (all with the origin at the midpoint of the electrode surface). In this way three points (T45, T0 and T−45) were defined to assess the temperature beyond the reactive zone and composed the intersection points between these directions and the outer layer of the reactive zone.
Figure 2. Relative positions of the OO and the cortical bone layer. We defined three directions in which temperature profiles were computed: −45°, 0° and 45° (origin at the midpoint of the electrode surface). Note that in Position 2, the 45° direction, has muscle tissue outside the reactive zone, while 0° and −45° have trabecular muscle. The intersection points between these directions and the outer layer of the reactive zone defined three locations at which the temperature was assessed (T45, T0 and T−45).
Governing equations, numerical method and boundary conditions
The model was based on a coupled electric-thermal problem in which the governing equation for the thermal problem was the bioheat equation, which was modified by the enthalpy method to take into account the vaporisation phenomenon in the tissues [Citation14]:
(1)
where ρ is tissue density, h enthalpy, k thermal conductivity, T temperature and t time. qRF refers to the heat source from RF power, Qp refers to the blood perfusion heat and Qmet refers to the metabolic heat, which is negligible in RFA. For biological tissues enthalpy is related to tissue temperature by the following expression [Citation14].
(2)
where ρi and ci are density and specific heat of tissue respectively at temperatures below 100 °C (i = l) and at temperatures above 100 °C (i = g), hfg is the product of water latent heat of vaporisation and water density at 100 °C, and C is tissue water content inside the tissue. The blood perfusion heat Qp is computed from:
(3)
where ρb is the density of blood, cb specific heat of blood, Tb blood temperature (37 °C), ωi perfusion coefficient of the tissue i, and β is a coefficient which took the values of 0 and 1, according to the value of the temperature reached: β = 0 for T ≥ 50 °C, and β = 1 for T < 50 °C. Although some models included a slight increase in blood perfusion flow with initial temperature elevation [Citation15], it has been demonstrated that the most important effect is the ceasing/decreasing due to the thermal coagulation.
The heat source qRF is the distributed heat source due to the Joule effect (loss) which is given by:
(4)
where σ (S/m) is electrical conductivity at 500 kHz, and |E| the magnitude of the vector electric field (V/m), which is given by E = −∇V. The electrical problem is governed by the following equation:
(5)
At RF frequencies (≈500 kHz) and over the distance of interest, the biological medium can be considered almost totally resistive and a quasi-static approach is therefore possible to solve the electrical problem [Citation16].
The coupled electrical-thermal problem was numerically solved using COMSOL Multiphysics (Comsol, Burlington, MA, USA). We performed convergence tests to determine the adequate size of domain limits, and spatial and temporal resolution. Spatial resolution was achieved by refining the mesh so that the maximum temperature reached in the tissue after 300 s (Tmax) was within 0.5% of the value obtained from the previous refinement step. When an adequate spatial resolution was achieved, we decreased the time step until Tmax was within 0.5% of the value obtained from the previous time step.
There are several protocols for delivering electrical power in RFA of OO. In general, a constant temperature mode is clinically used with a target temperature of 90 °C and duration ranging from 240 s [Citation4,Citation17–19] to 360 s [Citation20]. We considered this same mode with a target temperature of 90 °C and duration of 300 s. To implement the constant temperature mode we used the same approach as in Haemmerich and Webster [Citation21], in which the authors considered a dynamic system for control purposes. The input variable of the system was the voltage applied to the electrode (Ve) and the output variable was the temperature measured at the tip of the electrode (Te). There are different ways of controlling tip temperature, such as a proportional–integral–derivative (PID) controller, adaptive, neural network prediction, and fuzzy logic control [Citation21]. We considered a proportional–integral (PI) defined by the parameters Kp and Ki, with values of 1.15 and 0.06, respectively.
Electrical boundary conditions were zero current density at the axis, zero voltage at the lower limit (to mimic the dispersive electrode) and voltage at the active electrode. Initial temperature and the temperature for the surfaces away from the active electrode were assumed to be 37 °C.
Physical characteristics of the model
shows the values of the physical characteristics of the materials used in the model [Citation22,Citation23]. The thermal conductivity and specific heat of cortical bone and muscle were taken from a previous sensitivity analysis [Citation10]. A change in σ with temperature was considered +1.5%/°C (with an abrupt drop when temperature reaches 100 °C) and also a change in k with temperature of +0.003 K−1 (with a constant value above 100 °C) for the tissues [Citation24]. The internal tissue water content, C in equation (Equation2(2) ), was assumed to be 68% [Citation25].
Table 1. Physical properties of the materials used in the model.
As far as we can ascertain, there are no data available on the electrical and thermal characteristics of the nidus and the reactive zone. Most of the physical data on tumour tissue is taken from human and animal models of breast carcinoma [Citation26–28]. In this study, electrical conductivity (σ) of both tissues was considered to be within reasonable ranges, and computer simulations were conducted to assess the sensitivity of each parameter. To be more precise, since the nidus is composed of vascularised connective tissue [Citation29], we assumed that its electric conductivity (σn) would not be very different from that measured in human breast carcinoma (within 0.08 S/m and 0.5 S/m [Citation28]). We considered σn values of 0.08, 0.22, 0.36 and 0.50 S/m.
The reactive zone corresponds histologically with a very dense reactive sclerotic bone [Citation1], so that we can assume a value of σrz within these limits coinciding with the σ of cortical and trabecular bone, i.e. 0.02 S/m and 0.087 S/m, respectively. In this way we are really modelling the different degrees of osteosclerosis associated with the reactive zone. We considered 0.02, 0.042, 0.065 and 0.087 S/m as σrz values. The thermal characteristics of the reactive zone were assumed to be identical to those of cortical bone. Rossmanna and Haemmerich [Citation26] reviewed the thermal properties of adenocarcinoma in the human breast and we took these values for the specific heat and the thermal conductivity of the nidus.
The indicator for heat-sink strength by blood perfusion is the blood perfusion rate (m), usually expressed in mL/min/100 g [Citation30]. In order to consider this parameter in equation (Equation3(3) ), the perfusion coefficient (ωi) must be computed. The perfusion coefficient of the tissue i is related to mi as follows: ωi = mi ρi 10−5/60. For instance, the mean value for trabecular bone in humans is m = 1 mL/min/100 g [Citation30] which corresponds to a ωi value of approximately 1.967 × 10⁻⁴ s−1. In a study by Mcintosh and Anderson [Citation30] the authors reported a perfusion coefficient of zero for cortical bone, while in a study by Hasgall et al. [Citation22] a mean value of 3.18 × 10⁻⁴ s−1 was reported. Due to the lack of data on perfusion in the reactive zone, and in accordance with the histological criterion mentioned above, we assumed a range of values of ωi within these limits, coinciding with cortical and trabecular bone, i.e. 1.967 × 10⁻⁴, 3.933 × 10⁻⁴ and 5.9 × 10⁻⁴ s−1 (see ). In contrast, since the nidus is a well-vascularised tissue [Citation29], we assumed values between 26 × 10−4 s−1 and 70 × 10−4 s−1, which are the minimum and maximum values measured by Song et al. [Citation31]. The following values were thus considered: 26 × 10−4, 41 × 10−4, 55 × 10−4 and 70 × 10−4 s−1.
Outcomes
The only target of the RFA is the nidus and not the surrounding tissue. The situation is not critical if the adjacent tissue is reactive bone. On the other hand, when there is not a sufficient degree of sclerosis, soft tissues such as vessels and nerves can suffer thermal injury. For this reason, and also to broadly assess the insulating role of the reactive zone, we studied the maximum temperature reached at the outer boundary of the reactive zone, and in particular, in two very dissimilar areas: muscle (45° direction, see ) and trabecular bone (directions 0° and −45°, see ). We also studied other variables involved in RFA, such as impedance and the distributed heat source (qRF), which could provide a physical explanation of the computer results. The 50 °C isotherm was used to represent the thermal lesion contour.
Results
The appropriate size of the model domain limits was a width of 21.5 mm and a height of 33 mm. The models had around 8000 triangular elements and a time step of 0.01 s was used for each simulation.
Effect of perfusion coefficient and electrical conductivity
In the first set of simulations we considered an OO in Position 2 with a reactive zone 5 mm thick. We analysed the maximum temperatures reached at the outer boundary of the reactive zone, in particular at the interface with the trabecular bone (T0) and muscle (T45). In these simulations a sensitivity analysis was conducted by simultaneously varying the electrical conductivity and perfusion coefficient of the nidus and reactive zone. As shown in , temperatures at the reactive zone−trabecular bone (T0) were slightly higher (around 1–2 °C) than at the interface reactive zone-muscle (T45). Overall, the perfusion coefficients of nidus and reactive zone did not appear to have an influence on the temperatures reached at the outer limit of the reactive zone ().
Figure 3. Maximum temperatures reached after 300 s of RFA at the outer limit of the reactive zone, in particular in the interface with trabecular bone (T0) and with muscle (T45) for different values of perfusion coefficient of nidus (ωn) and reactive zone (ωrz) (a, b), and of electrical conductivity of nidus (σn) and reactive zone (σrz) (c, d). A total of 64 simulations were conducted for each specific value of one of these parameters, varying the other three parameters (four values within a range). We then calculated and plotted the mean value of the 64 simulations. The maximum value of the difference with respect to the mean value was also plotted as a dispersion bar. These simulations were conducted with the OO in Position 2 (see ).
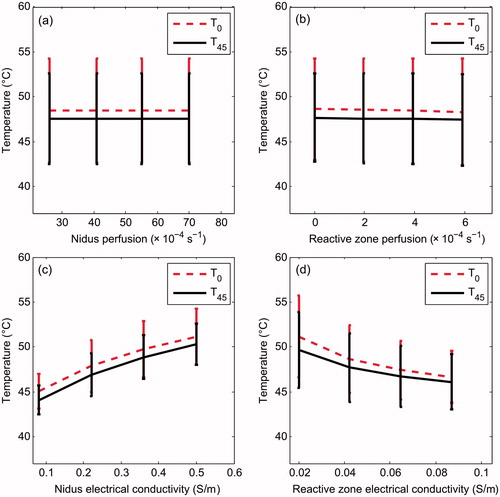
In contrast, the effect of σn and σrz was important, and surprisingly, was the opposite in each, i.e. while an increase in σn involved an increase in both T0 and T45, an increase in σrz involved a decrease. Both T0 and T45 varied by around 5 °C when σn and σrz were varied. Once more, temperatures at the outer layer of the reactive zone on the trabecular bone side (T0) were 1–2 °C higher than on the muscle side (T45).
In order to check that the behaviour shown in is not due to the entire parameter being changed simultaneously, in we plotted the change of temperature profile along the 0° direction with the change in σrz (keeping σn constant with a mean value of 0.29 S/m) and with the change in σn (for a mean value of σrz of 0.0535 S/m). confirms that for higher values of σn, temperatures at the end of the RFA are higher. In contrast, temperatures at the end of the RFA are lower for higher values of σrz. In terms of thermal lesion, a change in σrz from 0.02 S/m (reactive zone with high degree of osteosclerosis) to 0.087 S/m (reactive zone with characteristics very similar to trabecular bone) reduces lesion diameter from 24 mm to 18 mm. Although the effect of changing σn is the opposite, it is more or less similar in absolute values of change in the lesion diameter.
Figure 4. Temperature profiles (at 300 s) computed in the 0° direction (see ) for different electrical conductivity values of the reactive zone (a) and nidus (b). The 50 °C line represents the thermal lesion contour. These simulations were conducted with the OO in Position 2 (see ).
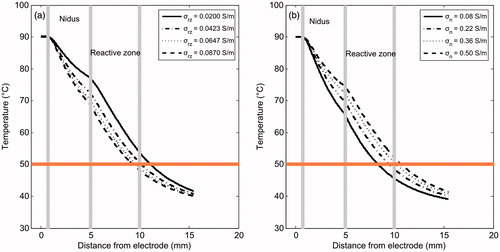
also shows that in general the temperature drop with distance inside the reactive zone is steeper than in the nidus zone, which suggests that the presence of the reactive zone somehow limits the lesion volume (this issue is analysed below).
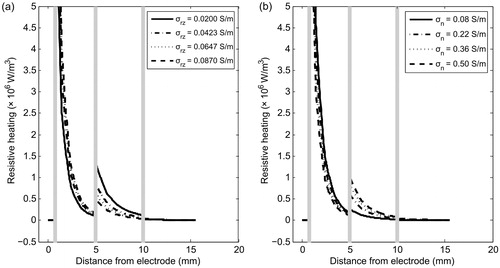
To determine the reasons for the different behaviour of the nidus and reactive zone in terms of electrical conductivity, we analysed the spatial distribution of the resistive heating qRF at end of ablation (300 s). shows qRF distribution of the tissues involved for different values of σn and σrz. As can be expected, qRF drops drastically around the electrode. The differences of qRF in the nidus when σn and σrz vary do not seem to be relevant; however, there are interesting differences in the reactive zone. The differences shown in are in agreement with the temperature profiles seen in . An increase in σrz implies a decrease in qRF (and consequently in temperature). The differences in are rather more subtle and cannot be explained so easily.
Figure 5. Distributed heat source qRF due to RF power in the involved tissues for different values of electrical conductivity of reactive zone σrz (a) and nidus σn (b). These simulations were conducted with the OO in Position 2 (see ).
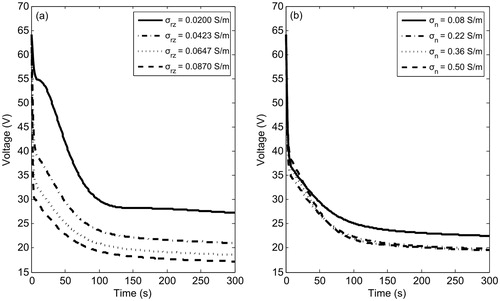
shows the progress of the applied voltage throughout RFA for different values of σn and σrz. Note that the change of σrz causes larger changes in the applied voltage than changes of σn. In general, an increase in the electrical conductivity implies a decrease in the applied voltage.
Figure 6. Progress of the applied voltage throughout RF ablation for different values of electrical conductivity of the reactive zone σrz (a) and nidus σn (b). These simulations were conducted with the OO in Position 2 (see ).
Effect of reactive zone (RZ) thickness
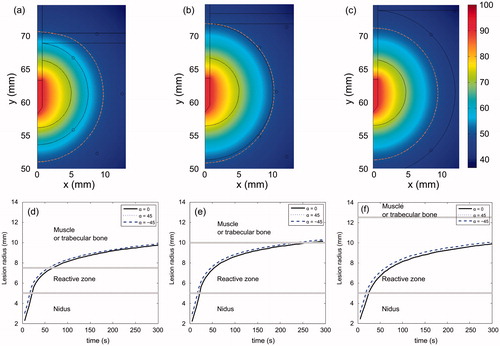
shows the temperature distributions at the end of RFA and the thermal lesion contour evolution for different RZ thicknesses. These simulations were conducted with OO in Position 1 (see ). The results show that RZ thickness has little effect on the temperature distributions across the mathematical domain, regardless of tissue type. Obviously, the thinner the reactive zone, the faster the thermal lesion contour reaches the area beyond it. Also, the thermal lesion enlarges almost homogeneously, i.e. growth is identical regardless of direction (α).
Figure 7. Temperature distributions (in °C) after 300 s of RFA for three RZ thicknesses: 2.5 mm (a), 5.0 mm (b) and 7.5 mm (c). Dashed line is the 50 °C isoline which represents thermal lesion contour. Progress of the thermal lesion radius throughout 300 s of RFA at the outer limit of the reactive zone for three RZ thicknesses: 2.5 mm (d), 5.0 mm (e) and 7.5 mm (f), and for three directions (α = 0, 45° and −45°). These simulations were conducted with the OO in Position 1 (see ).
and show the electrical impedance (Ω) recorded at the start of RFA for different RZ thicknesses and electrical conductivity (σrz). Note that the effect of RZ thickness is especially important when σrz is very low, which is found when there is a high degree of osteosclerosis (reactive zone with characteristics similar to cortical bone). For medium and high σrz values, the thickness has very little effect on impedance. shows the electrical impedance for different RZ thickness and electrical conductivity in the nidus (σn).
Figure 8. Effect of electrical conductivity of nidus (σn) and reactive zone (σrz) on electrical impedance (Ω) registered at the start of RFA. The effect of RZ thickness and OO position are also considered. Black and red colours correspond with Positions 1 and 2, respectively. Trend lines have been added as a guide.
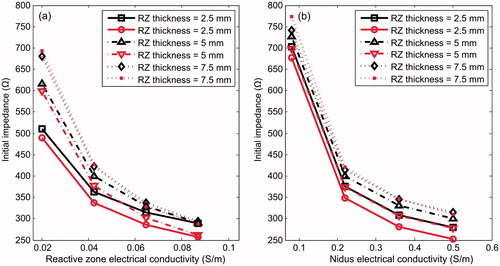
Table 2. Electrical impedance (Ω) at the start of RFA for different RZ thickness and electrical conductivity (σrz).
Table 3. Electrical impedance (Ω) at the start of RFA for different RZ thickness and electrical conductivity of the nidus (σn).
Effect of presence of the reactive zone
Although a marked reactive sclerosis is commonly found around the nidus, some lesions may have little or no reactive sclerosis [Citation33], which led us to conduct computer simulations without a reactive zone, considering the mean values of σn and σrz (0.29 and 0.0535 S/m, respectively). shows the temperature profiles at the end of RFA for different RZ thicknesses and with no RZ. In the latter case, since we were modelling Position 1, the nidus is in direct contact with the trabecular bone. Note that the case with no RZ in Position 2 is fictitious, since a bone layer has to necessarily surround the nidus.
Figure 9. Temperature profiles (at 300 s) computed in 0° direction (see ) for different RZ thicknesses. The case without a reactive zone is also plotted (solid line). The 50 °C line represents the thermal lesion contour. All simulations were conducted with OO in Position 1 (see ).
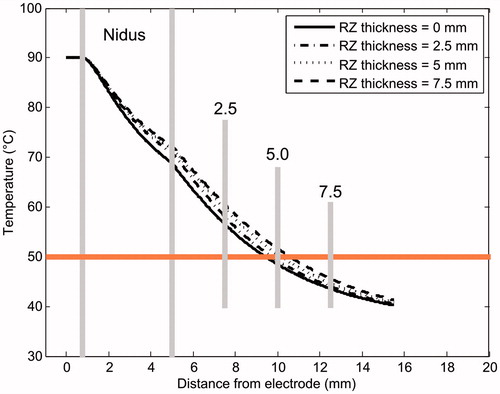
suggests that the presence of a reactive zone drastically reduces the maximum temperature reached in the trabecular bone. The drop in the maximum temperature is proportional to RZ thickness: from 68 °C when it is absent to 44 °C at a thickness of 7.5 mm. However, surprisingly, the presence of a reactive zone around the nidus involves an augmentation in the temperature profiles (see ). This difference may be up to ≈5 °C between the absence of an RZ and a thickness of 7.5 mm. From this it would seem that the reactive zone does not itself provide an insulating effect.
Initial impedance in the absence of a reactive zone was ≈45 Ω lower than an RZ thickness of 2.5 mm: 656.8 Ω, 330.7 Ω, 265.2 Ω, and 237.1 Ω, for σn of 0.08, 0.22, 0.36 and 0.5 S/m, respectively.
Discussion
We conducted computer simulations aimed at assessing the electrical and thermal performance of the reactive zone during RFA of a cortical OO. In this assessment we assumed that the electrical conductivity of the reactive zone depends on the degree of osteosclerosis of the RZ: from 0.02 S/m for severe osteosclerosis to 0.087 S/m for mild. We also analysed the effect of blood perfusion in the nidus and reactive zone on the temperature reached beyond the RZ. Although tissue perfusion is known to be a crucial parameter in determining lesion size during RFA, we did not find this parameter to have a strong effect on the temperature reached in the RZ outer layer, which could be explained by the relatively narrow range of values considered for nidus perfusion (26−70 × 10−4 s−1).
On the other hand, we did find the effect of the electrical conductivity of the nidus and reactive zone to be considerable. To account for these results, we first considered an analytical model of the distributed heat qRF, which is a key factor in the temperature increase. Although the geometry considered here is too complex to allow an analytical mathematical expression of qRF, it can be assumed that when a voltage constant Ve is applied, qRF is somehow proportional to , and also proportional to the electrical conductivity of the tissue (σ). It is also evident that an increase in σ implies a decrease in the measured electrical impedance (Z). In our study we observed that the change from the minimum to maximum value of either σn or σrz reduced Z by about 50% (see and ).
We can also assume that in order to keep the electrode tip temperature constant, a variation in Z will imply a variation in Ve. The power required to keep the temperature on target is . Hence, a decrease in Z (due to increased σ) should imply a drop in Ve in order to balance the required power (see ). Unlike the relation between σ and Z (which is more or less constant at 50%), the relation between Z and Ve depends on the tissue type, as can be seen in . While an increase in σrz drastically reduces Ve (see ), the change in Ve is minor when σn is changed (see ). This could explain the distribution of qRF in the reactive zone (see ), since an increase in σrz considerably reduces the applied voltage, which implies that
× σrz will be globally reduced in the reactive zone, as shown in . On the other hand, an increase in σn does not seriously reduce Ve (see ), and consequently the product
× σrz will probably be more affected by σrz than Ve, i.e. the increase in σrz could be mainly responsible for the increase in qRF in the reactive zone shown in . This could be the explanation for the higher temperature in the reactive zone when σrz is raised (see ). Additionally, the temperature increase in the reactive zone also induces higher σrz, which further contributes to increasing qRF.
In any case, this explanation is based on the simplification that qRF in each tissue is proportional to × σrz, Ve being the total applied voltage. The real situation of the model is probably more complex in terms of geometry (note that the electrode has a cylindrical central part but a sharp distal part) and the phenomena involved (thermal conduction has been ignored in this theoretical explanation).
The effect of RZ thickness was also analysed. As expected, the results suggest that the thicker the reactive zone, the lower the temperature outside it. In the limiting case of RZ absent, the temperature at the outer limit of the nidus reached 68 °C, as opposed to 44 °C at the outer limit of a 7.5 mm thick RZ. Surprisingly, increasing RZ thickness involved a slight increase in the temperature profiles. This could be explained in the same way as the changes in σrz, i.e. since the increased thickness implies an increase in Z (see ), this could bring about much higher Ve (similar to what happened when reducing σrz, see ), and consequently an increase in qRF in the reactive zone, which would be responsible for the higher temperature observed predominantly in this zone (see ).
In short, the computer results confirm that the presence of a reactive zone minimises the thermal lesion contour in tissues beyond the reactive zone. This is reasonable: the key is to take away the point that must not be thermally damaged. However, what is surprising is the temperature increase at the boundary of the reactive zone, when this zone is less electrically conductive, as the opposite effect could be expected, i.e. more protective effect in a less conductive zone. Besides the possible explanation for this performance given above, we also believe it could be due to the fact that σrz is much smaller than σn. However, we conducted additional computer simulations with similar values for σrz and σn, and the results confirmed the general performance described: in an arrangement with two tissues (internal and external), temperature increases when electrical conductivity of the external tissue is reduced and decreases when electrical conductivity of the internal tissue is reduced.
Although the computer results can be explained thus, we should not forget the physical significance of having reactive zones with different σrz values. If a RZ such as that defined in the theoretical model has a high σrz value, it probably means that its properties are similar to those of trabecular bone, and is therefore a less reactive zone and could possibly be considered as trabecular bone. This could have the following clinical implication: although our results suggest that an increase in σrz implies a decrease in the temperature in the outer reactive zone, i.e. a protective effect, the truth is that the area with a high σrz value represents a zone with a low degree of osteosclerosis and hence should be more thermally protected than another zone with a low σrz value.
The number of experimental studies reporting lesion sizes after RFA of OO that we could find was very limited. Furthermore, there are no experimental studies on the effect of the reactive zone characteristics on the thermal lesion. In spite of this, the computed lesion diameters in this study (1.8–2.4 cm) were in agreement with the value of 1.85 cm reported in [Citation9] for an electrode and ablation protocol similar to our model.
We believe this to be the first computer modelling on RFA in OO. Its main limitation is probably the lack of an accurate experimental validation. Unfortunately, no previous data on temperature mapping around the OO during RFA are available for validation purposes. It also seems somewhat complex to carry out experiments in which the thickness and electrical conductivity of the reactive zone are kept under control. We suggest that future studies could use imaging techniques to accurately assess the geometry of the reactive zone, and even to try to infer its characteristics from the degree of osteosclerosis derived from the images.
Conclusions
The computer results suggest that the reactive zone plays the role of insulator in terms of reducing the temperature beyond it. However, they also showed an unexpected relationship between the electrical conductivity of the reactive zone, which could be related to its degree of osteosclerosis, and the ability to thermally protect the tissues beyond.
Declaration of interest
This work was supported by a grant from the Agencia Nacional de Promoción Científica y Tecnológica de Argentina (Ref. PICT-2012-1201), and by the Spanish Programa Estatal de Investigación, Desarrollo e Innovación Orientada a los Retos de la Sociedad under grant number TEC2014-52383-C3-R (TEC2014-52383-C3-1-R). The authors alone are responsible for the content and writing of the paper.
References
- Allen SD, Saifuddin A. Imaging of intra-articular osteoid osteoma. Clin Radiol 2003;58;11:845–52
- Al-Omari MH, Ata KJ, Al-Muqbel KM, Mohaidat ZM, Haddad WH, Rousan LA. Radiofrequency ablation of osteoid osteoma using tissue impedance as a parameter of osteonecrosis. J Med Imaging Radiat Oncol 2012;56:384–9
- Scott SJ, Salgaonkar V, Prakash P, Burdette EC, Diederich CJ. Interstitial ultrasound ablation of vertebral and paraspinal tumours: Parametric and patient-specific simulations. Int J Hyperthermia 2014;30:228–44
- Martel J, Bueno A, Nieto-Morales ML, Ortiz EJ. Osteoid osteoma of the spine: CT-guided monopolar radiofrequency ablation. Eur J Radiol 2009;71:564–9
- Rimondi E, Mavrogenis AF, Rossi G, Ciminari R, Malaguti C, Tranfaglia C, et al. Radiofrequency ablation for non-spinal osteoid osteomas in 557 patients. Eur Radiol 2012;22:181–8
- Rosenthal D, Callstrom MR. Critical review and state of the art in interventional oncology: Benign and metastatic disease involving bone. Radiology 2012;262:765–80
- Bitsch RG, Rupp R, Bernd L, Ludwig K. Osteoid osteoma in an ex vivo animal model: Temperature changes in surrounding soft tissue during CT-guided radiofrequency ablation. Radiology 2006;238:107–12
- Dupuy SN, Hong DE, Oliver R, Goldberg B. Radiofrequency ablation of spinal tumors: Temperature distribution in the spinal canal. Am J Roentgenol 2000;175:1263–6
- Martel J, Bueno A, Domínguez MP, Llorens P, Quirós J, Delgado C. Percutaneous radiofrequency ablation: Relationship between different probe types and procedure time on length and extent of osteonecrosis in dog long bones. Skeletal Radiol 2008;37:147–52
- Irastorza R M, Trujillo M, Martel Villagrán J, Berjano E. Radiofrequency ablation of osteoma osteoide: A finite element study. IFMBE Proc 2015;49:858–62
- Hall SK, Ooi EH, Payne SJ. Cell death, perfusion and electrical parameters are critical in models of hepatic radiofrequency ablation. Int J Hyperthermia 2015;31:538–50
- Cantwell CP, O’Byrne J, Eustace S. Radiofrequency ablation of osteoid osteoma with cooled probes and impedance-control energy delivery. Am J Roentgenol 2006;186:244–8
- Rana RS, Wu JS, Eisenberg RL. Periosteal reaction. Am J Roentgenol 2009;193;4:259–72
- Abraham JP, Sparrow EM. A thermal-ablation bioheat model including liquid-to-vapor phase change, pressure-and necrosis-dependent perfusion, and moisture-dependent properties. Int J Heat Mass Transfer 2007;50:2537–44
- Schutt DJ, Haemmerich D. Effects of variation in perfusion rates and of perfusion models in computational models of radio frequency tumor ablation. Med Phys 2008;35:3462–70
- Doss JD. Calculation of electric fields in conductive media. Med Phys 1982;9:566–73
- Hadjipavlou P, Tzermiadianos AG, Kakavelakis MN, Lander KN. Percutaneous core excision and radiofrequency thermo-coagulation for the ablation of osteoid osteoma of the spine. Eur Spine J 2009;18:345–51
- Lindner K, Ozaki NJ, Roedl T, Gosheger R, Winkelmann G, Wörtler W. Percutaneous radiofrequency ablation in osteoid osteoma. J Bone Joint Surg Br 2001;83:391–6
- Pinto WR, Taminiau CH, Vanderschueren AHM, Hogendoorn GM, Bloem PCW, Obermann JL. Perspective: Technical considerations in CT-guided radiofrequency thermal ablation of osteoid osteoma: Tricks of the trade. Am J Roentgenol 2002;179:1633–42
- Rybak LD, Gangi A, Buy X, La Rocca Vieira R, Wittig J. Thermal ablation of spinal osteoid osteomas close to neural elements: Technical considerations. Am J Roentgenol 2010;195:293–8
- Haemmerich D, Webster JG. Automatic control of finite element models for temperature-controlled radiofrequency ablation. Biomed Eng Online 2005;4:42
- Hasgall PA, Di Gennaro F, Baumgartner C, Neufeld E, Gosselin MC, Payne D, et al. IT’IS database for thermal and electromagnetic parameters of biological tissues, Version 2.6. Available at www.itis.ethz.ch/database/ (acessed 13 January 2015)
- Tungjitkusolmun S, Staelin T, Haemmerich D, Tsai JZ, Cao H, Webster JG, et al. Three-dimensional finite-element analyses for radio-frequency hepatic tumor ablation. IEEE Trans Biomed Eng 2002;49:3–9
- Haemmerich D, Wood BJ. Hepatic radiofrequency ablation at low frequencies preferentially heats tumour tissue. Int J Hyperthermia 2006;22:563–74
- Pätz T, Kröger T, Preusser T. Simulation of radiofrequency ablation including water evaporation. IFMBE Proc 2009;25:1287–90
- Rossmanna C, Haemmerich D. Review of temperature dependence of thermal properties, dielectric properties, and perfusion of biological tissues at hyperthermic and ablation temperatures. Crit Rev Biomed Eng 2014;42:467–92
- Valvano JW, Cochran JR, Diller KR. Thermal conductivity and diffusivity of biomaterials measured with self-heated thermistors. Int J Thermophys 1985;6:301–11
- Surowiec AJ, Stuchly SS, Barr JR, Swarup A. Dielectric properties of breast carcinoma and the surrounding tissues. IEEE Trans Biomed Eng 1988;35:257–63
- Klein MJ, Parisien MV, Schneider-Stock R. Osteoid osteoma. In: Fleetcher CDM, Unni KK, Mertens F, Pathology and Genetics of Tumours of Soft Tissue and Bone, World Health Organization Classification of Tumours. Lyon: IARC Press, 2002, pp. 260–61
- Mcintosh RL, Anderson V. A comprehensive tissue properties database provided for the thermal assessment of a human at rest. Biophys Rev Lett 2010;5:129–51
- Song CW, Choi IB, Nah BS, Sahu SK, Osborn JL. Microvasculature and perfusion in normal tissues and tumors. In: Seegenschmiedt MH, Fessenden P, Vernon CC, Thermoradiotherapy and Thermochemotherapy, Medical Radiology. Berlin: Springer, 1995, pp. 139–56
- Sierpowska J, Hakulinen MA, Day JS, Weinans H, Jurvelin JS, Lappalainen R. Prediction of mechanical properties of human trabecular bone by electrical measurements. Physiol Meas 2005;26:S119–31
- Motamedi D, Learch TJ, Ishimitsu DN, Motamedi K, Katz MD, Brien EW, Menendez L. Thermal ablation of osteoid osteoma: Overview and step-by-step guide. Radiographics 2009;29:2127–41