
Abstract
Purpose: HIFU becomes an effective and non-invasive modality of solid tumour/cancer ablation. Simulation of the non-linear acoustic wave propagation using a phased-array transducer in multiple layered media using different focusing strategies and the consequent lesion formation are essential in HIFU planning in order to enhance the efficacy and efficiency of treatment.
Materials and methods: An angular spectrum approach with marching fractional steps was applied in the wave propagation from phased-array HIFU transducer, and diffraction, attenuation, and non-linearity effects were accounted for by a second-order operator splitting scheme. The simulated distributions of the first three harmonics along and transverse to the transducer axis were compared to the hydrophone measurements. The bioheat equation was used to simulate the subsequent temperature elevation using the deposited acoustic energy, and lesion formation was determined by the thermal dose.
Results: Better agreement was found between the measured harmonics distribution and simulation using the proposed algorithm than the Khokhlov–Zabozotskaya–Kuznetsov equation. Variable focusing of the phased-array transducer (geometric focusing, transverse shifting and the generation of multiple foci) can be simulated successfully. The shifting and splitting of focus was found to result in significantly less temperature elevation at the focus and the subsequently, the smaller lesion size, but the larger grating lobe grating lobe in the pre-focal region.
Conclusions: The proposed algorithm could simulate the non-linear wave propagation from the source with arbitrary shape and distribution of excitation through multiple tissue layers in high computation accuracy. The performance of phased-array HIFU can be optimised in the treatment planning.
Introduction
High intensity focused ultrasound (HIFU) has become an emerging non-invasive modality for the treatment of prostate, liver, kidney, breast, bone and pancreatic cancer, and uterine fibroids [Citation1]. Most of the clinical trials have been carried out in Asia and Europe with great success. The principle of thermal ablation induced by HIFU is to focus ultrasonic waves at a specific location, causing a rapid temperature rise in the tissue in the focal region after absorbing the acoustic energy, and subsequently the formation of irreversible necrosis and death of the cancer cells when the accumulated thermal dose is beyond a certain threshold. Furthermore, HIFU can also be used for various medical applications such as local drug delivery and gene transfection, thrombolysis and tissue erosion [Citation2–4]. A simple, reliable, and popular configuration of the HIFU system is to mechanically move the focal point throughout the whole volume of a solid tumour/cancer by motors. The HIFU transducer could be a single concave element, or several piston elements aligned on the same concave surface and all driven in phase, or a concave acoustic lens in front of the planar transducer. However, this configuration has several shortcomings. Because of the refractive inhomogeneities of tissue and the presence of multiple layers in the propagation pathway, acoustic wave focusing in vivo is not as perfect as in the free field [Citation5]. Technical advances in the last decade witnessed the development and application of phased-array transducers which consist of hundreds or thousands of individually driven elements [Citation6]. Electronic steering is achieved by varying the phase applied to each emitter to compensate for the delay in the acoustic wave propagation with respect to the focal point position. As a result, the interval time of focus shifting is dramatically reduced (from seconds to nanoseconds theoretically). Such a quick motion makes real-time compensation of the respiratory-induced motion in the organ (i.e. kidney and liver) possible. Phase aberration occurring in the tissue could also be compensated to improve the focusing. The production of multiple foci and minimisation of acoustic energy accumulated in unintended organs (e.g. ribs for transcostal ablation, large artery, and nerve) are only feasible using the phased-array design. Although the cost and control complexity of a large-scale phased-array transducer increases significantly, and the available range of focus shifting is typically in the order of 1 cm, the application of phased array is definitely the choice for the next generation of HIFU system.
Simulating the propagation of focused finite-amplitude sound with the combined influences of non-linearity, absorption, diffraction, and consequent lesion formation is of importance in HIFU treatment planning and understanding the mechanism. The Khokhlov–Zabozotskaya–Kuznetsov (KZK) equation [Citation7,Citation8] is popular and accurate for moderately focused acoustic beams with high direction (ka ≫ 1, where k is the wave number and a is the radius of the source) at distances beyond a few source radii and in the paraxial region (up to about 16° off the central propagation axis in the far field) [Citation9]. However, this model uses a parabolic approximation for the diffraction effect, which limits the validity to relatively weak diffraction and low focusing gains, and hampers its use in the field of modern medical ultrasound sources. The KZK equation can be solved in an explicit finite-difference (FD) algorithm using a marching scheme based on the operator splitting method on a three-dimensional Cartesian grid [Citation10]. As the code marches, all wave propagation effects including thermoviscous absorption, relaxation, and dispersion are accounted for separately at the fractional steps and then simply summed if the effect in each step is fairly weak to correct the waveform. The time-domain numerical model is efficient for the propagation of short pulses from a symmetric source in multiple layers, and very good agreement was found between simulations and experiments [Citation11]. In the frequency-domain or spectral method, a Fourier series of the sound pressure is substituted into the KZK equation and the resulting set of coupled equations are solved using FD methods [Citation12]. The alternative wave equation is the Westervelt equation, which is derived from the full equations of fluid motion by keeping up to quadratic terms [Citation13]. It can simulate the generation of grating lobes which are located far beyond the validity region of the KZK equation [Citation14] in both linear and non-linear cases [Citation15]. However, the simulation of a non-axis-symmetric source is still quite challenging and computationally complex.
A much more efficient diffraction algorithm is based on the angular spectrum approach (ASA) [Citation16] because it can be implemented by taking advantage of the fast Fourier transform (FFT) or the discrete Hankel transform. Diffraction is calculated using a spatial Fourier transform method while applying the Burgers’ equation to model non-linear effects even in regions that do not satisfy the parabolic approximation [Citation17]. In addition, in order to increase the computation efficiency, a second-order operator splitting scheme with a fractional step algorithm was applied [Citation18], because relatively larger steps could be used than those in a first-order operator splitting [Citation17]. Step-size could also be adaptive: large steps in the near field and smaller ones in the focal region. The ASA approach has been used for pressure fields generated by concentric ring arrays and sector-vortex arrays. The spectral propagator is preferred in the ASA over the spatial propagator for calculations in attenuating media or with an apodised pressure distribution [Citation19]. In addition, the effects of reflection and refraction on wave propagation, especially in multi-layered media, could also be compensated using the ASA [Citation20].
In this study, the ASA was applied with a second-order operator splitting to simulate the three-dimensional non-linear acoustic field of a phased-array HIFU transducer in multiple layered media with a steered propagation axis varying over a wide range of angles and generation of multiple foci. The model was first validated by comparing the first five harmonics on the axis of a concave transducer with those using the KZK model, and good agreement was found between them. Then the simulations were compared with the measurement of an annular HIFU transducer. The proposed algorithm had a better agreement of harmonics distribution along and transverse to the transducer axis than the KZK model in the locations of pressure nodes and side lobes in the pre-focal region. In order to apply the simulation to the HIFU phased array, three cases were considered here: geometric focusing, transverse focus shifting, and four foci generation in the focal plane. Non-linear acoustic wave propagation in three dimensions with the presence of harmonics and waveform distortion and grating lobes in the pre-focal region are clearly shown in the simulation. Then the subsequent thermal field for a 2-s continuous HIFU exposure was calculated using the bioheat equation and the lesion boundary was determined by the thermal dose. It is found that shifting or splitting the focus will result in a lower temperature elevation and smaller lesion size because of the reduced non-linearity and the peak positive pressure. Altogether, the algorithm used in this study provides an accurate way to calculate the acoustic field with an arbitrary source distribution, multiple media, and complex focus pattern and to predict the consequent lesion formation in the HIFU treatment planning.
Materials and methods
Non-linear acoustic wave propagation
The effects of diffraction, attenuation, and non-linearity on finite-amplitude acoustic waves are propagated separately over incremental distances in the operator splitting scheme, which is based on a reduced evolution equation and valid for one-way propagation of quasi-plane waves
(1)
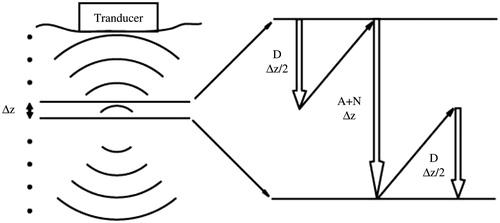
where p is the acoustic pressure, LA, LD, and LN are the operators representing the effect of attenuation, diffraction and non-linearity, respectively [Citation21]. Here, the second-order splitting scheme was used because of its high computational efficiency and accuracy, which was accomplished by first solving a half-step with the diffraction operator, then taking that solution to the non-linearity and attenuation operator for a full step, and finally completing the diffraction operator by another half-step [Citation18] as shown in .
(2)
where Δz is the propagation step size.
Figure 1. Illustration of step-marching scheme and second-order operator splitting operator used in the nonlinear acoustic wave propagation plane-by-plane in incremental steps from the transducer. Each step involves the effect of diffraction (D), attenuation (A), and nonlinearity (N).
To overcome the parabolic approximation in the KZK equation, full wave diffraction by the ASA was chosen. Briefly, the ASA could be defined through a transfer function in the spatial frequency domain for the pressure from one plane to another parallel plane. The point spread function of a source is given by EquationEquation 3(3) :
(3)
where
. So the pressure could be derived from the 2D spatial convolution between the input pressure at z0 and the spatial propagator hp as in EquationEquation 4
(4) .
(4)
Performing 2D Fourier transforms on both sides of EquationEquation 4(4) obtains EquationEquation 5
(5) :
(5)
where P(kx, ky, z0 + Δ z;ω), P0 (kx, ky, z0) and Hp (kx, ky, Δ z;ω) represent the 2D Fourier transform of the output plane pressure p(x, y, z0 + Δ z;ω), the input plane pressure p(x, y, z0), and the spectral propagator, respectively. Hp (kx, ky, Δ z;ω) is given by the analytical Hankel transform of hp (x, y, Δ z;ω) in EquationEquation 6
(6) .
(6)
The input pressure field of Lx ×Ly points is first discretised into a grid containing Mx × My points with a spatial sampling of δ. This grid is zero-padded to a larger grid of Nx × Ny points, and the angular spectrum of the input plane is calculated using a 2D FFT. The discretised transverse wavenumbers are:
(7)
where φx, φy compensate for the offset induced by the odd number of grid points so that m and n are both integers.
(8)
Due to the intrinsic periodicity of the spectrum, under-sampling of the spectra propagator and the replication of the source, the spatial aliasing error often appears in the far field. To reduce such an error, a spatial frequency truncation technique is applied through the use of the Tukey window (a spatial low-pass filter to the spectral propagator with a window size of 512 points and taper ratio of 0.1) [Citation22] without increasing the size of the computational grid. This method removes the under-sampled angular spectra and prevents the leakage of high spatial frequency components into the propagating field.
Distortion of finite-amplitude wave occurs in the propagation due to convective and non-linear effects over incremental steps, which can be expressed as EquationEquation 9(9) [Citation16]:
(9)
where N = 20 is the number of harmonics to be retained in the simulation, β is the non-linearity coefficient, f0 is the driving frequency, and the frequency dependence of the attenuation coefficient is written in a general form α (f) = α0 fb. The first summation in parentheses represents the accretion of the nth harmonic by a non-linear combination of other harmonics while the second one with conjugation can be interpreted as a depletion of the nth harmonic to other harmonics.
When the shock fronts develop in the pressure waveform, strong gradients appear in the transverse spatial field. These spatial gradients can cause artificial oscillations in the numerical solution. To eliminate them, an artificial absorption was introduced into the algorithm locally around the focus where shocks may present. Specifically, the exponential attenuation absorption coefficient is replaced by the function [Citation17] as in EquationEquation 10(10) .
(10)
where q is a constant. This approach is accurate and relatively insensitive to variation in q for the propagation of continuous planar waves, but only with distortion in the highest harmonics.
The pressure waveform in the radiation space can be synthesised from all harmonics as
(11)
Multiple layer model
At an interface between two media with different acoustic impedances the transmission coefficient in the frequency domain is given by EquationEquation 12(12) [Citation20]:
(12)
where ρ1, c1 and ρ2, c2 are the density and the speed of sound in the adjacent medium, respectively, θi and θt are the incident and refraction angles determined by Snell’s law, EquationEquation 13
(13) .
(13)
Thus, the angular spectrum of the pressures P1 and P2 at the interface are related by EquationEquation 14(14) .
(14)
Thermal model
The bioheat transfer equation (BHTE) was used to simulate the temperature elevation and lesion formation by HIFU [Citation23]:
(15)
where ρ is the density of the tissue, Ct is the specific heat of the tissue, T is the temperature at time t, κ is the thermal conductivity, Cb is the specific heat of the blood, Wb is the blood perfusion rate, Ta is the temperature at large distances, which corresponds to the initial condition value, and Qp is the power deposited from the focused ultrasound energy:
(16)
The BHTE was solved using the finite-difference time-domain (FDTD) method with initial and boundary conditions of 37 °C. The thermal dose, an equivalent exposure time at 43 °C (TD43°C), is used to characterise the ablation outcome in EquationEquation 17(17) [Citation24].
(17)
where R is 0.5 for T ≥ 43 °C and 0.25 for T < 43 °C. The lesion formation requires a thermal dose of a 240-min exposure at 43 °C. The thermal properties of viscera used in the BHTE equation are as follows: Ct = 3628 J/kg/°C, Cb = 3628 J/kg/°C, κ = 0.465 W/m/°C, Wb = 10 kg/m3/s, Ta = 37 °C.
Phased array
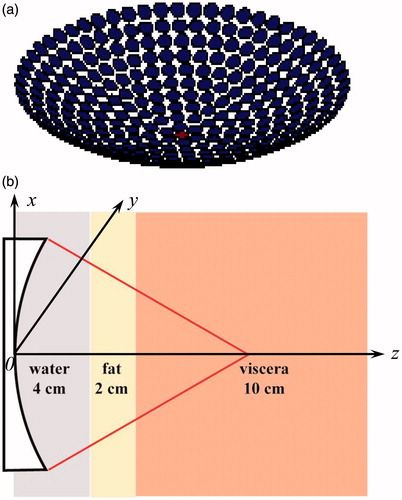
A concave phased array consisting of 331 circular elements (diameter of 3.6 mm and driving frequency of 1 MHz) has a focal length of 10 cm and an aperture radius of 5 cm, and was used in the simulation (). To simply mimic human tissues, a model comprised of a layer of 4 cm water, 2 cm fat and 10 cm viscera was adopted (). The formation of the single focus beam is achieved by the Huygen’s principle, while the multiple foci beam is formed by the pseudo-inverse approach method which has been widely utilised for multiple foci synthesis in phased array [Citation25]. For an array consisting of N elements with arbitrary geometry, the pressure at a specific point could be expressed as:
(18)
where un and S are the velocity and surface area of the nth element, respectively [Citation26]. The equation above can be expressed in matrix form as
(19)
where u is the complex excitation vector of the array elements, u = [u1, u2, ⃛ un], and the vector p denotes the complex pressure at the control points in the field, p = [p(r1), p(r2), ⃛p(rn)]', and H is the forward propagation operator. When H is full rank, EquationEquation 19
(19) has the weighted minimum-norm solution as
(20)
where H*t is the conjugate transpose of H, ^ uw are the final driving signals, W is an N × N real positive definite weighting matrix to reduce the dynamic range and improve the efficiency of the driving signals. An iterative weighting algorithm was utilised to achieve the specified power deposition at the control points. Although straightforward, this weighting algorithm can increase the array excitation efficiency to near 100% efficacy in most cases [Citation25]. Furthermore, in order to compensate for the refraction occurring at the tissue interface, additional weight ratio of the thickness of each layer to the total one [Citation20], which is determined by backward propagating the acoustic field to the transducer surface [Citation27, Citation28], is applied to the driving signal. All the simulations ran in MATLAB (R2010b, Mathworks, Natick, MA) on a PC (3.3 GHz Intel® Core™ i5-2500 CPU, 4 GB RAM) with Windows 7 32-bit operating system.
Figure 2. Schematic diagram of (a) a 331-element concave phased-array HIFU transducer and (b) the 3 layered media model used in the simulation.
HIFU field scanning
In order to validate the proposed algorithm, the HIFU field was measured using the established protocol [Citation29]. An annular focused HIFU transducer (H102, outer diameter =69.94 mm, inner diameter =22 mm, F = 62.64 mm, f = 1.1 MHz, Sonic Concepts, Woodinville, WA) was mounted at the bottom of a Lucite tank (L × W×H = 20 × 20 × 35 cm) filled with degassed and deionised water at room temperature (O2 < 4 mg/L, T = 25 °C) and driven by sinusoidal bursts produced by a function generator (AF3021B, Tektronics, Beaverton, OR) together with a power amplifier (BT00250-AlphaA, Tomco Technologies, Adelaide, Australia). To map the acoustic field of the HIFU transducer, a needle hydrophone (HNA-0400, Onda, Sunnyvale, CA) was connected to a three-dimensional positioning system (XSlide, Velmex, Bloomfield, NY), which has a minimum step size of 5 μm and a maximum scan range of 200 mm. The picked up signal was first recorded by a digital oscilloscope (WaveSurfer MXs-B, LeCroy, Chestnut Ridge, NY) operated at 500 MHz sampling rate, and then transferred to a PC for off-line analysis. The first three harmonics of pressure waveform were calculated using FFT. A LabVIEW (National Instruments, Austin, TX) program was written to automatically control the output of the function generator, data acquisition and transfer, and hydrophone scanning. To minimise temperature elevation and cavitation damage to the sensing element, the HIFU transducer was operated in burst mode with a low duty cycle (i.e. 10–20 cycles/burst). Averaging over 100 bursts was used to improve the signal-to-noise ratio of the measured pressure waveforms. The geometric focus was determined by searching for the location of maximum signal strength. For line scan along and transverse to the transducer axis, the range and step size was set as x = −3 − 3 mm, z = −3 − 3 cm, Δx = 0.2 mm, Δz = 0.5 mm, respectively.
Results
Model validation
To validate the proposed algorithm, harmonics generated by a concave transducer in a two-layer medium (3 cm water and 5 cm tissue) were compared with those simulated by using the KZK model (HIFU-Simulator v1.2, Food and Drug Administration, Silver Spring, MD) [Citation30]. The acoustic properties of water and tissue are listed in [Citation17]. The concave transducer has a driving frequency of 2.08 MHz, focal length of 5 cm, aperture diameter of 1.9 cm, and the acoustic pressure at the transducer surface is 480 kPa. In the simulation, the spatial sampling interval in the transverse plane was 0.238 mm (λwater/3), and the dimension of the source plane was 18.24 × 18.24 cm, corresponding to 768 × 768 grid points. The sampling interval on the axis was 0.356 mm (λwater/2) and 0.39 mm (λtissue/2) in the water and tissue layer, respectively. The axial pressure amplitude for the first five harmonics simulated by the KZK model (HIFU-Simulator) and by the second-order splitting operator using the ASA is shown in . It was found that these two results agreed closely in the far field (amplitude of fundamental harmonic: 3.04 MPa versus 3.16 MPa at the focus located at z = 4.08 cm versus 4.12 cm, respectively) but differed largely in the near field, which may be due to the different approximation of diffraction effects, consideration of refraction at the interface, and the starting position of non-linear effects. The HIFU-Simulator assumed that the propagation within the concave bowl was linear and non-linear propagation started from the aperture of the HIFU transducer. In contrast, the algorithm used in this study calculated the non-linear effects from the bottom plane of the transducer by back-projecting the acoustic pressure at the transducer surface to it. No ripple was found in the far field, which showed good convergence using the Tukey window.
Figure 3. Comparison of the first 5 harmonics on the axis of the HIFU transducer using the KZK equation (solid line) and the angular spectrum approach with second-order operator splitting scheme (dashed line) in a two layered media model.
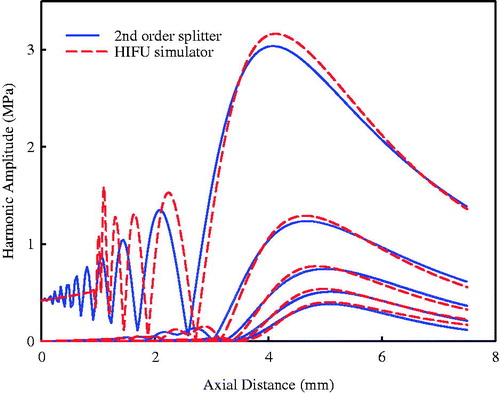
Table 1. Acoustic parameters of different media used in the simulation.
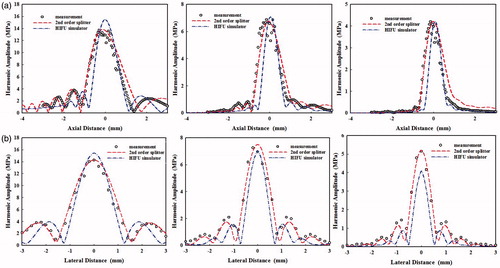
The numerical simulations were further compared with experimental results. The pressure waveforms at the focus were purposely aligned in the time domain to match the peaks for easy comparison (see ). Good agreement was found between measured and synthesised waveforms using both numerical models although the KZK model had the largest negative pressure (9.84 MPa versus 8.62 MPa using second-order operator splitting and 8.07 MPa in the measurement, respectively). Furthermore, the distributions of the first three harmonics along and transverse to the transducer axis measured by the hydrophone were compared with the numerical simulations (see ). The second-order operator splitting algorithm was found to have a better agreement than the KZK model, especially the locations of pressure nodes and more side lobes in the pre-focal region. Overall, the proposed algorithm was an accurate way to simulate the non-linear wave propagation of the HIFU burst. The calculation time of the HIFU-Simulator and the proposed algorithm are similar, about 30 min. In order to enhance the calculation accuracy, the second-order Runge–Kutta method was used to compute the non-linearity due to high pressure at the focus while the computation time would increase to about 50 min.
Figure 4. Comparison of the pressure waveforms at the focus of an annular HIFU transducer measured by a needle hydrophone and numerical simulations using the 2nd order operator splitting algorithm and the KZK model.
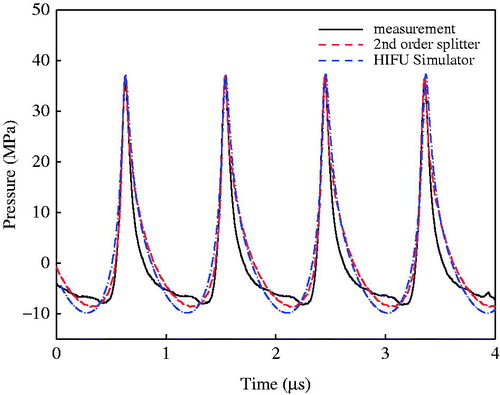
Figure 5. Comparison of the first 3 harmonics distribution (a) along and (b) transverse to the transducer axis obtained from the measurement and simulations using the 2nd order operator splitting algorithm and the KZK model.
Acoustic field
The acoustic field (the distribution of the first five harmonics in axial and lateral directions and the pressure waveform at the focus) in water and multiple-layered media produced by the phased-array HIFU transducer with the initial acoustic intensity of 8.33 W/cm2 on the transducer surface (about 500 kPa acoustic pressure), which is considered as high input excitation (p0 > 0.4 MPa) [Citation18], was simulated (see and ). Peak pressures are summarised in for easy comparison. Three cases were considered: geometrical focus (0, 0, 10) cm, transverse focus shifting (1, 0, 10) cm, and four foci in the focal plane (−1, −1, 10) cm, (−1, 1, 10) cm, (1, −1, 10) cm, (1, 1, 10) cm. The transverse sampling intervals were set at 0.2 mm, and the axial at λ/4 in all layers. The computation discretisation was 512 × 512 × 42, 512 × 512 × 80, and 512 × 512 × 130 points grid in water, fat, and the viscera layer, respectively. The computation on the PC took about 10 min. With the electrical steering on the focus, the peak positive pressure reduced by 11.4% in water (27.05–23.97 MPa) and 8.9% in tissue (13.54–12.33 MPa), respectively, but with less change to the peak negative pressure, 5.2% in water (7.33–6.95 MPa) and 4.4% in tissue (5.23–5.0 MPa), respectively. There was no significant change in the lateral distribution of harmonics with shifted focus, while the change in the axial direction, especially in the near field, was due to the definition of the axis through points of 1, 0, 10 cm and 1, 0, 0 cm. For the four foci case, the peak positive pressure was almost half shifted focus (10.09 versus 23.97 MPa in water and 6.11 versus 12.33 MPa in tissue, respectively), but the reduction of the peak negative pressure was much less (5.01 versus 6.95 MPa in water and 3.58 versus 5.0 MPa in tissue, respectively). Despite weak acoustic pressure for four foci in tissue, the presence of harmonics could still be illustrated clearly and the ratio of the second harmonic at the focal point to the fundamental frequency was more than 0.2.
Figure 6. The simulated harmonics generated by the phased-array transducer in water with an input acoustic intensity of 8.33 W/cm2 along the axial axis (left column) and the lateral axis (middle column), and the pressure waveform at the focus (right column) with different focusing strategies: (a) geometrically focusing at (0, 0, 10) cm, (b) transverse focus shifting at (1, 0, 10) cm, and (c) generation of four foci at (−1, −1, 10) cm, (−1, 1, 10) cm, (1, −1, 10) cm, (1, 1, 10) cm.
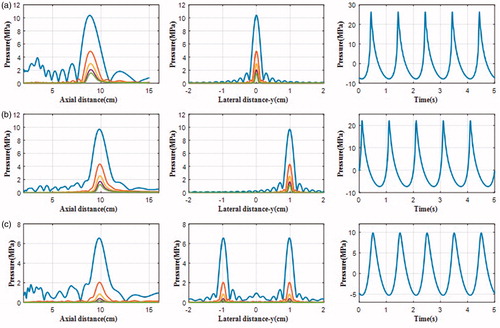
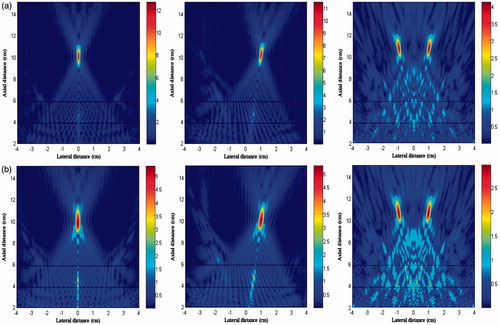
Figure 7. The simulated harmonics generated by the phased-array transducer in three layer media model with an input acoustic intensity of 8.33 W/cm2 along the axial axis (left column) and the lateral axis (middle column), and the pressure waveform at the focus (right column) with different focusing strategies: (a) geometrically focusing at (0, 0, 10) cm, (b) transverse focus shifting at (1, 0, 10) cm, and (c) generation of four foci at (−1, −1, 10) cm, (−1, 1, 10) cm, (1, −1, 10) cm, (1, 1, 10) cm.
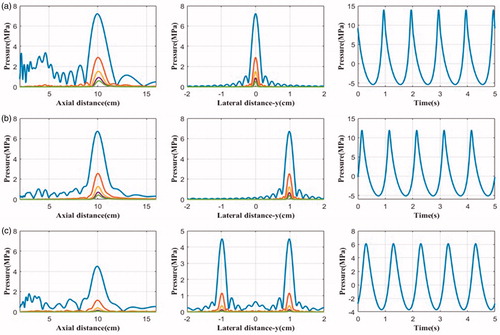
Table 2. Comparison of acoustic pressure at the focal points in water and tissue generated by different focusing patterns.
The distributions of first three harmonics in the xz plane using these three focusing strategies are shown in . It was found that the grating lobes on the axis (z = 4 − 5 cm) occurred mostly at the fundamental harmonics (ratio of pressure at the focus to that in the grating lobe was about 6 dB. Shifting the focus slightly worsened the grating lobe (the pressure ratio of 5.94 dB), while splitting into four foci had a significant influence on the pressure ratio of 4.71 dB and much wider area of multiple grating lobes with similar pressure. The corresponding pressure distributions in the xz plane are shown in . Although the patterns of peak positive and negative pressure distribution are quite similar, there are some discrepancies. First, the beam size of peak negative pressure is larger than that of peak positive pressure. Because of the acoustic non-linearity, the duration of the positive and negative pulse will decrease and increase, which means shifting towards low and high frequency correspondingly [Citation29]. Second, the grating lobes of negative pressure are more significant than that of positive pressure.
Figure 8. The simulation distribution of fundamental harmonic (left column), 2nd harmonic (middle column) and 3rd harmonic (right column) in the x-z plane generated by the phased-array transducer in three layer media model with an input acoustic intensity of 8.33 W/cm2 with different focusing strategies: (a) geometrically focusing at (0, 0, 10) cm, (b) transverse focus shifting at (1, 0, 10) cm, and (c) generation of four foci at (−1, −1, 10) cm, (−1, 1, 10) cm, (1, −1, 10) cm, (1, 1, 10) cm.
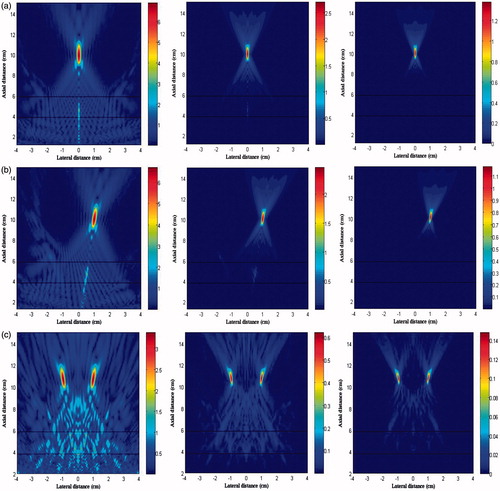
Figure 9. The simulation distribution of (a) peak positive pressure and (b) peak negative pressure in the x-z plane generated by the phased-array transducer in three layer media model with an input acoustic intensity of 8.33 W/cm2 with different focusing strategies: geometrically focusing at (0, 0, 10) cm (left column), transverse focus shifting at (1, 0, 10) cm (middle column), and generation of four foci at (−1, −1, 10) cm, (−1, 1, 10) cm, (1, −1, 10) cm, (1, 1, 10) cm (right column).
Thermal pattern and lesion size
The thermal fields in both the focal region (xy and xz plane) and pre-focal region (xz plane) using the phased-array HIFU transducer immediately after 2 s continuous ablation at an input acoustic intensity of 8.33 W/cm2 with the three different focusing strategies are shown . The presence of grating lobe in the pre-focal region with significant temperature rise (56.3°, 57.5°, and 44.1 °C, respectively) was found, which may cause unexpected damage. For the four foci case, the presence of interference patterns in both the pre- and post-focal region could be figured out easily (as shown by the arrows in ). Such interference resulted in broad and complicated patterns of the grating lobe. In addition, the temperature evaluation at the focal point using these three focusing strategies was also compared with each (). A linear acoustics model, which ignores the non-linear operator in EquationEquations 1(1) and Equation9
(9) , was also included in the comparison with the same computation volume and the transverse sampling intervals. It shows that the non-linear acoustic propagation resulted in higher temperature in the HIFU ablation than that predicted by the linear model (i.e. 98.7 °C versus 86.1 °C for geometrically focusing) due to significant differences in the heating deposition rate by the harmonics. Because of the low acoustic pressure in the four-foci case, the discrepancy of temperature rises between non-linear and linear models was quite small (only 1 °C). However, the lesion boundary after HIFU ablation was not affected much by the non-linear effect (), due to the quick dissipation of non-linearity away from the focus and low thermal conduction in the soft tissue. The thermal output in the focal region for these three cases is summarised in . The total lesion volume of four foci was much less than a single focus (47.2 mm3 versus 126.6 mm3 and 103.9 mm3 for geometric focusing and transverse shifting, respectively). Furthermore, if the peak positive pressure at focus was adjusted to the same value for all focusing strategies, the comparison of thermal fields could be listed as in . The maximum temperatures induced by transverse focus shifting and four foci were a little smaller than that at the geometrical focus, and the lesion area and volume produced by transverse focusing shifting were slightly larger, which may be due to the large beam width. However, the maximum temperatures in the pre-focal region cannot be neglected (61° and 74.3 °C for transverse focus shifting and four foci, respectively). It suggests that great attention should be paid when shifting the focus or generation of multiple foci in HIFU ablation in order to avoid the unintended heating in the pre-focal region. In addition, transverse focus shifting and generation of four foci requires an increase of 1.15- and 5-fold, respectively, in the input acoustic intensity.
Figure 10. Comparison of the thermal field in the x-y plane (left column) and x-z plane (middle column) and presence of grating lobes in the x-z plane (right column) after 2-second continuous HIFU ablation through three layered media with an input acoustic intensity of 8.33 W/cm2 using different focusing strategies (a) geometrically focusing at (0, 0, 10) cm, (b) transverse focus shifting at (1, 0, 10) cm, and (c) generation of four foci at (−1, −1, 10) cm, (−1, 1, 10) cm, (1, −1, 10) cm, (1, 1, 10) cm.
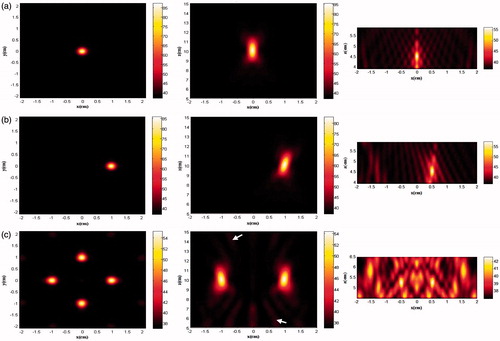
Figure 11. Comparison of the temperature elevation at the focal point during 2-second continuous HIFU ablation using different focusing strategies simulated by linear (solid line) and nonlinear acoustic model (dash line).
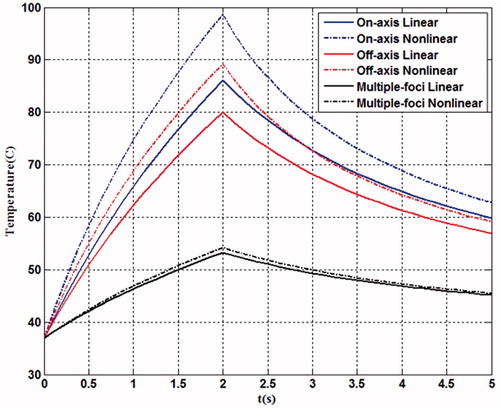
Figure 12. Comparison of the lesion size in (a) x-y plane and (b) x-z plane using different focusing strategies predicted by the linear (solid line) and nonlinear (dashed line) acoustic model after 2-second continuous HIFU ablation through three layered media with an input acoustic intensity of 8.33 W/cm2.
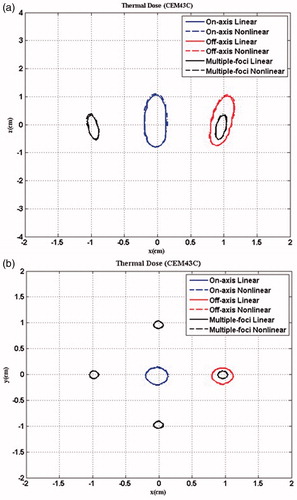
Table 3. Comparison of the maximum temperatures at the focal points after 2 s HIFU ablation and the lesion size in the tissue generated by different focusing patterns using linear and non-linear models.
Table 4. Comparison of the maximum temperatures at the focal points and in the pre-focal grating lobes after 2 s HIFU ablation and the lesion size in the tissue generated by different focusing patterns when adjusting the acoustic pressure at focus to the same value.
Discussion and conclusion
Non-linear acoustics plays a significant role in HIFU ablation, and the use of phased array is becoming popular for compensation of phase aberration and flexibility of focusing pattern. In this study, a numerical algorithm has been adopted to investigate the pressure distribution and the corresponding thermal pattern of the phased-array HIFU with the geometric or off-axis focus or multiple foci. The second-order operator splitting scheme proposed here has a better agreement with the harmonics distribution of the HIFU field in the measurement than the KZK model. For pulsed excitation, attenuation was coupled with the half-step of diffraction rather than the non-linear sub-step [Citation31]. In HIFU ablation the burst duration is usually in the order of 100ms, and the transient response at both the start and termination of excitation is not important. Therefore, a different second-order operator splitting scheme was used here. The presence of higher harmonics in the waveform spectrum due to acoustic non-linearity can result in a higher heat deposition rate [Citation29]. However, there are far fewer differences between the boundaries of the lesions simulated by linear and non-linear models, which is due to low thermal conductivity of soft tissue. The increase of thermal conductivity in the tissue leads to exponential decrease of the maximum temperature elevation at the focus but significant increase in the focal region [Citation32]. Therefore, the HIFU-induced thermal ablation could be predicted easily and quickly using a simple linear model with promising accuracy. Meanwhile, the absorption of the acoustic wave increases with the frequency. Thus, although the non-linearity of tissue is higher than that of water, the waveform distortion at the focal point is not significant because of high attenuation. The absorption law was found to have less impact on the prediction of the fundamental frequency than high harmonics, and on the transverse distribution than the axial distribution [Citation31]. The shifting of focus and generation of multiple foci patterns will decrease the non-linear effect and deposited acoustic energy, leading to the formation of smaller lesions. In addition, this algorithm was also used for the planar phased array HIFU transducer with a similar conclusion (data not shown). Overall, our numerical model can simulate the acoustic and thermal field of HIFU phased array in a high computational accuracy. Optimisation of HIFU treatment planning is feasible to enhance the efficacy and safety, but needs further investigation.
Computational efficiency is another reason of using ASA. The computation burden for the ASA is in the order of Nx Ny Nt⃛ log2 (Nx Ny Nt /2) where Nt is the number of temporal samples, and solving the non-linear wave equation in the frequency domain has a complexity in the order of N2 where N is the number of harmonics retained. Thus, the computation volume, the transverse and axial plane sampling intervals, and the number of harmonics are key parameters in the simulation and were chosen as the trade-off between accuracy and computation burden. The value of N can be dynamically adjusted according to the waveform distortion [Citation17]. If no shocks are anticipated, 5 − 10 harmonics can adequately describe a continuous wave field; otherwise, 30 − 50 harmonics are required. The transverse plane sampling rate should be large enough to describe the significant spatial frequency component, otherwise large wrap-around errors will occur. For unfocused fields, 1 ∼ 2× the Nyquist rate of the fundamental frequency works very well, while 4× the Nyquist rate is used for the focused transducer [Citation33]. The axial sampling intervals and N can also vary accordingly in the simulation. At the beginning of the simulation large Δz and small N can be used due to the weak non-linear effect. As the wave propagates towards the focal region and non-linear effect becomes significant, finer step-size and large N are gradually included. The resultant exponential attenuation across Δ z in the focal or far-field region for the highest harmonic should be no smaller than 0.7, which ensures the accuracy of the joint effect of non-linearity, attenuation, and diffraction in propagation. If all of these parameters are varied adaptively in the simulation (fixed in this study), the computation time would be reduced. Dynamic data allocation has been applied in three-dimensional acoustic field calculation to effectively implement the non-linear algorithms with the application of stream data processing and efficient memory organisation [Citation3]. The size of kth echelon is determined as
(21)
where k is the echelon number, N is the overall number of echelons, and L1 is the size of the first echelon. Subsequently, the resources of memory could be saved by a factor of tens while maintaining the calculation efficiency.
In practical hyperthermia or ablation, several variations in the physical properties of tissue should also be considered. If the tissue has small variations in density changes, then a new term ∇ p ⋅ ∇ ρ0 /ρ0 will be introduced to the full wave equation [Citation31]. Small-scale variations in other parameters (i.e. non-linearity, absorption, and dispersion) do not introduce extra terms into the second-order wave equation [Citation31]. The density fluctuation in the transverse direction, ρ0(z), could be incorporated into the diffraction term as first-order derivatives while that in the axial direction should be included in the operator splitting paradigm as a new ordinary first-order differential equation [Citation31].
(22)
The speed of sound in the tissue is a function of the temperature, increasing with it and exhibiting a maximum at around 50 °C in non-fatty tissues but a negative dependence for fatty tissues [Citation34]. Such variation constitutes a localised aberration, becomes significant as HIFU ablation progresses, and causes the self-defocusing of the acoustic beam. The ultrasonic attenuation coefficient of fresh bovine and human soft tissue has asymmetric quasi-parabolic curves with temperature, being convex downwards with their minimum at the turning temperature of around 40 °C [Citation34]. Furthermore, all the thermal parameters (specific heat capacity, thermal conductivity and heat diffusivity) of ex vivo porcine liver heated from 20–90 °C had a similar relationship with the temperature [Citation35]. Therefore, more work is required to improve the proposed algorithm for in vivo application, to compensate the aberrations for perfect and consistent focusing, and to predict lesion formation accurately.
Skin burns could be found occasionally during the clinical HIFU treatment and is a concern for HIFU safety [Citation1]. One of the reasons may have been the bad acoustic coupling at the wave entry site. Hair in the skin could trap bubbles in the coupling media, degassed and deionised water or ultrasound coupling gel. Using real-time sonography, the coupling condition could be checked frequently. When hyper-echoes showed up HIFU ablation could be terminated to remove these bubbles. The appearance of the grating lobe in the pre-focal region of the HIFU field is another mechanism which is inherent to the geometry and frequency of HIFU parameters. The pressure in the grating lobe is much larger than that in the first side lobe, which is more than 15 dB less than the pressure at the focus. Splitting focus into multiple foci further worsens this phenomenon. If each split focus has a similar acoustic pressure to that at the geometrical focal point of the transducer, the large area of grating lobes as shown in should be considered seriously because of significant temperature rises as listed in . In this study, it was also found that negative pressure created more significant grating lobes. If higher than the cavitation threshold, the negative pressure in the grating lobe will induce bubbles, which may shield the propagation of subsequent HIFU bursts towards the focal region and scatter them towards the transducer. The presence of bubbles in the acoustic field results in enhanced heat deposition and formation of larger lesions [Citation1]. Several approaches have been proposed for reducing the grating lobe, such as elements with unequal centre-to-centre spacing [Citation25], sparse array with random distribution of elements [Citation36], the use of a wide-band signal (phase modulated by a pseudo-random code) [Citation37], array apodisation (unequal element amplitude weighting) [Citation38,Citation39], and optimised random distributions of unequally sized elements [Citation40].
In summary, the proposed algorithm allowed the calculation of non-linear HIFU wave propagation from arbitrary excitation geometry through multiple tissue layers with different focusing strategies in an accurate and efficient way. Despite the popularity of the KZK model used in the HIFU simulation, the axially symmetric source and parabolic approximation limit its application, especially for phased array HIFU. Narrower beam size along and transverse to the transducer axis is predicted by the KZK model than those by the proposed algorithm and measurement, which may be due to the underestimation of diffraction. The resultant thermal field, temperature elevation, and lesion formation can be used to evaluate the HIFU treatment plan in the practice quantitatively. Shifting and splitting the focus leads toreduced acoustic pressure and lesion size. In addition, the grating lobe in the pre-focal region becomes worse. Compensation of tissue phase aberration, tracking of target motion due to respiration, and avoidance of unintended energy accumulation in a vital region by using a phased-array HIFU transducer will be further investigated on the basis of this simulation algorithm.
ORCID detail
Yufeng Zhou http://dx.doi.org/10.3109/02656736.2016.1160154.
Acknowledgements
The authors thank Mr. Chenhui Liu for his work measuring pressure waveforms in the HIFU field and spectrum analysis.
Disclosure statement
The authors report no conflicts of interest. The authors alone are responsible for the content and writing of the paper.
References
- Zhou Y-F. High intensity focused ultrasound in clinical tumor ablation. World J Clin Oncol 2011;2:8–27.
- Frenkel V, Li KC. Potential role of pulsed-high intensity focused ultrasound in gene therapy. Future Oncol 2006;2:111–19.
- Wright C, Hynynen K, Goertz D. In vitro and in vivo high intensity focused ultrasound thrombolysis. Investig Radiol 2012;47:217–25.
- Khokhlova VA, Fowlkes JB, Roberts WW, Schade GR, Xu Z, Khokhlova TD, et al. Histotripsy methods in mechanical disintegration of tissue: Towards clinical applications. Int J Hyperthermia 2015;31:145–62.
- Hill C, Ter Haar G. High intensity focused ultrasound – potential for cancer treatment. Br J Radiol 1995;68:1296–303.
- Auboiroux V, Dumont E, Petrusca L, Viallon M, Salomir R. An MR-compliant phased-array HIFU transducer with augmented steering range, dedicated to abdominal thermotherapy. Phys Med Biol 2011;56:3563–82.
- Zabolotskaya EA, Khokhlov RV. Quasi-plane waves in the nonlinear acoustics of confined beams. Sov Phys Acoust 1969;15:35–40.
- Kuznetsov VP. Equations of nonlinear acoustics. Soviet Phys Acoust 1971;16:467–70.
- Naze Tjøtta J, Tjøtta S, Vefring EH. Effects of focusing on the nonlinear interaction between two collinear finite amplitude sound beams. J Acoust Soc Am 1991;89:1017–27.
- Lee YS, Hamilton MF. Time‐domain modeling of pulsed finite‐amplitude sound beams. J Acoust SocAm 1995;97:906–17.
- Averkiou MA, Hamilton MF. Nonlinear distortion of short pulses radiated by plane and focused circular pistons. J Acoust Soc Am 1997;102:2539–48.
- Aanonsen SI, Barkve T, Tjøtta JN, Tjøtta S. Distortion and harmonic generation in the nearfield of a finite amplitude sound beam. J Acoust Soc Am 1984;75:749–68.
- Westervelt PJ. Parametric acoustic array. J Acoust Soc Am 1963;35:535–7.
- Kreider W, Yuldashev PV, Sapozhnikov OA, Farr N, Partanen A, Bailey MR, et al. Characterization of a multi-element clinical HIFU system using acoustic holography and nonlinear modeling. IEEE Trans Ultrason Ferroelectr Freq Control 2013;60:1683–98.
- Doinikov AA, Novell A, Calmon P, Bouakaz A. Simulations and measurements of 3-D ultrasonic fields radiated by phased-array transducers using the westervelt equation. IEEE Trans Ultrason Ferroelectr Freq Control 2014;61:1470–7.
- Zemp RJ, Tavakkoli J, Cobbold RS. Modeling of nonlinear ultrasound propagation in tissue from array transducers. J Acoust Soc Am 2003;113:139–52.
- Christopher PT, Parker KJ. New approaches to nonlinear diffractive field propagation. J Acoust Soc Am 1991;90:488–99.
- Tavakkoli J, Cathignol D, Souchon R, Sapozhnikov OA. Modeling of pulsed finite-amplitude focused sound beams in time domain. J Acoust Soc Am 1998;104:2061–72.
- Zeng X, McGough RJ. Optimal simulations of ultrasonic fields produced by large thermal therapy arrays using the angular spectrum approach. J Acoust Soc Am 2009;125:2967–77.
- Zeng X. Ultrasound phased array simulations for hyperthermia. Doctoral dissertation, Michigan State University, 2008.
- Szabo TL. Time domain wave equations for lossy media obeying a frequency power law. J Acoust Soc Am 1994;96:491–500.
- Williams EG. Fourier acoustics: Sound radiation and nearfield acoustical holography. San Diego, CA: Academic Press, 1999.
- Pennes HH. Analysis of tissue and arterial blood temperatures in the resting human forearm. J Appl Physiol 1948;1:93–122.
- Sapareto S, Dewey W. Thermal dose determination in cancer therapy. Int J Radiat Oncol Biol Phys 1984;10:787–800.
- Ebbini ES, Cain CA. Multiple-focus ultrasound phased-array pattern synthesis: Optimal driving-signal distributions for hyperthermia. IEEE Trans Ultrason Ferroelectr Freq Control 1989;36:540–8.
- Sommerfeld A. Optics. Lectures on theoretical physics, volume IV. San Diego, CA: Academic Press, 1964.
- Liu D-L, Waag RC. Propagation and backpropagation for ultrasonic wavefront design. IEEE Trans Ultrason Ferroelectr Freq Control 1997;44:1–13.
- Clement G, Hynynen K. Field characterization of therapeutic ultrasound phased arrays through forward and backward planar projection. J Acoust Soc Am 2000;108:441–6.
- Zhou Y, Zhai L, Simmons R, Zhong P. Measurement of high intensity focused ultrasound fields by a fiber optic probe hydrophone. J Acoust Soc Am 2006;120:676–85.
- Soneson JE. A user‐friendly software package for HIFU simulation. Eigth International Symposium on Therapeutic Ultrasound. AIP Publishing, 2009, pp. 165–9.
- Yang X, Cleveland RO. Time domain simulation of nonlinear acoustic beams generated by rectangular pistons with application to harmonic imaging. J Acoust Soc Am 2005;117:113–23.
- Zhou Y. Generation of uniform lesions in high intensity focused ultrasound ablation. Ultrasonics 2013;53:495–505.
- Wu P, Kazys R, Stepinski T. Optimal selection of parameters for the angular spectrum approach to numerically evaluate acoustic fields. J Acoust Soc Am 1997;101:125–34.
- Bamber J, Hill C. Ultrasonic attenuation and propagation speed in mammalian tissues as a function of temperature. Ultrasound Med Biol 1979;5:149–57.
- Guntur SR, Lee KI, Paeng D-G, Coleman AJ, Choi MJ. Temperature-dependent thermal properties of ex vivo liver undergoing thermal ablation. Ultrasound Med Biol 2013;39:1771–84.
- Goss SA, Frizzell LA, Kouzmanoff JT, Barich JM, Yang JM. Sparse random ultrasound phased array for focal surgery. IEEE Trans Ultrason Ferroelectr Freq Control 1996;43:1111–21.
- Dupenloup F, Chapelon JY, Cathignol DJ, Sapozhnikov OA. Reduction of the grating lobes of annular arrays used in focused ultrasound surgery. IEEE Trans Ultrason Ferroelectr Freq Control 1996;43:991–8.
- Ebbini ES, Cain C. Experimental evaluation of a prototype cylindrical section ultrasound hyperthermia phased-array applicator. IEEE Trans Ultrason Ferroelectr Freq Control 1991;38:510–20.
- Turnbull DH, Foster FS. Beam steering with pulsed two-dimensional transducer arrays. IEEE Trans Ultrason Ferroelectr Freq Control 1991;38:320–33.
- Hutchinson E, Buchanan M, Hynynen K. Design and optimization of an aperiodic ultrasound phased array for intracavitary prostate thermal therapies. Med Phys 1996;23:767–76.