
Abstract
Objective: Many troops deployed in Iraq and Afghanistan have sustained blast-related, closed-head injuries from being within non-lethal distance of detonated explosive devices. Little is known, however, about the mechanisms associated with blast exposure that give rise to traumatic brain injury (TBI). This study attempts to identify the precise conditions of focused stress wave energy within the brain, resulting from blast exposure, which will correlate with a threshold for persistent brain injury.
Methods: This study developed and validated a set of modelling tools to simulate blast loading to the human head. Using these tools, the blast-induced, early-time intracranial wave motions that lead to focal brain damage were simulated.
Results: The simulations predict the deposition of three distinct wave energy components, two of which can be related to injury-inducing mechanisms, namely cavitation and shear. Furthermore, the results suggest that the spatial distributions of these damaging energy components are independent of blast direction.
Conclusions: The predictions reported herein will simplify efforts to correlate simulation predictions with clinical measures of TBI and aid in the development of protective headwear.
Introduction
The annual incidence of traumatic brain injury (TBI) in the US has been estimated at 1.4 million, accounting for one third of all injury-related deaths [Citation1]. As a result of the wars in Iraq and Afghanistan, the incidence of head injuries in the US armed forces has been on the rise. While US troops deployed in Iraq and Afghanistan today wear some of the most advanced armour in the world, dramatically improving their survivability, the rates of other non-fatal, yet debilitating injuries have inevitably risen [Citation2].
Recent combat statistics report that, since 2000, over 267 000 US soldiers deployed worldwide have sustained TBI, with over 48 000 of those categorized at the moderate-to-severe level [Citation3]. Furthermore, a significant number of those injuries were a result of blast. In fact, reports indicate that 69% of the soldiers returning from theatre and screening positive for TBI were caused by blast [Citation4, Citation5]. The principal source of these blast-induced brain injuries was one or more encounters with the blast wave produced by a detonated improvised explosive device (IED). Injuries sustained from blast exposure have been categorized into three major types; primary, secondary and tertiary [Citation6]. Primary blast injury is associated with direct exposure of the head and body to the blast wave. Secondary blast injury is caused whenever debris is launched into the individual, whereas tertiary blast injury results from the victim being thrown into stationary objects by the blast. The role of primary blast exposure in the development of TBI is not well understood and is the focus of this work.
Modelling and simulation-based investigations into the causal relationship between explosive blast and TBI have recently begun to appear in the literature [Citation7–9] in response to blast-related injuries experienced by US military personnel. These studies were based on partial models of the head that principally consist of the cranium and its contents. The studies demonstrated the usefulness of employing a modelling and simulation approach in the investigation of blast-induced brain injuries. In an earlier study [Citation7], researchers identified the significance of early-time intracranial wave motion in the development of TBI that occurs well before any ensuing head accelerations or rotations. However, these studies also revealed the need for refinement and completion of the virtual head models; specifically, the addition of the lower face and neck structures. To be useful as a tool to investigate the effectiveness of helmet design in blast protection, studies employing helmet models in virtual blast scenarios must also be undertaken. Some work has already been reported in this area [Citation10–12]. Specifically, these studies focused on the blast mitigation effectiveness of helmet designs based on the Army Advance Combat Helmet (ACH).
This paper presents a modelling and simulation investigation into the relation between blast exposure and the resulting intracranial wave motion as it relates to TBI. Specifically, this study is aimed at investigating the mechanisms by which blast wave energy deposits within the human brain and contributes to the development of TBI. In fact, simulations will show that significant shear and dilatational energies develop in the brain in very short time intervals, within 4–5 milliseconds, after blast wave exposure. These energies are not randomly distributed but, rather, develop in specific locations of the brain independent of the direction of blast wave origin.
Our work also includes a clinical research component in which military personnel suffering from blast-induced brain injury are assessed by means of magnetic resonance imaging analysis and neuropsychological testing. The ultimate goal of this work is to establish a correlation between simulation predictions of energy deposition in the brain and the spectrum of focal brain injury observed in the clinical subjects displaying TBI as a result of blast exposure. However, the efforts to correlate prediction with clinical outcomes of TBI are not within the scope of the current paper, but will be reported in a future publication.
The remainder of this paper is organized as follows. Section 2 describes the modelling and simulation methodology including a detailed description of the head–neck model developed and the simulation codes employed for this study. It includes a brief description of the effort to validate the constitutive models and simulation methods against in vivo magnetic resonance tagging data of brain displacement resulting from impulsive loading. Section 3 presents simulation results investigating the influence of blast direction on the spatial distribution of wave energy, deposited within the brain, during blast events typical of IED explosions. This section identifies three distinct wave energy components, two of which are associated with localized brain injury-inducing mechanisms, namely cavitation and shear. Section 4 presents a discussion of the methodology and simulation results, how they compare with those of previous investigations and their significance in advancing understanding of blast-induced TBI. Finally, section 5 presents a summary of work and describes how the current effort fits into the broader plan to correlate simulation predictions with clinical measures of mild traumatic brain injury (mTBI).
Modelling and simulation methodology
Head–neck model
This study has constructed a head–neck model based on the National Library of Medicine’s Visible Human dataset [Citation13] using 256 1 mm-thick anatomical axial slices of the human male starting from the base of the neck to the top of the head. The model possesses anatomically correct distributions of bone, white and grey brain matter, falx and tentorium membranes and cerebral spinal fluid (CSF). The musculature and scalp are represented as one material in this geometric representation (see ).
Figure 1. Finite volume version of Head-Neck model. Top: front, rear, and left side views. Bottom: coronal, axial, and mid-sagittal cuts showing internal structure.
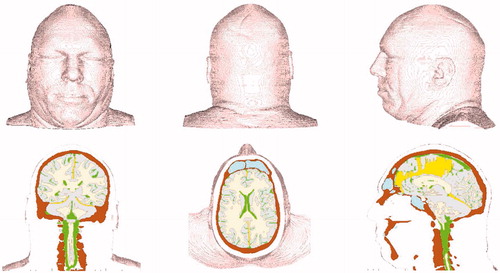
The head–neck model exists in both finite volume and finite element versions. The finite volume representation has been built specifically for import into the Eulerian wave physics code CTH [Citation14]. The finite element version can be imported into any Lagrangian or coupled Lagrangian-Eulerian wave code. However, to simulate blast loading, the wave code must be capable of simulating fluid–solid interactions.
The head–neck model consists of roughly 5.9 million cubic elements, each with a volume of one cubic millimetre. Although the model represents an 80th percentile male, the model’s brain volume is typical of a 50th percentile individual. Specifically, the brain model displays a volume of 1.41 litres. Material properties of the head–neck model include those for bone, white and grey matter, falx and tentorium membranes, cerebral spinal fluid and muscle-scalp. These properties are incorporated into a set of engineering constitutive models that represent the dynamic mechanical response for each material.
This simulation method employs various equation-of-state (EOS) and constitutive models representing the six constituents of the head–neck model and the surrounding air. In what follows, the models used to represent the constituents of the head–neck model and the surrounding air are briefly described.
The bone material is represented by a compressible, linear elastic perfectly plastic strength model and an accumulated strain-to-failure fracture model, fit to material properties data reported by Zhang et al. [Citation15] and Carter [Citation16] for cortical bone. The models describing volumetric and shear response of the skull are commonly understood and should require no further explanation. However, the failure model warrants further description where, in particular, a strain-to-failure fracture model is employed. This model introduces a damage variable D that is defined according to the relation
where
is the equivalent plastic strain, continuously updated at each time step, and
denotes the critical value of equivalent plastic strain at fracture. D = 0 denotes undamaged bone, whereas failure is considered to have occurred whenever D reaches the value of 1. The damage variable is calculated for each material point in the bone at every time step, degrading both the plastic yield strength Y and fracture stress
of the material in the following manner:
where Yo and
denote values of yield and fracture stress, respectively, for undamaged bone. For the skull material properties, data reported by Carter [Citation16] have been selected in which Yo = 95 MPa,
= 77.5 MPa and
= 0.008. The equivalent plastic failure strain was determined from Carter’s data which showed a total failure strain of 0.016 (elastic plus plastic components) and a yield strain of 0.008. The plastic strain at failure is determined to be the difference between the two. The complete list of material property values for the skull is listed in .
Table I. Elastic and fracture material properties of constituents comprising head–neck model.
The white and grey brain matter are considered compressible, viscoelastic materials and assigned model representations similar to those proposed by Zhang et al. [Citation15]. Specifically, these two materials are represented by distinct, compressible elastic equation-of-state models for the volumetric response and by separate 3-term Maxwell viscoelastic models for their respective deviatoric (shear) response. The time-dependent shear modulus of these brain tissues is represented by the equation
where t denotes time,
is the short-term shear modulus,
is the long-term modulus and β denotes a viscous decay constant for the material. As reported by Zhang et al. [Citation15], the form for the shear modulus function and its parameters were determined based on in vitro data obtained from vibration tests on human brain tissue [Citation17]. The values of density and bulk moduli for these tissues in the current study were also taken from those specified by Zhang et al. [Citation15] as being the most accurate. However, the viscoelastic decay constants for the white and grey matter turned out to be too large when attempting to match the experimental data of Bayly et al. [Citation18] and Feng et al. [Citation19] during model validation. Consequently, β was decreased for these materials from 700 per second to 40 per second in order to provide the best match to that data. The viscoelastic properties for the white and grey matter are listed in .
Table II. Viscoelastic material properties of white and grey brain tissue.
The falx and tentorium membranes which partition the brain, as well as the scalp and muscle tissue, are represented by compressible elastic models employing the material properties reported in Zhang et al. [Citation15]. These properties are also listed in .
In order to simulate blast, air must be represented in the simulations. Air envelops the head–neck model at ambient conditions, occupies the nasal cavity and various sinus spaces and transmits the blast wave. This study has employed a non-linear, tabular equation-of-state representation for a dry air mix of N2 (78.09%), O2 (21.95%) and Ar (0.96%), reference density of 1.218e-3 g/cc, specifically designed for shock wave simulations [Citation20].
In summary, biological material models were selected based on their accuracy and relevance to the problem at hand. Whenever possible, models were employed that have been validated against the experimental data of Nahum et al. [Citation21], Bayly et al. [Citation18] and Feng et al. [Citation19], which involve impulsive loading to the head.
Simulation codes
This study employs two simulation methods, each chosen for its relevance to the problem at hand. The blast simulations are performed using the shock wave physics code CTH [Citation14]. CTH is an Eulerian finite-volume computer simulation code that is capable of tracking 20+ materials simultaneously, simulating their interactions as they undergo impact, blast loading and penetration. This code adequately captures the fluid–solid interactions that occur between the pressurized air and the head–neck model.
To validate the models, the Sandia code PRESTO [Citation22] was used to simulate the magnetic resonance tagging experiments of Bayly et al. [Citation18] and Feng et al. [Citation19]. PRESTO is a Lagrangian finite element transient dynamics code more appropriate to simulating solid–solid interactions as well as material behaviour in response to time-dependent kinematic boundary conditions. Both CTH and PRESTO possess an extensive array of constitutive models with which to represent bone, biological tissue and both the ambient and pressurized air used in the simulations.
Model validation
In simulating the response of the human head to impulsive loads, one of the greater concerns is how well the mechanical response of living tissue is represented. Model validation is a means by which one can assess the accuracy of the EOS and constitutive model representations. Recent work of Bayly et al. [Citation18] and Feng et al. [Citation19], at the Washington University in St. Louis, has employed magnetic resonance image (MRI) tagging techniques to measure time-dependent displacement fields in the brains of healthy human volunteers subjected to impulsive head motion. In their research, volunteers’ heads were placed in one of two different fixtures that impart a mild impulsive load to the head. The first set of experiments used a fixture which imposed an angular acceleration by rotating the head from one side to the other, ending with a hard stop. The second set of experiments employed a fixture that imposed a linear acceleration, approximating a mild impact to the forehead. Here, the head was permitted to vertically drop face forward for a brief distance until it was abruptly stopped by restraining straps. After repeated impulsive loadings, the researchers collected a sufficient amount of data from their experiments to create time-resolved displacement fields at a network of points in selected geometric slices of the brain. The displacements at these points were used to calculate the strains that occurred in each of the slices.
The results of the Bayly et al. [Citation18] and Feng et al. [Citation19] experiments, conducted on human tissue in vivo, provided excellent data with which to fine-tune and validate the constitutive models for the biological tissues comprising the brain. This was done by simulating the MRI tagging experiments with PRESTO using the finite element version of the head–neck model and comparing these results against those of the experiments. This study matched the rotation experiment results of Bayly et al. [Citation18] only after fine-tuning the viscoelastic properties of the white and grey matter in the constitutive models for these materials. In particular, the original values for the viscoelastic decay constants of the white and grey matter turned out to be too large when one attempted to simulate the impulsive rotation experiments. Consequently, the decay constant β was decreased for these materials from 700 per second to 40 per second in order to provide the best match to that data.
Once the white and grey models were corrected, the linear impulsive experiments of Feng et al. [Citation19] were then simulated. Although there was a fair amount of variation in displacement history exhibited by the experimental data, these simulations predicted displacements which were nicely bracketed by the experimental data. Page length restrictions preclude one from presenting the details of the validation exercise here. However, suffice it to say that the modelling and simulation methods have been validated to the extent that one can demonstrate a sufficient degree of accuracy in predicting intracranial stress wave mechanics during impulse loading events to the head. However, as additional in vivo data becomes available, one will continue to fine-tune and validate the models for greater accuracy.
Simulation of blast scenarios
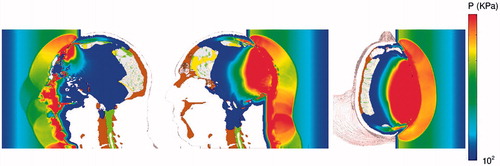
This study conducted simulations of direct blast exposure of the head–neck model from three directions, front, rear and lateral (right side) (see ).
Figure 2. Stop-action plots of blast-induced pressure waves propagating through the head from the front (left), rear (center), and lateral (right) directions.
Originally, blast conditions were selected consisting of 1.35 MPa (13.5 bar) peak amplitude and a pulse width of 0.6 milliseconds, which were within the marginal limits for threshold lung damage, as defined by the corrected Bowen survivability curve for primary blast injury [Citation23] (see ). These conditions were chosen for two reasons. First, they were similar to those predicted to occur at a location roughly 3 metres distant from a detonated explosive device constructed from a 3 kg charge of Octol explosive. Second, they represented a limiting case for blast exposure predicted to be survivable by the Bowen lung damage criterion. However, for this blast condition, the results predicted that this strong of a blast generated intracranial stress and energy levels that were too great to be associated with mild traumatic brain injury (mTBI), the severity of brain injury displayed by this clinical TBI subject group.
Figure 3. Plot of the conditions associated with the 1.35 MPa and 360 KPa (13.5 and 3.6 bars) blast pulses showing their proximity to the Bowen curve for threshold lung damage and its correction.
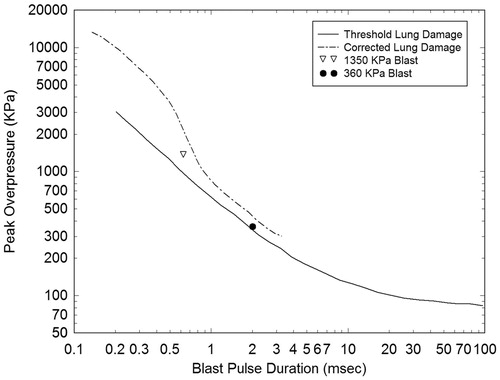
As an alternative, blast conditions were selected that would be less damaging to facial bone structure and more in line with conditions leading to mTBI but still close to the limits for threshold lung damage. Furthermore, since this study was interested in conditions that a warfighter might experience during exposure to IED detonation, a blast history was selected that would result from a 2.3 kg charge of Composition-4 (C-4) located 2.3 metres from the head–neck model. This explosion produces an air blast of magnitude 360 KPa (3.6 bars) with a pulse width of 2.0 milliseconds as it encounters the head–neck model. A profile of this blast pulse is displayed in . Both the 1.35 MPa and 360 KPa blast pulses are plotted in , showing their proximity to the Bowen curve for threshold lung damage and its correction [Citation23].
Figure 4. Pressure pulse defining a 360 KPa (3.6 bars) blast wave.
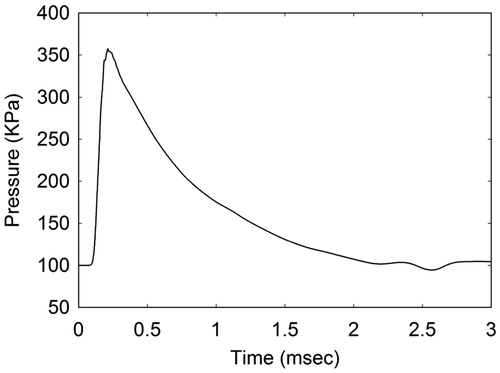
The blast simulations were performed by positioning the head–neck within an environment of air at ambient conditions. To create the blast wave, this study introduced a slab of energized air, held at conditions of elevated energy and pressure and positioned ∼16 cm from the head at time zero. The back face of the air slab is fixed by a rigid boundary, whereas the front face, closest to the head–neck model, is removed for times greater than zero. Once this happens, air mass flows from the energized slab, creating a pressure pulse that propagates in the direction of the head–neck model. The amplitude and pulse width of the blast wave is determined by setting the energized air to pre-defined conditions of energy, pressure and slab thickness. By the time the pressure pulse reaches the head, its amplitude has degraded to a magnitude of 360 KPa, possessing the time history appearing in . A typical blast simulation with the head–neck model required 31 cpu-hours per millisecond of simulated time using 96 processors on the Sandia National Laboratories Red Sky computer system.
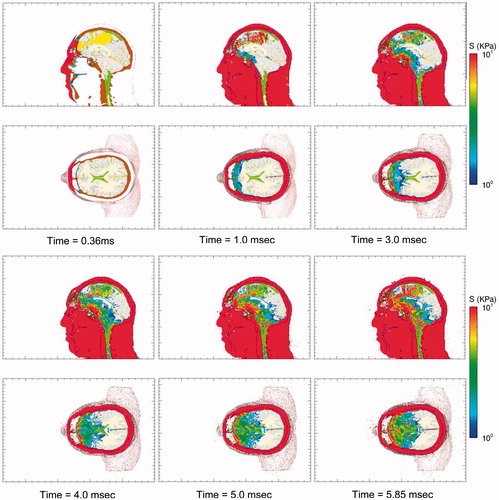
displays a series of time-lapse images of pressure as the blast wave interacts with the head–neck model, generating pressure waves that propagate through the scalp, skull and into the brain. This wave action is rather quick, with the pressure waves propagating into the brain and dissipating within the first 2 milliseconds of exposure. Since the biological materials comprising the head also support shear, the blast wave generates shear waves that propagate through the head at speeds slower than that of the pressure waves. A set of time-lapse images of the deviatoric (shear) stress are plotted in . The reader will notice that the deviatoric stresses develop over the full course of the simulations, reaching their maxima ∼5–6 milliseconds. Deviatoric stress, also known as von Mises effective stress, causes distortion (shear) without a change of volume.
Figure 5. Time-lapse images of frontal blast exposure showing pressure in the mid-sagittal and supraorbital axial planes of the head-neck model. Upper pressure limit is 500 KPa. Regions without color are at or below the threshold pressure of 100 KPa (1 bar).
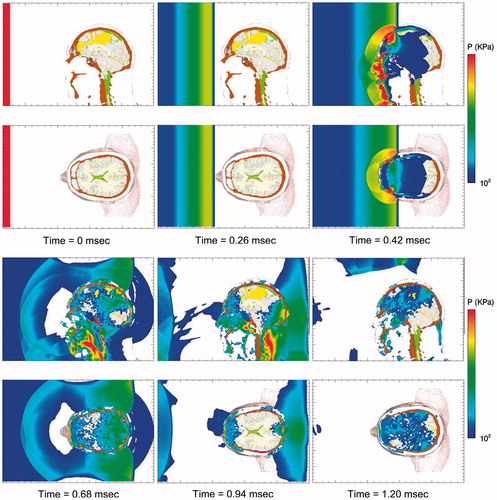
Figure 6. Time-lapse images of frontal blast exposure showing deviatoric shear stress levels in the mid-sagittal and supraorbital axial planes of the head-neck model.
To begin to understand the causal relation between blast exposure and TBI, one must at least investigate the influence of blast direction as it leads to various measures of brain injury. As already stated, blast loading of the head–neck wa simulated, exposing it to a 360 KPa (3.6 bars) blast wave from the front, side and rear directions. By doing so, one was able to study the spatial variations of stress wave magnitude and energy deposition within the brain as a consequence of blast direction. In this vein, it was found more useful to interpret the results of the simulations by monitoring the spatial distributions of stress and energy maxima experienced throughout the brain over the full course of the blast event. In the authors’ opinion, the stress and energy maxima may be the most likely wave physics variables that will correlate with localized brain injury. Furthermore, it is the authors’ contention that wave energy, rather than stress magnitude, may be the more useful wave physics variable to correlate with localized damage. The following argument is presented to support this hypothesis.
displays the maximum compressive and tensile pressure, deviatoric stress and their associated energies in the mid-sagittal plane for the 360 KPa frontal blast. These are plots of the maximum values of stress and energy that have occurred over the 5 millisecond duration of the simulation. reveal focal regions in the brain experiencing significant levels of pressure and deviatoric stress during the blast event. Specifically, maximum levels of 1000 KPa compressive pressure, 200 KPa of tensile pressure and 20 KPa of deviatoric (shear) stress are predicted to occur in various regions of the brain before the onset of any significant head accelerations. In fact, simulations predict that the intracranial stress waves have propagated and focused within the brain before the head moves 3–4 mm in response to the blast. The associated energy distributions are displayed in . Specifically, display the maximum isotropic compressive energy, maximum isotropic tensile energy and the maximum deviatoric (shear) energy, respectively, which have occurred over the duration of the simulated event. Isotropic compressive energy is associated with volumetric crush, whereas isotropic tensile energy is associated with dilatation, a kinematic condition that can give rise to cavitation, hypothesized by some researchers to cause brain damage [Citation24–26]. Deviatoric energy is associated with shearing that can lead to brain injury due to the tearing and/or disruption of neuronal cytoskeleton structures on a microscopic level [Citation27].
Figure 7. Plots of maximum stress and energy in the mid-sagittal plane for a 360 KPa frontal blast. (a) Maximum compressive pressure (blue: 0.1 MPa; red: 1 MPa) and (b) corresponding isotropic compressive energy (blue: 1 J/m3; red: 300 J/m3). (c) Maximum tensile pressure (blue: 1 KPa; red: 200 KPa) and (d) corresponding isotropic tensile energy (blue: 1 J/m3; red: 200 J/m3). (e) Maximum deviatoric shear stress (blue: 0.1 KPa; red: 20 KPa) and (f) corresponding deviatoric energy (blue: 1 J/m3; red: 300 J/m3). Plot variable levels increase from blue (minimum), green, yellow, to red (maximum). Black denotes that the plot variable max limit has been exceeded.
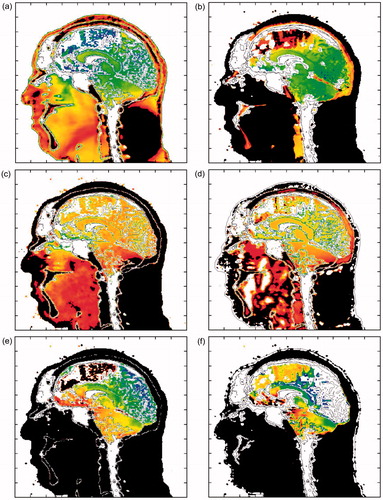
For the 360 KPa frontal blast simulation shown in , the brain experiences focal regions of compressive isotropic energy on the order of 300 J m−3, tensile isotropic energy levels of 200 J m−3 and shear energy levels of 300 J m−3. Furthermore, the simulations predict greater spatial variation in the maximum energy distributions throughout the brain than are displayed by their stress counterparts. This result is illustrated in the plots of maximum stress and associated energy distributions appearing in . This is particularly true for the isotropic compressive energy when compared to pressure, but somewhat less for the isotropic tensile and deviatoric (shear) energies vs their respective stress counterparts. It is important to note that these energy quantities take into account not only the stress level, but also its deformation complement. In the simulations, these energy variables are determined using the following relations:
where P denotes pressure (positive in compression), ρ is mass density, S and d the deviatoric stress and rate of deformation tensors (i.e. matrices), respectively. The deviatoric stress power term
denotes the trace of the tensor multiplication of S and d, that is, their scalar product. In index notation, this term is defined as
Isotropic compressive energy is calculated from equation (4) whenever P is positive (compressive), whereas the isotropic tensile energy is determined from equation (4) whenever P is negative (tensile).
Although a simulation may predict a high stress level within the brain, the associated energy level will only be high if the stress has induced a significant deformation. That is, both stress and its associated deformation must be substantial to produce a significant energy level. It is posited that high stress levels alone may not be sufficient correlates to tissue damage and that stress must also be accompanied by a significant deformation in order to create favourable conditions that induce tissue damage. Consequently, the remainder of this paper will use isotropic and shear energies as the principal metrics rather than stress magnitudes when discussing conditions associated with localized brain injury.
Spatial variation of energy deposition
presents a comparison of maximum isotropic compressive energy distributions in the mid-sagittal and axial planes of the head–neck model as a function of blast direction, specifically from the front, rear and right side of the head. compares the maximum isotropic tensile energy distributions from the front, rear and side blast simulations for the same anatomical planes in the head–neck model. Finally, displays the maximum deviatoric (shear) energy distributions for the three blast directions.
Figure 8. Maximum Isotropic Compressive Energy for a 360 KPa blast. Top row: Frontal blast, mid-sagittal and axial planes; middle row: rear blast; bottom row: right side blast, mid-coronal and axial planes. Color scale: blue: 1 J/m3; red: 300 J/m3, black denotes that the plot limit has been exceeded. Positive energy is associated with compressive loading.
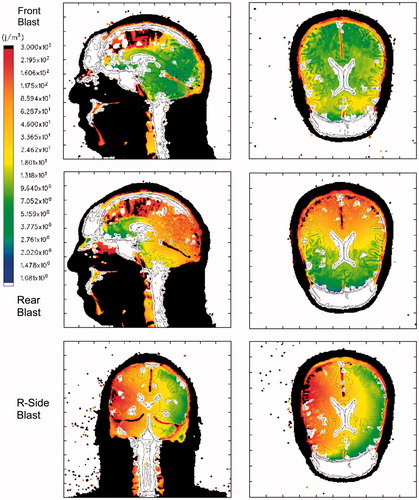
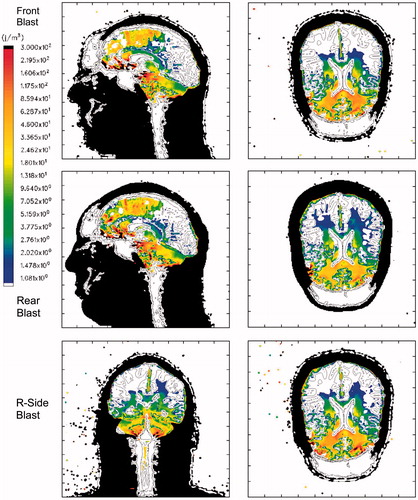
Figure 9. Maximum Isotropic Tensile Energy for a 360 KPa blast. Top row: Frontal blast, mid-sagittal and axial planes; middle row: rear blast; bottom row: right side blast, midcoronal and axial planes. Color scale: blue: −1 J/m3; red: −200 J/m3; black denotes that the plot limit has been exceeded. Negative energy is associated with tensile loading.
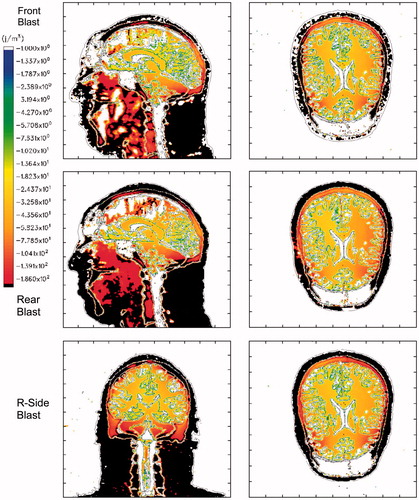
Figure 10. Maximum Deviatoric Energy for a 360 KPa blast. Top row: Frontal blast, mid-sagittal and axial planes; middle row: rear blast; bottom row: right side blast, mid-coronal and axial planes. Color scale: blue: 1 J/m3; red: 300 J/m3, black denotes that the plot limit has been exceeded. Deviatoric energy is always positive.
The plots in suggest that a significant amount of isotropic compressive energy, associated with crush, is deposited in the upper frontal lobes of the brain during frontal blast, in the occipital lobes for rear blast and in the right temporal lobe for right-side blast. This is consistent with the coup–contrecoup hypothesis that assumes the brain regions closest to and farthest from the injury source (i.e. blast) will suffer the most damage. For example, in the frontal blast scenario, the coup site will be the frontal region of the brain, whereas the contrecoup site is the occipital (rear) region. The opposite holds for rear blast in which the coup site is the occipital region and the frontal region acts as the contrecoup site. For the right-side blast, as seen in the bottom-row plots of , the right temporal lobe acts as the coup site and the opposite (left) temporal lobe is the contrecoup site.
suggests that the isotropic tensile energy, associated with dilatation, is higher in the outer cerebral regions, the upper brain stem and in the cerebellum. This result holds for all three blast directions and runs contrary to the coup–contrecoup hypothesis. If one takes into account the higher levels of compressive energy that occur at the coup site and the tensile energy levels that also occur at that site, regardless of blast direction, it is seen that the brain tissue at that site can undergo a significant compression-to-dilatation swing in isotropic energy. This compression-to-dilatation swing may, in fact, lead to the cavitation process that has been hypothesized to occur in the brain under certain types of impulsive loading [Citation24–26].
suggests that these simulations predict concentrated levels of deviatoric energy, associated tissue distortion and tearing, in the frontal brain region as well as the upper brain stem and cerebellum. This prediction appears, for the most part, to be independent of blast direction. If the work of Zhang et al. [Citation28] is correct in its correlation of mild brain injury with shear stresses greater than 4–5 KPa in the thalamus (corresponding to shear energy ≥200 J m−3), then these simulations predict that brain injury may in fact occur in the frontal region, upper brain stem and cerebellum, for a blast of 360 KPa or greater, regardless of blast direction.
Influence of blast direction
The isotropic compressive energy distributions, plotted in , vary as a function of blast direction, where greater energy deposition occurs in the region of the brain closest to the blast source. Thus, isotropic compressive energy deposition is greatest in the frontal brain lobes for the frontal blast, in the occipital region for rear blast and right temporal lobe for right side blast. However, the same dependence on blast direction does not appear to be the case for the isotropic tensile energy or deviatoric energy, as seen in and , respectively.
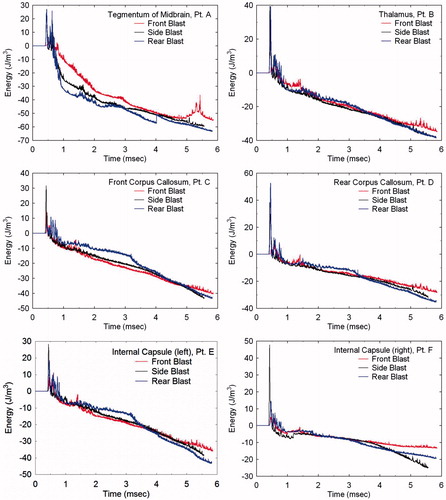
To further investigate the dependence of wave energy deposition as a function of blast direction, Lagrangian tracer points were placed at various locations in the brain (see ). These include the tegmentum of mid-brain (point A), thalamus (point B), corpus callosum (points C and D) and the internal capsule (points E and F). By plotting the energy histories at these locations for the three blast directions, one can quantitatively assess their dependence on blast direction. displays the isotropic energy plots at these locations in which the early-time positive values, reflecting the initial compression, are followed by negative energy values denoting dilatation. The reader should notice that the maximum compressive energy values are strongly dependent upon blast direction. However, the tensile energy values are comparatively independent of direction, as reflected by the fact that the tensile portions of the plots, for each location, nearly overlay one another.
Figure 11. Lagrangian tracer locations. A: Tegmentum of Midbrain; B: Thalamus; C and D: anterior and posterior Corpus Callosum; E and F: left and right Internal Capsule.
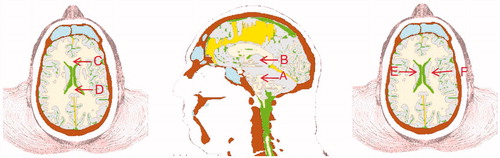
Figure 12. Comparisons of isotropic energy as a function of blast direction for locations A through F in the brain.
shows the deviatoric (shear) energy histories for the same locations as a function of blast direction. Here, independence of deviatoric energy with respect to blast direction is not as obvious in these plots. However, by calculating the difference between each energy component (i.e. compressive, tensile or deviatoric) relative to a mean energy history for each location, one can distinguish between dependence and independence of the respective energy component on blast direction. displays the normalized RMS difference between each energy component relative to a mean energy plot over the duration of simulation time for the various Lagrangian tracer locations.
Figure 13. Comparisons of deviatoric energy as a function of blast direction for locations A through F in the brain.
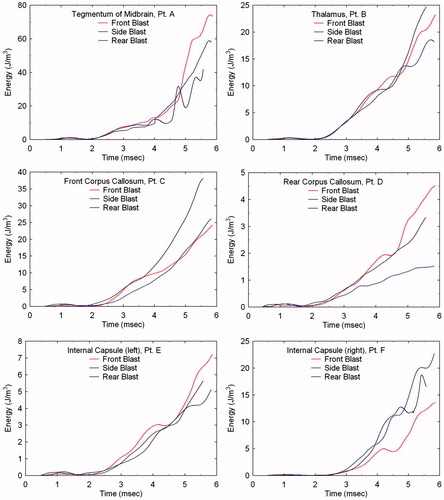
Figure 14. Normalized RMS difference of isotropic compressive and tensile energies and deviatoric energy as a function of blast direction for locations A through F in the brain. The dashed line at RMS Difference = 1 distinguishes dependence (>1) from independence (<1) on blast direction.
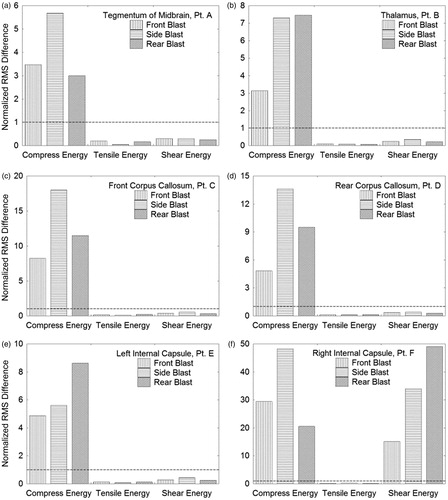
RMS values greater than 1 suggest dependence on blast direction, whereas values less than 1 suggest independence. confirm that the isotropic compressive energy is strongly dependent on blast direction (compressive energy RMS differences >1), while the isotropic tensile energy is independent of direction (tensile energy RMS differences 1). demonstrate independence of the deviatoric energy on blast direction, whereas contradicts this trend. However, to date, no other locations in the brain have been found where this dependency is displayed.
Discussion
This paper has described an effort to develop a high resolution digital model of the human head and the computational simulation methodology with which to investigate the relationship between impulsive loading to the head and traumatic brain injury. The constitutive models have been fine-tuned and validated against in vivo magnetic resonance tagging data collected on living human subjects as they were exposed to angular and linear impulsive loading to the head. The head–neck model used in this investigation is perhaps the most comprehensive model developed to date for head trauma simulation. Models used in previous investigations have either been incomplete, missing mandible and/or neck structures [Citation7–9, Citation12], not sufficiently differentiated, displaying homogeneous brain structure [Citation10] or not equipped to capture the time-dependent rheological response of brain tissue [Citation8, Citation9]. This work constructed a complete model of the head and neck, possessing 1 mm resolution to capture the influence of the heterogeneous nature of the brain, including white matter, grey matter, cerebral spinal fluid/sinus blood and the membrane structures partitioning the brain (falx and tentorium). By representing as much brain structure as possible at comparatively high resolution, the intent was to capture as much detail of the intracranial wave mechanics as was computationally feasible.
Blast loading to the head was simulated from three distinct directions, front, rear and side, with a single blast wave of magnitude 360 KPa (3.6 bars). These conditions are associated with threshold lung damage according to the Bowen data reported in Gruss [Citation23]. The results of these simulations predicted that the early-time wave energy deposition, resulting from blast exposure to the head, displayed spatial variation within the brain. This variation was shown to be distinctly different for three principal energy quantities. That is, the isotropic compressive energy associated with crush, the isotropic tensile energy associated with dilatation and the deviatoric energy associated with shear. Although evidence has not yet been found that isotropic compressive energy can be correlated with brain damage, there are a number of investigations that support the idea that isotropic tensile energy deposition, associated with dilatation, will lead to cavitation and possible brain damage [Citation24–26]. In addition, there is sufficient evidence to suggest that deviatoric energy, associated with shearing, will lead to brain damage through tissue tearing and neuronal cytoskeleton disruption [Citation15, Citation28].
These simulations have shown a dependence of the isotropic compressive energy and an independence of isotropic tensile energy on blast direction. The calculations also suggest that deviatoric energy, for the most part, is independent of blast direction. However, it is important to remember that this study has focused on the early-time (≤6 millisecond) intracranial wave motions within the brain. Although these results show independence of the isotropic tensile energy and deviatoric energy to blast direction, each of which can be associated with brain damage through cavitation and shear, respectively, one cannot say with certainty that these energies will be independent of blast direction at times longer than those considered here, i.e. greater than 6 milliseconds. The prediction that isotropic compressive energy is dependent on blast direction agrees with the results of Grujicic et al. [Citation9] (p.350) who found that the ‘spatial variations of pressure and its temporal evolution appear to be more related to blast-impact location rather than to the components of the brain’. However, the prediction that the isotropic tensile energy and tensile pressure are independent of blast direction runs contrary to their conclusion.
In the course of running the simulations out to greater than 5 milliseconds, it was found that the viscoelastic response of the brain tissue generated significant levels of deviatoric shear stress and energy, which were focused in the frontal lobes, upper brain stem and internal capsule of the brain. In fact, the simulations predicted shear stress levels within the thalamus that were above the threshold levels identified by Zhang et al. [Citation28] to be associated with concussion. In the papers by Moore et al. [Citation8] and Grujicic et al. [Citation9], they reported levels of shear stress that were significantly less than Zhang et al.’s concussion threshold. In the authors’ opinion, this was due to the fact that the researchers did not model the time-dependent rheological response of the brain. This oversight was corrected in the subsequent work by Nyein et al. [Citation12], where they employed a viscoelastic representation for the brain. However, their prediction of von Mises effective stress magnitudes as high as 6 MPa in the cerebrum appear to us to be exceedingly high, even for a 1.0 MPa (10 bars) blast. In a previous investigation [Citation7], these magnitudes were found to be no greater than 25 KPa for a 1.2 MPa (12 bars) blast, regardless of blast direction. In view of the fact that shear stress and its associated deviatoric energy can be correlated to brain injury, accuracy in predicting these quantities should be of paramount importance. As such, it is suggested that further validation of rheological models describing deviatoric response of brain tissue be undertaken.
In these simulations of blast exposure, it was found that the principal mechanism of stress loading and energy transfer into the brain was by means of wave transmission through the scalp and skull. These simulations revealed a 3-fold increase in wave amplitude as the wave traversed the skull before entering the brain (ignoring intervening sinus cavities). This effect was more pronounced for the rear and side blast scenarios where there are no sinus cavities to degrade wave transmission, as in the case for frontal blast. The wave amplitude magnification is caused by the acoustic impedance mismatch between the air, scalp and skull. That is, as the impedance increases from that of air to scalp and then to skull, the net result is a stepwise magnification of the compressional wave amplitude. As the wave enters and begins to transit the brain, it encounters material interfaces that exist between the brain and its membranes (falx and tentorium) as well as those between the brain and the internal surfaces of the skull. The presence of these interfaces causes multiple wave reflections and transmissions, leading to localized regions in the brain that experience extremes in compressive and tensile pressure and energy as well as extremes in the deviatoric shear stress and its energy. Although these simulations did predict skull deformation, the rippling motion along the skull that was predicted to occur by Moss et al. [Citation10] was not observed. In that work, the authors suggested that the mechanical loading of the brain was caused by skull flexure from the blast. The results, however, suggest that direct wave transmission across the scalp and skull is the primary means of mechanical loading of the brain due to blast loading.
In comparing the predictions of compressive wave transmission into the brain from the three blast directions, it was noticed that the wave amplitude was significantly reduced for the frontal blast relative to that for the rear or side blast scenarios. The reason for this is primarily due to the fact that the forehead structure of the model, associated with the frontal bone of the skull, possesses a large sinus cavity (see , lower middle and right images). In particular, as the compressive wave enters the brain during the rear and side blast scenarios, its amplitude is 800 and 900 KPa, respectively, whereas for the frontal blast, its amplitude is 300 KPa. This fortuitous design of nature suggests that void spacing, placed within protective headwear, may aid in mitigating brain injury from impulsive loads to the head.
The fact that these simulations do not universally predict dependence of energy deposition on blast direction comes as a pleasant surprise. Since it has been demonstrated or hypothesized that brain damage is associated with cavitation and shear, the simulations suggest that these damage mechanisms will not be dependent upon blast direction. If these predictions hold true, for both the early-time intracranial wave motions and the longer time-scale motions of the head, then this result will simplify efforts to correlate simulation prediction with clinical measures of TBI. Furthermore, this result will be of significance to helmet designers tasked with producing new designs to protect the wearer against blast.
Conclusion
This study has demonstrated the ability to simulate blast loading to the human head as it could lead to traumatic brain injury. However, this study has not discussed just how one makes the connection between modelling and simulation of injury scenarios and the clinical measurement of brain injury. In the authors’ opinion, what remains to be accomplished is the correlation of simulation prediction with clinical measures of brain injury. In this instance, the following question needs to be answered. Which wave physics variables most directly correlate to quantitative measures of brain injury and at what magnitudes do these variables correlate with threshold conditions associated with mild and moderate traumatic brain injury? At this point in time, it is felt that the energy quantities discussed in this paper may be the most appropriate variables to correlate with clinical brain injury metrics. If the authors are correct in this regard, what remains to be accomplished is a determination of the specific levels of these energies that correlate with threshold conditions for localized brain injury. This issue defines the path for future research.
The next step in this research is to employ the modelling and simulation tools to positively identify which wave physics variables most readily correlate with localized brain injury. Here, the hope is to identify the specific magnitudes of these variables that define threshold conditions for mild traumatic brain injury (mTBI). The authors have already begun this work by recruiting mTBI test subjects who have sustained brain injury exclusively from blast exposure. These studies considered mild TBI after blast exposure to include brief loss of consciousness with cognitive sequelae as well as cases with acutely impaired brain function (e.g. confusion, amnesia, slurred speech) without reported loss of consciousness. The latter description is sometimes defined as ‘concussion’, but is considered part of the spectrum of mTBI.
The mTBI group were subjected to neuropsychological testing, magnetic resonance imaging (MRI), diffusion tensor imaging (DTI) [Citation29] and functional magnetic resonance imaging (fMRI) [Citation30]. The results of the neuropsychological testing have revealed significant impairments of the mTBI group, whereas an independent component analysis (ICA) [Citation31] of their fMRI data has identified localized regions of the brain exhibiting activity levels that are either significantly elevated or depressed relative to a normal control population. Further ICA results on the fMRI data reveal that functional connections between specific network pairs, within the brains of the TBI subject group, were significantly weaker than those of the normal control population. The results of this clinical investigation on the mTBI group have been compiled and are reported in a separate article [Citation32].
This research suggests that there is, at least, a similarity of regions predicted to experience elevated levels of deviatoric energy with localized sites of altered brain activity identified in the mTBI group. If so, the next step will be to establish a quantitative correlation between predictions of energy deposition and the spatial extent and connectivity of functional networks in persons displaying abnormal brain activity as a result of brain injury from blast exposure. The results of this effort will be reported in a future publication.
Declaration of interest
This work is funded through the US Naval Health Research Center, Office of Naval Research, Mr James Mackiewicz, project funding manager. Sandia National Laboratories is a multi-programme laboratory managed and operated by Sandia Corporation, a wholly owned subsidiary of Lockheed Martin Corporation, for the United States Department of Energy’s National Nuclear Security Administration under contract DE-AC04-94AL85000. The authors report no conflicts of interest.
Acknowledgements
The authors acknowledge the National Library of Medicine and the Visible Human Project as the source of the Visible Human Data Set used to construct the digital head–neck model employed in this research. The authors are indebted to Professor Philip Bayly and his research team at Washington University, St. Louis MO, in providing magnetic resonance tagging data with which to validate our models.
References
- Centers for Disease Control and Prevention. Traumatic brain injury in the US. Atlanta, GA, USA: National Center for Injury Prevention and Control; 2007. Available online at: http://www.cdc.gov/ncipc/pub-res/tbi_in_us_04/tbi_ed.htm, accessed July 27, 2012
- Okie S. Traumatic brain injury in the war zone. The New England Journal of Medicine 2005;352:2043–2047
- Defense and Veterans Brain Injury Center. DoD Worldwide Numbers for TBI | DVBIC. Silver Spring, MD, USA: Defense and Veterans Brain Injury Center. Available online at: http://www.dvbic.org/dod-worldwide-numbers-tbi, accessed July 5, 2012
- Warden D. Military TBI during the Iraq and Afghanistan wars. Journal of Head Trauma Rehabilitation 2006;21:398–402
- Fischer H. U.S. military casualty statistics: Operation New Dawn, operation Iraqi Freedom, and operation Enduring Freedom. Congressional Research Service. Washington, D.C., USA: Library of Congress; 1991. p 1–8. Available online at: https://opencrs.com/document/RS22452/, accessed July 5, 2012
- DePalma RG, Burris DG, Champion HR, Hodgson MJ. Blast injuries. New England Journal of Medicine 2005;352:1335–1342
- Taylor PA, Ford CC. Simulation of blast-induced early-time intracranial wave physics leading to traumatic brain injury. Journal of Biomechanical Engineering 2009;131:061007
- Moore DF, Jérusalem A, Nyein M, Noels L, Jaffee MS, Radovitzky RA. Computational biology — modeling of primary blast effects on the central nervous system. NeuroImage 2009;47(Suppl 2):T10–T20
- Grujicic M, Arakere G, He T. Material-modeling and structural-mechanics aspects of the traumatic brain injury problem. Multidiscipline Modeling in Materials and Structures 2009;6:335–363
- Moss W, King M, Blackman E. Skull flexure from blast waves: A mechanism for brain injury with implications for helmet design. Physical Review Letters [Internet] 2009;103:108702 (1--4). Available online at: http://link.aps.org/doi/10.1103/PhysRevLett.103.108702, accessed July 5, 2012
- Grujicic M, Bell WC, Pandurangan B, Glomski PS. Fluid/structure interaction computational investigation of blast-wave mitigation efficacy of the advanced combat helmet. Journal of Materials Engineering and Performance 2010;20:877–893
- Nyein MK, Jason AM, Yu L, Pita CM, Joannopoulos JD, Moore DF, Radovitzky RA. In silico investigation of intracranial blast mitigation with relevance to military traumatic brain injury. Proceedings of the National Academy of Sciences 2010;107:20703–20708
- Anon. The National Library of Medicine’s visible human project. Bethesda, MD, USA: U.S. National Library of Medicine; 2007. Available online at: http://www.nlm.nih.gov/research/visible/visible_human.html, accessed January 30, 2013
- Hertel ES, Bell R, Elrick M, Farnsworth A, Kerley G, McGlaun J, Petney S, Silling S, Taylor P. CTH: A software family for multi-dimensional shock physics analysis. Proceedings of the 19th International Symposium on Shock Waves 1993;1:377–382
- Zhang L, Yang KH, King AI. Comparison of brain responses between frontal and lateral impacts by finite element modeling. Journal of Neurotrauma 2001;18:21–30
- Carter DR. Biomechanics of bone. In: Melvin J, editor.: Appleton & Lange. New York, NY, USA: McGraw-Hill; 1984
- Shuck LZ, Advani SH. Rheological response of human brain tissue in shear. ASME Journal of Basic Engineering 1972;94:905–911
- Bayly PV, Clayton EH, Feng Y, Abney TM, Namani R, Okamoto RJ, Genin GM. Measurement of brain biomechanics in vivo by magnetic resonance imaging. In: Proceedings of the Society for Experimental Mechanics Series 2013. Indianapolis, IN: Springer; 2013. p 117–128
- Feng Y, Abney TM, Okamoto RJ, Pless RB, Genin GM, Bayly PV. Relative brain displacement and deformation during constrained mild frontal head impact. Journal of The Royal Society Interface 2010;7:1677–1688
- Hertel ES, Kerley GI. CTH reference manual: The equation of state package. Albuquerque, NM: Sandia National Laboratories; 1998
- Nahum AM, Smith R, Ward CC. Intracranial pressure dynamics during head impact. S.A.E. Proceedings of the 21st Stapp Car Crash Conference, Warrendale, PA; 1977. p 339–366
- SIERRA Solid Mechanics Team. Sierra/SolidMechanics VOTD user’s guide. Albuquerque, NM: Engineering Sciences Center, Sandia National Laboratories; 2011
- Gruss E. A correction for primary blast injury criteria. Journal of Trauma-Injury Infection and Critical Care 2006;60:1284–1289
- Lubock P, Goldsmith W. Experimental cavitation studies in a model head-neck system. Journal of Biomechanics 1980;13:1041–1052
- Brennen CE. Cavitation in biological and bioengineering contexts. In: Proceedings of the 5th International Symposium on Cavitation. Osaka, Japan; 2003
- Nakagawa A, Fujimura M, Kato K, Okuyama H, Hashimoto T, Takayama K, Tominaga T. Shock wave-induced brain injury in rat: Novel traumatic brain injury animal model. Acta Neurochirurgica Supplement 2008;102:421–424
- Strich SJ. Diffuse degeneration of the cerebral white matter in severe dementia following head injury. Journal of Neurology, Neurosurgery, and Psychiatry 1956;19:163–185
- Zhang L, Yang KH, King AI. A proposed injury threshold for mild traumatic brain injury. Journal of Biomechanical Engineering 2004;126:226
- Huisman TAGM, Schwamm LH, Schaefer PW, Koroshet WJ, Shetty-Alva N, Ozsunar Y, Wu O, Sorensen AG. Diffusion tensor imaging as potential biomarker of white matter injury in diffuse axonal injury. American Journal of Neuroradiology 2004;25:370–376
- Biswal B, Yetkin F, Haughton V, Hyde J. Functional connectivity in the motor cortex of resting human brain using echo-planar MRI. Magnetic Resonance in Medicine 1995;34:537–541
- Calhoun VD, Liu J, Adali T. A review of group ICA for fMRI data and ICA for joint inference of imaging, genetic, and ERP data. NeuroImage 2009;45:S163–S172
- Vakhtin AA, Calhoun VD, Jung RE, Prestopnik JL, Taylor PA, Ford CC. Changes in intrinsic functional brain networks following blast-induced mild traumatic brain injury. Brain Injury 2013;27:1304–1310