
Abstract
Objective: Many interventions to reduce allergen levels in the home are recommended to asthma and allergy patients. One that is readily available and can be highly effective is the use of high performing filters in forced air ventilation systems. Methods: We conducted a modeling analysis of the effectiveness of filter-based interventions in the home to reduce airborne asthma and allergy triggers. This work used “each pass removal efficiency” applied to health-relevant size fractions of particles to assess filter performance. We assessed effectiveness for key allergy and asthma triggers based on applicable particle sizes for cat allergen, indoor and outdoor sources of particles <2.5 µm in diameter (PM2.5), and airborne influenza and rhinovirus. Results: Our analysis finds that higher performing filters can have significant impacts on indoor particle pollutant levels. Filters with removal efficiencies of >70% for cat dander particles, fine particulate matter (PM2.5) and respiratory virus can lower concentrations of those asthma triggers and allergens in indoor air of the home by >50%. Very high removal efficiency filters, such as those rated a 16 on the nationally recognized Minimum Efficiency Removal Value (MERV) rating system, tend to be only marginally more effective than MERV12 or 13 rated filters. Conclusions: The results of this analysis indicate that use of a MERV12 or higher performing air filter in home ventilation systems can effectively reduce indoor levels of these common asthma and allergy triggers. These reductions in airborne allergens in turn may help reduce allergy and asthma symptoms, especially if employed in conjunction with other environmental management measures recommended for allergy and asthma patients.
Introduction
Asthma is an enormous public health issue with 8.5% of people in the US diagnosed with asthma [Citation1]. Asthma disproportionately impacts the young. According to the 2011 National Health Interview Survey, >10 million children under age 18 years in the US or 14% have been diagnosed with asthma in their lifetime. Seven million or 10% of the US children have a current diagnosis of asthma [Citation2]. This public health burden leads to missed school days for children and work days for adults, demands on families to manage asthma care for their children, and increased health care costs. The average annual health care cost for a child being treated for asthma exceeded $835 for prescription medications alone in 2007–2008, a large increase from the ∼$350 spent in 1997–1998 [Citation3]. Others have quantified the costs associated with asthma [Citation4], finding that annually >$50 billion in health care costs, almost $4 billion in lost work and school days, and >$2 billion from premature deaths is spent on a national basis in USA. The $56 billion total costs of asthma in that analysis in 2007 was almost $3 billion greater than the estimate from 2002.
Airborne allergen exposures and viral infections are indicated as the two major environmental contributors to the development and/or exacerbation of asthma [Citation5]. Reducing exposures to allergy and asthma triggers in residential settings is an important goal in treating asthma patients, since Americans spend ∼70% of their time indoors at home [Citation6]. Asthma guidance for health care providers includes recommendations for controlling airborne allergens in the home [Citation5]. Most interventions focus on housekeeping activities, such as using high-efficiency particulate air (HEPA) vacuum cleaners [Citation7,Citation8], improved bedding covers and laundering [Citation7,Citation9] and even use of high-efficiency portable air cleaners [Citation7,Citation10].
While many studies have been conducted on interventions to reduce asthma triggers, only a few evaluated the use of higher efficiency media filters in central ventilation systems. This gap in the literature is significant because central heating, ventilation and air conditioning (HVAC) systems move a lot of air through and within homes, and ∼75% of homes in the US have ventilation systems with forced air for heating or cooling or both [Citation11]. The high prevalence of central ventilation systems presents an opportunity for improving mitigation of asthma triggers by filtration since high system airflow rates combined with the use of efficient filters are the two main requirements needed for this tactic to be effective.
The goal of the current work was to assess whether readily available in-duct filtration in the form of better performing filters can have a measurable impact on reducing asthma triggers in the home. We compare modeling results to measurement studies and assess expected benefits of using filters with higher removal efficiencies.
Methods
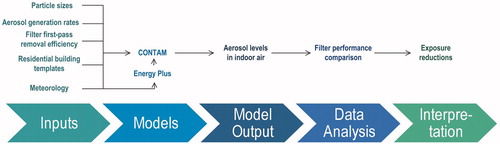
We conducted detailed modeling of aerosol concentrations typically found in residential indoor air to evaluate the expected in-use performance of six different types of filters. Four types of health-relevant aerosols in the indoor air of residences were modeled in this study: cat allergen, PM2.5 generated from indoor sources, PM2.5 of outdoor origin that infiltrates homes, and respiratory virus. A visual representation of the modeling analysis conducted in this report is depicted in . Using CONTAM, a widely accepted, peer-reviewed multi-zone indoor air quality model [Citation12], we ran simulations over an entire year in representative homes in Atlanta and Chicago to evaluate changes in indoor concentrations of each aerosol under different filter intervention scenarios as well as varying indoor and outdoor conditions, including air exchange rates, using the Energy Plus model; [Citation13; explained in Supplementary material]. The performance of the CONTAM model has been validated in many previous studies [Citation14–18].
Figure 1. Flow diagram of modeling analysis.
Modeling scenarios
We conducted this modeling analysis on one attached and one detached sample home in each city. Characteristics are listed in Supplementary Table S3, and floor plans are provided in Supplementary Figures S3 and S4. The overall results were similar between cities and for both home types, so only the results for the Atlanta detached home are presented here. Other modeling scenarios are shown in Supplementary Table S4. Supplementary Table S5 lists the results comparing attached and detached dwellings in Atlanta and Chicago. Results are generally similar between the cities and housing types. The modeling simulations were conducted for a typical single-family residence in two specific geographic locations. One was representative of significant traffic-related PM2.5 and was located in an urban residential climate zone corresponding to Chicago, Illinois. The other was representative of an area with significant seasonal pollen and was representative of a suburban residential home corresponding to the Atlanta, Georgia, climate zone. Meteorological information is used by CONTAM to simulate forced convection, radiant leakage and corresponding air exchange rates. As described previously, we used typical meteorological year (TMY3) data sets derived from 1991 to 2005 meteorological data [Citation19]. The meteorological data included hourly wind direction and speed, dry and wet bulb temperature, relative humidity and cloud cover data. Meteorological data for each of the locations was taken from the airport closest to that city. For Chicago, meteorological data was taken from Chicago Midway International Airport. For Atlanta, meteorological data was taken from Hartsfield–Jackson Atlanta International Airport.
For each of the two cities modeled, two different CONTAM building templates were used. The first was a template for a single family, detached home (DH72). The second was a template for a single family, attached home (AH41). Table S3 lists the characteristics of each of the building templates. The templates were intended to represent typical U.S. residential building stock based on the U.S. Census Bureau American Housing Survey and the DOE Residential Energy Consumption Survey [Citation20–22] We modified the NIST templates to allow for natural ventilation and leakage through and around windows sized to 11.5% of the area of each wall [Citation23].
To account for different types or eras of residential building constructions, three ventilation conditions – low, medium and high annual median air exchange rate (AER) – were modeled for each combination of climate zone and building type. The low, medium and high ventilation conditions correspond to annual median AER of 0.2, 0.5 and 1.5 per hour (h−1). AER is an output of the CONTAM model that is calculated minute-by-minute in the model based on building leakage area, ambient temperature, indoor temperature and ambient wind speed and direction. The building leakage rate was tuned to produce the desired annual median AER for each city and building template. These categories of ventilation rates are consistent with the range of residential air exchange rates recommended by the EPA for use in exposure assessments [Citation24].
Data reduction
One-minute average whole house E1, E2 and E3 concentrations and ventilation rates from the individual rooms in a template for 365 days were output from the simulations. R statistical software version 2.15.1 (R Development Core Team, Vienna, Austria) was used to aggregate the data into the aerosol concentrations and time scales of interest. The total concentration of each aerosol was calculated as the sum of the results for E1, E2 and E3 size bins. Similarly, the minute-average and spatially resolved data were reduced to hourly, daily and annual whole house averages for each combination of filter type, aerosol, building type and location.
Model inputs
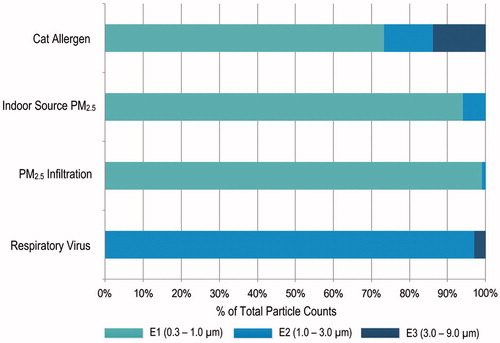
The main inputs to the CONTAM model were particle sizes, aerosol generation rates, removal efficiencies of the various filters tested, and building factors, as shown in . depicts the particle size ranges input for each of the aerosols modeled. For cat allergen, particle sizes were modeled as having the greatest fraction of particles in the 0.3–1.0 μm range and smaller fractions in the 1.0–3.0 μm and 3.0–9.0 μm size ranges [Citation25]. For both PM2.5 source terms, the particle sizes were modeled as having >90% of the particles in the 0.3–1.0 μm size range with smaller fractions in the 1.0–3.0 μm size range [Citation26]. Respiratory virus was modeled as an aerosol containing influenza and rhinovirus with most of the particles in the 1.0–3.0 μm diameter size range and a small fraction in the 3.0–9.0 μm diameter size range. Particle size distributions for viruses were determined from those measured in sneezes and coughs in previous work [Citation27]. A more detailed discussion of the particle size ranges input into the model is included in the Supplementary material online.
Figure 2. Particle size ranges for the modeled aerosols.
Generation rates for the aerosols were obtained from several different sources and are presented in . Exposures in the home to cat allergen were modeled using the release of cat allergen on both a continuous basis as well as with burst emissions of cat allergen from periodic sudden releases in the home. Previous studies have shown upholstered furniture and carpets to serve as reservoirs for cat allergen, which can be released in bursts when someone sits on a couch or walks across a carpet [Citation29,Citation30]. Cat allergen generation rates are presented in µg of Fel d1 per hour. Indoor source PM2.5 was modeled from cooking activities generating particles for 10 min 3 times each day based on generation rates in particles/hour published previously [Citation31]. For outdoor PM2.5, we used actual measured outdoor PM2.5 concentrations from the geographic area and estimated the infiltration of PM2.5 from outdoors using CONTAM. The monthly average outdoor PM2.5 concentration in Atlanta during 2011 ranged from 8 µg/m3 in January to ∼20 µg/m3 in June. Respiratory virus was modeled as infectious dose in units of quant/hour, based on the literature related to outbreaks [Citation32]. We assumed the approximate mid-point of published quanta generation rates for influenza and rhinovirus, 67 and 5 q/h, respectively [Citation28,Citation33]. The results for the virus model are representative of sick days in a home but were modeled all year round to evaluate the effectiveness of various filter media under varying home conditions, such as air exchange rate. The virus model assumed that coughing and sneezing were occurring on all days, since its intention was to understand effectiveness on virus particles produced on a regular, intermittent basis when a person with a virus was sick in the home. Virus generation was assumed to occur in the bedroom and living room, assuming an infected person would spend the most time in those two rooms. Because each day of a year was modeled and building factors, such as air exchange rate and air handler duty cycle, vary daily, the results provide a distribution of airborne virus levels for a wide range of scenarios that could reasonably be expected to occur in practice. Information in the Supplementary material further explains the derivation of the generation rates for all aerosols.
Table 1. Generation rates input into model by particle size category for each modeled aerosol.
Filter removal efficiencies were obtained for six different filters. We obtained removal efficiency data from the manufacturers for three size fractions most commonly tested by filter manufacturers: “E1” for particles in the range from 0.3 to 1 μm, “E2” for 1–3 μm and “E3” for 3–10 μm [Citation34]. lists the reported particle removal efficiencies as well as the filter models we evaluated. Filter performance ratings tend to be based on removal efficiencies for specific size ranges of particles. The most widely used rating system for filters is the Minimum Efficiency Removal Value or MERV rating system [Citation34], which gives a single rating to a filter based on its performance removing particles in the E1, E2 and E3 size ranges. This rating system was developed to assess filter performance for engineering purposes. It does not readily translate as to how these filters can reduce exposures to health-relevant aerosols in the home. A limitation of focusing on removing a particular size fraction is that some common indoor allergens or other asthma triggers can be found on particles that dramatically differ in size. In our analysis, we used modeling techniques to apportion the particle sizes in these categories across common allergy triggers – cat allergen, indoor sources of PM2.5, outdoor sources of PM2.5 and respiratory virus – to evaluate the in-use effectiveness of the various filter grades on each asthma trigger. The MERV scale remains the most readily available indicator of filter performance for a consumer. As a result, we use the term as an indicator of filter grades in this article to assist in translating our findings into consumer-relevant terminology.
Table 2. Particle removal efficiencies by size fraction for each filter type evaluated.
The seven grades of filter tested were readily available for purchase and ranged in removal efficiencies according to their MERV ratings from 1 to 16: a fiberglass filter (MERV1), 1″ thick basic pleated filter (“Pleated, MERV7”), four grades of 1″ pleated filters (“A, B, C, D” ranging from MERV 8–13) and a 5″ thick pleated filter (“MERV16”). Removal efficiencies for each asthma trigger were estimated from the particle size distributions for each of the triggers based on the literature combined with the measured removal efficiencies from the manufacturers. The published removal efficiencies using the ASHRAE method [Citation34] are based on particle counts, not particle mass. As a result, we present removal efficiencies and percent effectiveness based on particle counts by converting the mass concentrations output by the CONTAM model using the average particle volume and an assumed particle density. All filters evaluated except the fiberglass were pleated, and pleated filters accounted for >70% of filters offered for retail sale in a market survey conducted in California [Citation35].
Using the inputs described earlier, modeled indoor concentrations were compared across the six filter types. Cat allergen results are presented in ng of Fel d per m3 of air. Units for PM2.5 are µg/m3. Effectiveness (%) was determined as the percent reduction in the median 24-h whole house concentration of a given pollutant for each filter grade compared to the baseline case, which was the fiberglass filter. The fiberglass filter was chosen as the referent filter because it is one of the two most common filters used in home HVAC systems [Citation35], and its removal efficiencies are very low, approximately equivalent to no filtration of health-relevant aerosols. This follows previous work to determine effectiveness measures for both in-duct [Citation36] and portable air cleaners in homes [Citation37], with 50% effectiveness on a whole house basis considered a minimum level of meaningful performance.
We also examined annual operating costs as another measure of performance. We compared annual operating costs among the filter-based and air cleaner interventions, including in-duct electronic particle removal systems and portable air cleaners. Annual operating costs for each of the filter types were determined from the manufacturer’s retail price combined with the minimum recommended filter change-outs per year. The cost estimate for a generic in-duct electrostatic particle removal system was obtained from an online home repair calculator [Citation38], and annualized costs were spread over 10 years. Electricity usage by a comparable unit (White Rogers, SST2000) was estimated to be 40 W. Similarly, a mid-priced portable HEPA air cleaner (Alen, A350) was selected for comparison. The frequency of filter changes as well as electricity usage were obtained from the owner’s manual [Citation39], and replacement filter costs were obtained from the manufacturer’s website (Model BF15A, alencorp.com). Electricity costs were added for the in-duct system and the portable HEPA unit, using local electricity costs for the Atlanta area [Citation40].
Results
shows particle removal efficiencies for the major size fractions of particles (E1, E2 and E3) reported for each filter type as well as the calculated removal efficiencies for the four asthma triggers calculated from their measured removal efficiencies as well as the proportion of the particles commonly associated with each asthma trigger (cat allergen, indoor source PM2.5, outdoor source PM2.5 and virus). These results show the large variation in the fraction of particles removed by the various grades of filters. The lowest performing filter, a fiberglass filter, had a removal efficiency of only 4% for airborne cat allergen, while the highest efficiency filter tested, a 5-in pleated, had a removal efficiency of at least 97% for particles associated with the four categories of asthma triggers. The next highest efficiency filter tested, Filter D, had a removal efficiency of >70% for cat allergen and 65% or more for PM2.5 from indoor and outdoor sources. Since viruses have a greater fraction of particles associated with larger size ranges, the calculated removal efficiency would be >50% for all filters equivalent to at least Filter A, which removed >50% of virus particles relative to the fiberglass filter.
Results of the modeling analysis are presented in . Modeled median home indoor concentrations of the four aerosols were highest for the fiberglass filter and substantially lower for all other filter types. For Filters C and D, all pollutants were >50% lower than the fiberglass filter, meeting our a priori criteria for effectiveness.
Table 3. Modeled indoor concentration for detached home at median air exchange rate of 0.5 air changes per hour.
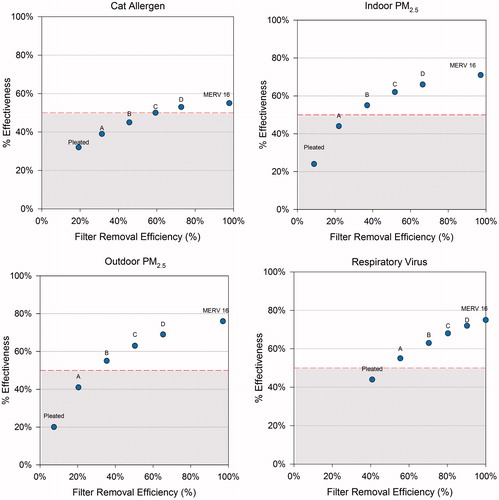
In , we plotted filter removal efficiencies and modeled effectiveness for each filter type compared to a fiberglass filter to assess the other filters’ performance in reducing home indoor levels of cat allergen (a), indoor source PM2.5 (b), outdoor source PM2.5 (c) and respiratory virus (d). All of the filter grades showed greater reductions compared to the fiberglass filter. In addition to the pleated 5″ filter, filters C and D, which are MERV12 and 13 standard size filters (1″ thickness) achieved the recommended 50% effectiveness for all of the modeled aerosols, including cat allergen. These plots also show the diminishing returns on effectiveness for filters with high removal efficiencies. For outdoor PM2.5, the 70% removal efficiency of Filter D achieves ∼70% effectiveness, while the 5″ pleated filter has a removal efficiency of >99% and achieves only 76% effectiveness on outdoor PM2.5. A similar relationship is seen for PM2.5 generated indoors from cooking with maximum effectiveness of 72% for the 5″ pleated filter, which had removal efficiency of >97% for indoor PM2.5.
Figure 3. Plots of filter removal efficiencies (from ) for each filter type versus effectiveness compared to the fiberglass filter in reducing indoor levels in homes for cat allergen, indoor source PM2.5, outdoor source PM2.5 and respiratory virus.
lists the annual operating costs of various air cleaning interventions for the home. The lowest priced interventions are the fiberglass and basic pleated filters with annual replacement costs of ∼$20/year, but they also are the lowest performing filters. Higher grade filters can reduce common triggers by 50% for $40 to $80 per year. The tested Filter D can achieve >50% reductions in all four asthma triggers measured, at an annual operating cost of ∼$80/year. Filters with removal efficiencies greater than those for Filters C and D will not likely reduce in-home levels dramatically, and they come with additional costs. The portable HEPA unit offered little effectiveness on a whole-home basis and had the greatest annual operating cost at $140/year, including replacement filters and electricity, but excluding the original purchase price.
Table 4. Cost estimates for filtration interventions.
Discussion
This analysis showed that large reductions in indoor asthma and allergy triggers can be achieved using relatively inexpensive, high-efficiency in-duct air filters. We used a physical model that took into account factors, such as aerosol generation rates, how often the ventilation system ran, outdoor air temperature and air exchange rates in the modeled homes.
To evaluate the reliability of our results, we compared the modeled concentrations to data from measurement studies, focusing on absolute levels and indoor/outdoor ratios for PM2.5. Airborne levels of the pollutants modeled in our study had relatively low absolute concentrations (1.8 µg/m3 attributed to indoor source PM2.5 and 7.2 µg/m3 for infiltrated PM2.5), but not atypical of other studies of home indoor particle levels. Previous studies attributed 0.4 µg/m3 to indoor PM2.5 levels for each instance of frying or cooking [Citation41], and previous in-home monitoring studies we conducted measured average indoor PM2.5 concentrations of 10 µg/m3 in winter and 12 µg/m3 in summer for 25 homes in Boston [Citation42]. We calculated the average ratio of PM2.5 that infiltrated indoors to outdoor PM2.5 and compared those results to values from the literature. The average indoor–outdoor ratio for the Atlanta detached model home was 0.60 for infiltrated PM2.5 in the current study. This value is comparable to values reported in the literature for outdoor source PM2.5, as indicated by sulfate which is used as a tracer for outdoor particulate air pollution. Sarnat et al. [Citation43] compiled indoor–outdoor sulfate ratios for a group of panel studies, including one in Atlanta that measured indoor–outdoor sulfate ratios of 0.65.
A theoretical modeling analysis conducted using a mass balance model found similar effectiveness on cat allergen (20–60%) for a range of filter efficiencies similar to those tested in our study [Citation44]. The results we present coincide with this previous work, which also showed a plateau of effectiveness, even with a simulated HEPA in-duct filter, which showed no greater effectiveness on cat allergen compared to filters with removal efficiency ratings close to our tested Filter C or a MERV12 [Citation44]. For infiltrated PM2.5, Fisk and colleagues also showed ∼50% effectiveness for a filter (“ASHRAE85”) that would be comparable to Filter D tested in our study; and only a full HEPA filter was able to achieve 80% reduction for outdoor source PM2.5. That paper did not evaluate indoor sources of PM2.5 or virus loads and took into account only continuous emissions of cat allergen; in addition, our model was able to incorporate air flow between rooms.
The magnitude of exposure reduction obtained by the low cost, higher efficiency filters (e.g. those with at least 50% removal efficiency for E1 size fraction) in our analyses has been associated with improvements in health. A recent review article suggests that improved health outcomes can result from asthma interventions employing filtration to reduce particle levels, particularly for those with asthma and/or allergies [Citation45]. Few previous asthma intervention studies have focused on airborne levels of triggers. Only one paper was identified that included high efficiency filters (MERV12) into their asthma intervention program [Citation46]. Filters were combined with other efforts to improve ventilation system performance in the residences studied. These included servicing the air handling unit, if needed, or improving the housing for poorly fitting filters in the HVAC system, so filter effectiveness alone was not assessed directly. Johnson and colleagues [Citation46] showed that the greatest reductions in coughing and wheeze were associated with the HVAC intervention. Statistically significant (p < 0.05) reductions in self-reported “breathing problems” and “allergy attacks” (p < 0.01) were also found in the HVAC intervention group. While the authors did not present results, they state that median non-viable mold spore counts were also reduced post-intervention for the HVAC group.
A recent exposure modeling study in multi-unit public housing estimated reductions in PM2.5 by >50% for a combination of interventions that included use of kitchen and bathroom exhaust fans, replacement of gas with electric stoves, introduction of a no smoking policy and improved weatherization in the apartment [Citation47]. No other individual intervention in that modeling study was able to reduce PM2.5 levels by >50%, and use of a portable HEPA air cleaner alone was able to reduce modeled PM2.5 levels by only 25%. Our analysis focused on single family houses rather than apartments, but we showed >50% reduction in PM2.5 levels using a relatively simple and inexpensive intervention. To achieve 50% reductions in indoor PM2.5, the combined intervention evaluated by Fabian and colleagues involved replacing the stove, installing a kitchen exhaust fan and implementing extensive weatherization of the unit. The weatherization program alone was estimated to cost thousands of dollars, and it would take >11 years to see a return on investment taking into account energy savings from that component of the intervention.
Reducing indoor particulate levels has been shown to improve health outcomes for asthmatics [Citation45,Citation48]. Use of two portable HEPA air cleaners in apartments was shown to reduce indoor PM2.5 levels by >50%, and the authors attribute increased “symptom free days” to the reductions in PM levels [Citation48]. This study included residences with smokers, but reducing indoor levels of PM may be an important factor for reducing exposures of the many asthmatic children living with smokers. Another study found 30% reductions in PM2.5 levels in the asthmatic children’s bedrooms after introduction of a multi-faceted intervention program that included a portable HEPA air cleaner in the bedroom [Citation10]. At 9-month post-intervention, the proportion of children experiencing asthma symptoms during the daytime was reduced 20%, but 3 months later returned to approximately baseline levels. While asthma intervention programs are widely recommended, most have been shown to be minimally to moderately effective at reducing triggers and even less effective at improving health outcomes [Citation7,Citation9,Citation49]. Most asthma intervention studies focus on activities in the home to reduce exposures to dust mite or cockroach allergen [Citation7,Citation9,Citation49,Citation50]. In-duct filtration is unlikely to significantly affect dust mite and cockroach allergen, because the particles associated with those allergens tend to be too large to remain suspended in air for sufficient durations following release or resuspension to be able to enter the returns of the home ventilation system [Citation51,Citation52]. One study showed limited reduction in dust mite allergen levels in house dust for homes when a mechanical ventilation system was installed in the homes, although the authors credited reduced humidity to the slightly reduced levels [Citation8]. Studies have also shown single interventions to be less effective than multi-pronged interventions at reducing asthma triggers in the home [Citation53].
Other methods of air cleaning in homes have been evaluated in comparison to filtration. Previous research we conducted, both modeling [Citation54] and experiments in a test home [Citation36], indicated that in-duct particle removal systems are most effective at reducing particulate levels on a whole house basis and that portable HEPA filters are effective only in a single room [Citation36,Citation54]. In experiments in a test home, we found running five portable HEPA air cleaners in the home yielded similar performance to using a lower grade (MERV8) HVAC filter in the duct [Citation36]. These studies also showed poor performance of the two lowest grades and most commonly used filters – the fiberglass and basic 1″ pleated filters. Another study [Citation44] used a theoretical modeling analysis to test grades of filters on two of the asthma triggers (cat allergen and outdoor PM2.5 infiltrating indoors), and found similarly poor results for the most commonly used filter media. Portable HEPA filter units placed in the patient’s bedroom may still be advised for sensitive patients, since source proximity is an important factor in reducing exposures and some studies have shown benefits from use of such units, particularly in a bedroom [Citation7,Citation10,Citation55].
The fiberglass filter is one of the two most commonly used filters in residences in the US [Citation35], however, its poor performance is not widely understood by consumers. While the key performance characteristic for filters is particle removal efficiency, effectiveness in the real world is an important consideration. Our results show that when used in a typical home even filters with high removal efficiencies are unlikely to achieve 80% reductions for most airborne asthma and allergy triggers, which is the effectiveness recommended by the Association of Home Appliance Manufacturers (AHAM) for portable air cleaners. Another effectiveness measure, known as Clean Air Delivery Rate (CADR), pertains to portable air cleaners and is based on 80% effectiveness, given certain parameters regarding air flow and room size [Citation56]. Similar to the MERV rating, CADR only measures removal efficiency of a device for certain particle size fractions under limited conditions, specifically for a single room. It does not show how effective a given portable unit would be in a whole house. In fact, most portable air cleaners do not have powerful enough fans to be effective on a whole house basis. It should be noted that the analysis presented here included periodic running of the home’s fan system based on outdoor temperature and home conditions. It is likely that greater reductions would be achieved if the home’s fan setting was set to remain on at all times [Citation57].
Removal efficiencies are not reported directly for filters; rather they are incorporated into rating scales with MERV being the most widely recognized. In addition, the California Energy Commission is considering proposals to require labeling of removal efficiencies by particle size as well as a measure of the resistance to airflow of a filter [Citation58]. One limitation of some higher efficiency filters is that they can make it harder for air to pass through (often referred to as “pressure drop”). This can lead to greater energy use if the ventilation system must run more often to cool or heat the same home volume, if a filter is not designed for both low resistance to air flow and effective filtration. While this is driven mostly from an energy conservation perspective, labeling of filters with their removal efficiencies may provide additional information to consumers. However, as this analysis shows, there can be a plateau in effectiveness for filters above approximately a MERV13 rating when used in a typical home. Rating systems, such as the MERV, can be confusing to consumers and have some limitations. The MERV is a 16-point scale based on filter removal efficiencies, however, only filters rated at or above MERV14 are currently required to show any efficacy for removal of particles <1 μm in size [Citation34]. This size fraction makes up a large proportion of particles associated with asthma triggers, particularly for cat allergen and both indoor and outdoor source PM2.5. While we also modeled a MERV16 filter in this analysis, removal efficiencies corresponding to this MERV rating are only found in filters that are 3–5″ thick, as compared to the standard 1″ thick filters that are most common in the US homes [Citation35].
In addition, while the MERV is a standard test it does have a number of limitations, the most important being that performance in the real world does not coincide directly with filter removal efficiencies measured using a laboratory testing method such as MERV. However, our findings show that use of a filter that effectively removes smaller particles (<1 μm), such as a MERV12 or 13, will also be effective for asthma and allergy triggers that span size ranges. Proposed revisions to the MERV guidelines may more effectively address the performance ratings for filters on submicron particles [Citation59]. The revised MERV ratings would add removal efficiencies for the smallest size fraction (0.3–1 μm) for MERV11-14 filters and reduce slightly the removal efficiencies for the larger size fractions.
Conclusions
Millions of people in the US, particularly children, have a current diagnosis of asthma, resulting in large health care costs as well as missed work and school days. A large and growing fraction of the US homes have forced air ventilation systems, providing potential low cost opportunities to reduce airborne asthma and allergy triggers. While not all asthma and allergy triggers are airborne, some key ones are, including cat allergen, PM2.5 and respiratory virus. We evaluated the performance of different grades of filters in a modeling analysis, and we identified filters performing at an approximate MERV12 rating to be effective at reducing airborne asthma triggers by at least 50%. Despite the widespread and common use of media filters in forced air ventilation systems, an analysis of their efficacy that reflects a distribution of real-world emission and household scenarios has not previously appeared in the literature to our knowledge. The enormous burden of asthma in terms of costs and adverse health effects are well known by families and health care professionals. While some asthma interventions are quite costly, an extra $50 per year for well-performing ventilation filters is a small additional cost that may have significant impacts on indoor levels of many triggers in homes. Asthma interventions are and should be multi-factorial, and the evidence in our article suggests that in-duct filters could be an important, relatively low-cost component of efforts to reduce allergens in homes.
Declaration of interest
Funding for this research was provided by 3M Company, Maplewood, MN and Environmental Health and Engineering, Inc. (EH&E), Needham, Massachusetts. EH&E staff conducted the modeling analysis and prepared the manuscript. Staff from 3M provided removal efficiency data for input into the modeling analysis.
Supplementary Material
Download PDF (475.8 KB)Acknowledgements
We thank Jennifer Finn and Julie Botchan for assistance in developing the figures for this article.
References
- Centers for Disease Control and Prevention (CDC), National Health Interview Survey, National Center for Health Statistics, CDC current asthma prevalence percents by age, United States: National Health Interview Survey; 2011. Available at: http://www.cdc.gov/asthma/nhis/2011/table4-1.htm
- Centers for Disease Control and Prevention (CDC). Allergic conditions, ages 0-17: US, 1997–2011, National Health Interview Survey, Hay fever/respiratory allergy. Available from: http://205.207.175.93/HDI/TableViewer/tableView.aspx?ReportId=59 [last accessed 21 Oct 2013]
- Sarpong EM. Health care expenditures among children with asthma, United States, 1997–1998 and 2007–2008. Statistical Brief #332. Rockville, MD: Agency for Healthcare Research and Quality; 2011
- Barnett SBL, Nurmagambetov TA. Costs of asthma in the United States: 2002–2007. J Allergy Clin Immunol 2011;127:145–152
- National Heart, Lung, and Blood Institute (NHLBI). National Asthma Education and Prevention Program expert panel report 3: guidelines for the diagnosis and management of asthma. Bethesda, MD: National Heart, Lung, and Blood Institute/National Institutes of Health; 2007
- Klepeis NE, Nelson WC, Ott WR, Robinson J, Tsang AM, Switzer P, Behar JV, et al. The National Human Activity Pattern Survey (NHAPS): a resource for assessing exposure to environmental pollutants. J Expo Sci Environ Epidemiol 2001;11:231–252
- Morgan WJ, Crain EF, Gruchalla RS, O’Connor GT, Kattan M, Evans R, Stout J, et al. Results of a home-based environmental intervention among urban children with asthma. N Engl J Med 2004;351:1068–1080
- Warner JA, Frederick JM, Bryant TN, Weich C, Raw GJ, Hunter C, Stephen FR, et al. Mechanical ventilation and high-efficiency vacuum cleaning: a combined strategy of mite and mite allergen reduction in the control of mite-sensitive asthma. J Allergy Clin Immunol 2000;105:75–82
- Takaro TK, Krieger JW, Song L. Effect of environmental interventions to reduce exposure to asthma triggers in homes of low-income children in Seattle. J Expos Analysis Environ Epi 2004;14:S133–S143
- Eggleston PA, Butz A, Rand C, Curtin-Brosnan J, Kanchanaraksa S, Swartz L, Breysse P, et al. Home environmental intervention in inner-city asthma: a randomized controlled clinical trial. Ann Allergy Asthma Immunol 2005;95:518–524
- U.S. Census, U.S. Department of Housing and Urban Development, U.S. Department of Commerce. The American housing survey for the United States; 2011. Table C-03-AH, Heating, air conditioning, and appliances – all housing units. Available at: http://www.census.gov/housing/ahs/data/national.html
- Walton G, Dols WS. CONTAM 2.1 Supplemental user guide and program documentation. Gaithersburg, MD: National Institute of Standards and Technology; 2006
- U.S. Department of Energy (USDOE). EnergyPlus software, Version 2.1.0; 2007
- Emmerich S, Nabinger S. Measurement and simulation of the IAQ impact of particle air cleaners in a single-zone building. Gaithersburg, MD: National Institute of Standards and Technology; 2000
- Emmerich SJ, Nabinger S, Gupte A, Howard-Reed C, Wallace L. Comparison of measured and predicted tracer gas concentrations in a townhouse. Gaithersburg, MD: National Institute of Standards and Technology; 2003
- Howard-Reed C, Nabinger S, Emmerich SJ. Predicting the performance of non-industrial gaseous air cleaners: measurements and model simulations from a pilot study. Gaithersburg, MD: National Institute of Standards and Technology; 2004
- Howard-Reed C, Nabinger S, Emmerich SJ. Characterizing gaseous air cleaner performance in the field. Build Environ 2008;43:368–377
- Lansari A, Streicher J, Huber A, Crescenti G, Zweidinger R, Duncan J, Weisel CP, Burton RM. Dispersion of automotive alternative fuel vapors within a residence and its attached garage. Indoor Air 1996;6:118–126
- NSRDB. National Solar Radiation Data Base, 1991–2005 Update: Typical Meteorological Year 3. Washington, DC: Renewable Resource Data Center, National Renewable Energy Laboratory, U.S. Department of Energy; 2008. Available at: http://rredc.nrel.gov/solar/old_data/nsrdb/1991-2005/tmy3/
- HUD. The American Housing Survey for the United States. Washington, DC: U.S. Department of Housing and Urban Development, U.S. Department of Commerce; 1999. Available at: http://www.census.gov/hhes/www/housing/ahs/ahs.html
- Persily A, Musser A, Leber D. A Collection of homes to represent U.S. Housing Stocks. Gaithersberg, MD: National Institute of Standards and Technology; 2006
- U.S. Department of Energy (USDOE). A look at residential energy consumption in 1997. Washington, DC: U.S. Department of Energy; 1999
- Enermodal Engineering Limited. Characterization of Framing Factors for Low-Rise Residential Building Envelopes. Final Report prepared for ASHRAE, Atlanta, GA; 2001. Available at: http://www.energy.ca.gov/title24/2005standards/archive/documents/2001-11-14_workshop/2001-11-07_FRAMING_FACTORS.PDF
- EPA. Exposure Factors Handbook 2011 Edition (Final). Washington, DC: U.S. Environmental Protection Agency; 2011. EPA/600/R-09/052F. Available at: http://www.epa.gov/ncea/efh/report.html
- Custovic A, Simpson A, Pahdi H, Green RM, Chapman MD, Woodcock A. Distribution, aerodynamic characteristics, and removal of the major cat allergen Fel d 1 in British homes. Thorax 1998;53:33–38
- Wilson WE, Suh HH. Fine particles and coarse particles: concentration relationships relevant to epidemiologic studies. J Air Waste Manage Assoc 1997;47:1239–1249
- Nicas M, Nazaroff WW, Hubbard A. Toward understanding the risk of secondary airborne infection: emission of respirable pathogens. J Occup Environ Hyg 2005;2:143–154
- Liao CM, Chang CF, Liang HM. A probabilistic transmission dynamic model to assess indoor airborne infection risks. Risk Anal 2005;25:1097–1107
- Blay F, Chapman MD, Platts-Mills TA. Airborne cat allergen (Fel d I). Environmental control with the cat in situ. Am Rev Respir Dis 1991;143:1334–1339
- Montoya LD, Hildemann LM. Evolution of the mass distribution of resuspended cat allergen (Fel d 1) indoors following a disturbance. Atmos Environ 2001;35:859–866
- Howard-Reed C, Emmerich SJ. Ranking interventions to improve inner-city housing indoor air quality. Annual Conference of the Air & Waste Management Association; 2005. Available at: http://www.bfrl.nist.gov/IAQanalysis/docs/Ranking%20Interventions%20to%20Improve%20Inner-City%20Housing%20Indoor%20A.pdf
- Dick EC, Jennings LC, Mink KA, Wartgow CD, Inhorn SL. Aerosol transmission of rhinovirus colds. J Infect Dis 1987;156:442–448
- Rudnick SN, Milton DK. Risk of indoor airborne infection transmission estimated from carbon dioxide concentration. Indoor Air 2003;13:237–245
- ASHRAE. ASHRAE standard 52.2 – 1999: method of testing general ventilation air-cleaning devices for removal efficiency by particle size. Atlanta: American Society of Heating, Refrigeration, and Air Conditioning Engineers; 1999
- Steuben J, Barker G, Chase A, Hunt M. Analysis of standards proposal for air filter testing, listing, and labeling, Codes and Standards Enhancement (CASE) initiative for PY 2013, Title 20 Standards Development. Docket #12-AAER-2E. Pacific Gas and Electric Company, Southern California Edison, Southern California Gas, San Diego Gas & Electric; 2013
- MacIntosh DL, Myatt TA, Ludwig JF, Baker BJ, Suh HH, Spengler JD. Whole house particle removal and clean air delivery rates for in-duct and portable ventilation systems. J Air Waste Manage Assoc 2008;58:1474–1482
- Shaughnessy RJ, Sextro RG. What is an effective portable air cleaning device? A review. J Occup Environ Hyg 2006;3:169–181
- Homewyse. Cost of in-duct air cleaner. Available at: http://www.homewyse.com/services/cost_to_install_air_cleaning_unit.html [last accessed 21 Oct 2013]
- Alen Corporation. Alen A350 air purifier user manual Alen Corp. a350-pm-4-2012; 2012
- Bureau of Labor Statistics. Average energy prices for the U.S. and selected metropolitan areas. Atlanta: Household Energy; 2012. Available at: http://www.bls.gov/ro5/ro5econ1.htm/
- Wallace LA, Mitchell H, O’Connor GT, Neas L, Lippmann M, Kattan M, Koenig J, et al. Particle concentrations in inner-city homes of children with asthma: the effect of smoking, cooking, and outdoor pollution. Environ Health Perspec 2003;111:1265–1272
- Brown KW, Suh HH, Sarnat JA, Coull BA, Spengler JD, Koutrakis P. Ambient site, home outdoor and home indoor particulate concentrations as proxies of personal exposures. J Environ Monit 2008;10:1041–1051. Available at: http://www.ncbi.nlm.nih.gov/pmc/articles/PMC3779934/
- Sarnat JA, Brown KW, Bartell SM, Sarnat SE, Wheeler AJ, Suh HH, Koutrakis P. The relationship between averaged sulfate exposures and concentrations: results from exposure assessment panel studies in four U.S. cities. Environ Sci Technol 2009;43:5028–5034
- Fisk WJ, Faulkner D, Palonen J, Seppanen O. Performance and costs of particle air filtration technologies. Indoor Air 2002;12:223–234
- Fisk WJ. Health benefits of particle filtration. Indoor Air 2013;23:357–368
- Johnson L, Ciaccio C, Barnes CS, Kennedy K, Forrest E, Gard LC, Pacheco F, et al. Low-cost interventions improve indoor air quality and children’s health. Allergy Asthma Proc 2009;30:377–385
- Fabian MP, Adamkiewicz G, Kay Stout N, Sandel M, Levy JI. A simulation model of building intervention impacts on indoor environmental quality, pediatric asthma, and costs. J Allergy Clin Immunol 2013;133:77–84
- Butz AM, Matsui EC, Breysse P, Curtin-Brosnan J, Eggleston P, Diette G, Williams DA, et al. A randomized trial of air cleaners and a health coach to improve indoor air quality for inner-city children with asthma and secondhand smoke exposure. Arch Pediatr Adolesc Med 2011;165:741–749
- Carter MC, Perzanowski MS, Raymond A, Platts-Mills TA. Home intervention in the treatment of asthma among inner-city children. J Allergy Clin Immunol 2001;108:732–737
- Adgate JL, Ramachandran G, Cho SJ, Ryan AD, Grengs J. Allergen levels in inner city homes: baseline concentrations and evaluation of intervention effectiveness. J Expo Sci Environ Epidemiol 2008;18:430–440
- Custovic A, Simpson B, Simpson A, Hallam C, Craven M, Woodcock A. Relationship between mite, cat and dog allergens in reservoir dust and ambient air. Allergy 1999;54:612–616
- De Lucca SD, Taylor DJM, O’Meara TJ, Jones AS, Tovey ER. Measurement and characterization of cockroach allergens detected during normal domestic activity. J Allergy Clin Immunol 1999;104:672–680
- Crocker DD, Kinyota S, Dumitru GG, Ligon CB, Herman EJ, Ferdinands JM, Hopkins DP, et al. Effectiveness of home-based, multi-trigger, multicomponent interventions with an environmental focus for reducing asthma morbidity a community guide systematic review. Am J Prev Med 2011;41:S5–S32
- Myatt TA, Minegishi T, Allen JG, MacIntosh DL. Control of asthma triggers in indoor air with air cleaners: a modeling analysis. Environ Health 2008;7:43
- Heide S, van Aalderen WMC, Kauffman HF, Dubois AEJ, de Monchy JGR. Clinical effects of air cleaners in homes of asthmatic children sensitized to pet allergens. J Allergy Clin Immunol 1999;104(Part 1):447–451
- Association of Home Appliance Manufacturers (AHAM) method for measuring performance of portable household electric cord-connected room air cleaners. Washington, DC: Association of Home Appliance Manufacturers; 2002
- Howard-Reed C, Wallace LA, Emmerich SJ. Effect of ventilation systems and air filters on decay rates of particles produced by indoor sources in an occupied townhouse. Atmos Environ 2003;37:5295–5306
- California Energy Commission (CEC). Invitation to participate in the development of appliance energy efficiency measures, March 25, 2013. Available at: http://www.energy.ca.gov/appliances/2013rulemaking/documents/2013-03-25_invitation_to_participate.pdf
- ASHRAE. BSR/ASHRAE Addendum to ANSI/ASHRAE Standard 52.2-2012, public review draft, proposed addendum to standard 52.2, method of testing general ventilation air cleaning devices for removal efficiency by particle size, first public review; 2013