Abstract
Objectives. Some parents with a sick infant contact a doctor, while others do not. The reasons underlying such parental decisions have not been thoroughly studied. The purpose of this study was to explore how the actual symptoms in the infant were associated with parent-rated illness, illness severity, and the probability of the parents contacting a doctor. Design. A retrospective questionnaire and a prospective diary study covering 14 months of the participating infants’ lives. Setting and subjects. The 194 participating infants were followed for three months prospectively from the age of 11 to 14 months using diary cards, and retrospectively from birth until the age of 11 months by a questionnaire. Results. During the three months of the diary card prospective follow-up, the infants had symptoms on average every second day, and the vast majority (92%) had 10 or more days with at least one symptom; 38% of the infants were reported to have had five or more symptoms for more than five days. Fever, earache, and vomiting were the symptoms most likely to cause parents to rate their infant as ill. Earache was the symptom that triggered doctor contact most immediately. The parent-rated illness severity was strongly related to the tendency to contact a doctor. However, this association was markedly weaker when adjustment was made for the infant not eating normally, having a cough, or running a fever. Conclusion. Specific symptoms such as fever, earache, and vomiting were strongly associated with the probability of parents rating the infant as ill. An earache would cause the parents to contact a doctor. Fever and vomiting were other symptoms triggering doctor contacts. First, these symptoms could cause the parents to want a doctor's expert evaluation of the infant's illness; second, the parents could expect medication to be necessary; or third, it could just be difficult for the parents to handle the ill infant.
Parents’ understanding and interpretation of the illness and symptoms of their infant guide their decisions concerning the need for medical help.
Fever, earache, and vomiting were the symptoms most likely to cause parents to rate their infant as ill. Earache was the symptom that triggered doctor contact most immediately.
While parents go to the doctor more often when symptoms are present, just fewer than 60% seek contact with a doctor even if illness is rated as most severe. Therefore, days when parents do contact a doctor must be special and acknowledged by GPs.
Most infants suffer from frequent episodes of illness, and symptoms vary with age and season [Citation1,Citation2]. A common cold is most frequently reported [Citation1–4]. Consultation rates are highest in the age range of 6–18 months [Citation2,Citation4]. Apart from actual illness, these rates are related to parental illness behaviour [Citation5], the mother's state of anxiety, stress, and depression [Citation6,Citation7], the child starting to attend a daycare centre [Citation8] and demographic and socioeconomic factors [Citation9,Citation10].
Parents contact a doctor if they observe multiple illness signs, and if they believe one of the symptoms to be serious [Citation3,Citation11–13]. The symptoms causing the most parental concern are high fever [Citation14] and breathing difficulties [Citation15]. However, some parents with a sick infant are more prone to visit the doctor than others [Citation5]. Other factors which cause the parents to contact a doctor are the parents’ own ideas about what underlies the symptoms, panic, or inadequate coping skills with a sick infant [Citation13]. Nevertheless, parents manage to care for most (36–80%) of their children's illness episodes themselves [Citation2,Citation3,Citation12]. Doctors experience that many infants in the consultation have only mild infections. Parents have the primary responsibility to assess symptoms of ill health in their infant. The few studies describing how parents assess symptoms focus primarily on the accuracy of parental illness severity prediction [Citation16–18]. Saunders et al. (10) identified predictors leading to consulting a physician; the severity and persistence of respiratory tract infection proved predictive [Citation11]. The reasons underlying parental assessment of symptoms and the subsequent decision to contact a doctor are not well understood.
The purpose of this study was to explore how the infant's symptoms are associated with whether the parents rated their infant as ill, the parents’ assessment of the severity of the illness, and whether a doctor was to be contacted.
Material and methods
Sample and recruitment
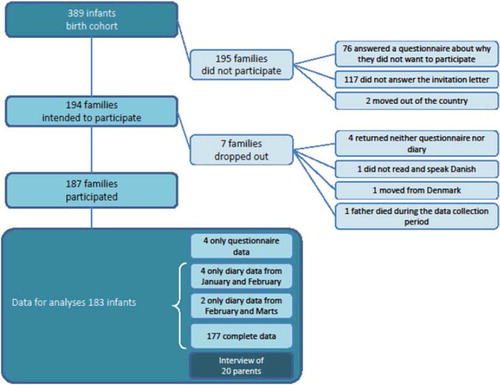
After ethical approval, given by the Danish Local Ethics Committee of Frederiksborg County, letters were sent to parents of a birth cohort of 389 infants born in February 2001 within Frederiksborg County, Denmark. The 194 participating infants were followed for three months (90 days), prospectively from the age of 11 to 14 months using a diary (January–April), and retrospectively from birth until the age of 11 months by a questionnaire, filled in by the infants’ parents (). To ensure that the diaries were completed, the families were contacted by letter every 14 days about the preceding month's diary and once by phone.
Figure 1. Flowchart: inclusion of families in the present study.
The questionnaire and the diary
The questionnaire covered the first 11 months of the infant's life, addressing nursery attendance, the infant's state of health (symptoms, diagnosis, medication, illness episodes, and doctor contacts), and family data (size, educational level of parents).
The diary card was a one-month calendar with 14 days on each side, to be filled in daily for three months. Each day, the parents could tick off whether their child experienced any of the following: (a) selected symptoms: crying more than usual, cold/runny nose, not eating normally, not sleeping well, breathing affected, fever, cough, vomiting, diarrhoea, earache; (b) doctor contact: telephoned their doctor, visited their doctor, had a home visit by a doctor from the out-of-hours service, visited a specialist doctor, went to the hospital; (c) parent-rated illness severity: how they rated their infant's state of illness: one of 0 = not ill, (X) = not really ill but not really well either, X = ill, XX = very ill, XXX = severely ill. A rating of X or higher was called parent-rated illness.
Statistical methods
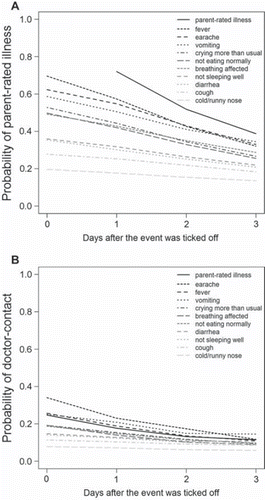
Using logistic regression models, we calculated the crude probability of parent-rated illness and doctor contact, respectively, given that the parents had ticked off an event for their child in the diary card. We calculated this probability for each of the selected symptoms that the parents could tick off, on the day the event was ticked off as well as one, two, and three days later. The probability on the day of the event indicated the relative importance of the symptom; the rate of decrease of the probability by the number of days after the event was ticked off indicating the acuteness of the symptom (see reading example, ).
Figure 2. The probability of parent-rated illness () or doctor contact () given that the parents ticked off the corresponding event – one of the selected symptoms (greyscale lines) or parent-rated illness (dashed line) – on the diary card the same day or 1, 2, or 3 days before. The probability on the day of the event indicates the relative importance of the symptom (highest importance shaded darkest); the slope of the corresponding line indicates its acuteness.
Note: Reading example: In it can be seen that when the infant's breathing is affected, there is a 49.2% probability that the parents rate the infant as ill, i.e. the level of the corresponding line at 0 days after the event was ticked off (at the left-hand side). Furthermore, the probability that the parents rate the infant as ill two days later – the two-day predictive value of the symptom – is 35.0%, i.e. the level of the corresponding line at two days after the event was ticked off (in the right-hand part of the graph). Hence, the slope of the graph indicates how the symptom affects the future. The difference between the two probabilities is caused mostly by infants in whom the symptom has disappeared during the two days, so that the parents do not rate the infant as ill any more. Then, if the infant's breathing is affected and the parents rate the infant as ill, an estimate for the probability that they still rate the infant as ill two days later is simply calculated as 35.0/49.2 × 100% = 71.1%. Thus, the line's slope relative to its level can be viewed as indicative of how the symptom influences the illness duration. In , the probability of contacting the doctor when the infant has trouble breathing is 19.2%, and 10.2% two days later – read as the level of the corresponding line at 0 and 2 days after the event was ticked off, respectively, in the graph. Hence, the slope of the line here is indicative of the speed with which the parents contact a doctor.
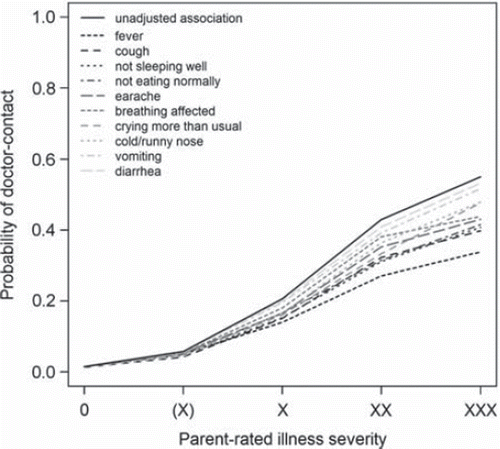
Again using logistic regression, we calculated the probability of doctor contact given the parent-rated illness severity that day. In addition, this association was adjusted in a multivariate logistic regression model by adding a variable indicating whether the parents ticked off a specific symptom that day. The probabilities of doctor contact calculated from these regression coefficients of parent-rated illness severity were interpreted as the part of the unadjusted association unexplained by the presence of the specific symptom. Thus, the greater the difference between the unadjusted and the adjusted probabilities, the more important the symptom is in explaining the relationship between doctor contact and parent-rated illness severity.
The associations were estimated and formally tested in logistic regression models with generalized estimating equations (GEE) adjustment to account for the inherent correlation between the daily observations on the same infant.
Results
Study population
Of the 389 families invited to participate, two families left the county during the recruitment period, and 194 accepted. Among the 194 included families, seven families dropped out (see ). Of the 193 non-participating families, 117 parents did not respond to the letter, and 76 parents did answer the invitation letter but did not want to participate in the study. These parents answered a questionnaire addressing their reasons for not participating (28).
Ten of the 187 participating families returned incomplete data, leaving a study population of 183 families with 16 284 days of observation. Characteristics of the study population covering the first 11 months of the infants’ lives are given in . Of the included infants, 56% were boys. The mothers and fathers had a median age of 32 and 34 years, respectively. Of the infants, 11% were on medication regularly. Some 70% of the infants had siblings, and 19% of those were often ill. With an average of two illness episodes recalled, most had doctor contacts at least once in that period, while some had up to nine doctor contacts. While most parents rated their infant's general health as very good, 8% rated their infant to be of fair or poor health. Of the selected symptoms, the majority had experienced cold/runny nose (94%) and fever (82%). Almost all had experienced at least one cold (96%).
Table I. Baseline characteristics of the cohort of 183 children, assessed at 11 months of age at the start of the diary data collection period. Listed are (for interval-scale data) medians with inter-quartile range (IQR) and full range of the data, or (for categorical data) numbers in each category with percentages.
Symptoms, parent-rated illness, and doctor contact
In the three-month diary period, one or more symptoms were recorded on 7532 (46%) days (see ). Roughly assessed from the median, symptoms were present every second day, and the vast majority (93%) had more than 10 days (out of 90) with at least one symptom. The presence of multiple symptoms was also considerable with 38% of the infants having five or more symptoms for more than five days over the three-month period. Fever for more than 10 days was registered for 14% of the infants. Parents of eight (4%) of the infants assessed the illness to be severe for at least one day in the observation period.
Table II. Prevalence of selected events – symptoms, parent-rated illness, and doctor contacts over the 90 days of observation.1,2
Parent-rated illness severity and contact with the health care system
In it can be seen that fever, earache, and vomiting were the symptoms that had the greatest tendency to cause the parents to assess the infant as ill. The three symptoms cold/runny nose, cough, and diarrhoea were least likely to make the parents rate their infant as ill.
Slopes that are relatively steep in indicate symptoms whose appearance quickly causes parents to rate their infant as ill, the most prominent being fever, but earache, crying more than usual, and not eating normally were also triggers. Relatively gentle slopes in indicate symptoms that, if the parents start rating the infant as ill (however low the probability), are associated with prolonged periods in which the infant will be rated as ill; such symptoms were vomiting, affected breathing, cold/runny nose, and cough.
Earache was the symptom that triggered prompt doctor contact (). The steep slope indicates that parents whose infant had an earache did not wait long to contact a doctor. Otherwise, ordering the symptoms by priority showed an order that was similar to the tendency of the parents to rate the infant as ill (), e.g. fever and vomiting were other symptoms that triggered doctor contact, but cold/runny nose and cough were unlikely to lead to a doctor contact. The relationship between the symptoms and parent-rated illness and doctor contact respectively, and the predictive values of the symptoms, were invariably highly significant (p < 0.001).
In , the relationship between the parent-rated illness severity and doctor contact is shown; the sicker the infant according to the parents, the higher the tendency to a doctor contact. This association was highly significant (p < 0.001). Notably, even with the maximum rating of illness severity (XXX), fewer than 60% did in fact seek medical help. The presence of specific symptoms may explain part of this relationship. The presence of vomiting or diarrhoea did not diminish the parental assessment of the need for help as shown in the relationship between illness severity and doctor contact, while fever, cough, not sleeping well, and not eating normally seemed to explain a large part of the parental assessment of the need for help. These adjusting effects of the individual symptoms were statistically significant (p < 0.05) for all but diarrhoea (p = 0.134).
Figure 3. The probability of doctor contact given the parent-rated illness severity. The probabilities are shown unadjusted (dashed line) and adjusted for the presence of selected symptoms (greyscale lines). The greater the difference between the unadjusted and the adjusted probabilities, the more important the symptom in the relationship between doctor contact and parent-rated illness severity. Symptoms that cause the greatest adjustment for parent-rated illness severity XXX are shaded darkest.
Note: Reading example: when the parents rate their infant as ill with a severity of XX, the probability of contact with the doctor is 42.9%, i.e. the level of the dashed line for severity XX. The line corresponding to affected breathing has a level of 38.1% at severity XX. Hence, when the infant has trouble breathing and the parents rate the child as ill XX, we can calculate that (42.9–38.1)/42.9 × 100% = 11.2% of doctor contact can be attributed to the presence of the symptom, and 38.1/42.9 × 100% = 88.8% to the illness severity rating.
Discussion
Main findings
Fever, earache, and vomiting (in that order) were most likely to make parents rate their infant as ill. Earache was the symptom that triggered doctor contact most immediately. The parent-rated illness severity related strongly to the tendency to contact a doctor. This association was markedly weaker when adjustments were made for the infant not eating normally, having a cough, or running a fever.
Strengths and limitations
The prospective part of the study, which used diary cards, gave a comprehensive picture of the infant's illnesses. The daily longitudinal data collection enabled us to investigate minor symptoms, illness development, and parental reactions, which are often forgotten when they have to be recalled retrospectively [Citation19]. However, the diary method may have caused a selection of particularly resourceful parents, since it took effort to fill out a diary card for three months while caring for a baby and often siblings too. The main reason for not participating given by parents who answered the non-participating questionnaire was that they were still very “new” parents and did not have the time or energy to participate. Moreover, residents in Frederiksborg County may be considered as representative of middle-class families in Denmark. Parents’ perceptions of health problems in general and how they react to their children's symptoms, e.g. seeing a doctor, are connected to demographic and socioeconomic factors, but the results are ambiguous [Citation20]. Children growing up in low socioeconomic families tend to be sick more often than other children [Citation21], but their consultation rates vary, both within a country and between adjacent countries, making it difficult to speculate on the direction of bias. The high response rate – most probably boosted by repeated contacts with parents during the data-collecting period – avoided bias in the analysis due to missing data. However, the clinical evaluation of the symptoms by a physician was not compared with the parental assessments. Moreover, the list of symptoms in the questionnaire and the diary card was by no means exhaustive.
While the wording of the symptom events may sometimes not relate to specific clinical conditions – e.g. not eating normally or not sleeping well – the symptoms all relate to signs of illness recognizable by parents, as validated in a pilot test and in an interview study [Citation20]. Likewise, the parental assessment category (X) – not really ill but not really well – provided as a buffer between the statuses of “healthy” and “ill”, was recognized by parents. Lowering the threshold for parent-rated illness to (X) or higher does not change the relative order of importance of the symptoms markedly; only crying more than usual and not eating normally rise in importance.
Study population
The illness and consultation rates found retrospectively for the first 11 months were low. Others have found mean illness rates from 2.9 to 6.1 episodes per year among infants [Citation22,Citation23]. The occurrence of visits to doctors in Frederiksborg County is on average 3.4 for infants between zero and one year [Citation24].
The parents rated their infant's health as being generally good, which is not surprising, as only 3% of the infants had protracted illness [Citation21]. Future research will focus on the infants whose health was assessed as suboptimal by their parents, and who are often ill.
Symptoms and parental illness assessment
Our finding that the infants had symptoms roughly every second day corresponded well with another Danish cohort study of infants’ general symptoms. That study followed infants from birth until the age of one year through diary cards and found that the infants had symptoms on roughly 20% of the days during the first six months, increasing to 30% from the age of six months until the age of nine months [Citation22].
Cold/runny nose, cough, and diarrhoea, symptoms that are considered to be the most contagious, least often led to parents rating the infant as ill in our study. Consequently, parents may bring their infant with these symptoms to the nursery. The National Health Service's public guidelines concerning the nursery attendance of sick children list common symptoms – e.g. running nose, cough, vomiting, fever – as illness, but they also state that children may attend daycare if they are able to do so in the usual way. These recommendations must be difficult to follow, as parents often have conflicting needs and obligations: they want to care for the sick infant, but they might also feel an obligation to their workplaces and a need to safeguard their economic position and connection to the job market. This pattern of dealing with children with minor illnesses in the nurseries should be anticipated in the design and management of nurseries, sanitation, and space in order to minimize the spread of minor infections [Citation25].
The findings that not eating normally and not sleeping well led parents to doctor contact are interesting, as these symptoms also triggered parents to give their feverish child paracetamol [Citation26]. These illness-related symptoms, harmless from a doctor's point of view but frightening from the parents’ view, call for further understanding.
In our study, fever was the most important symptom in determining severity. Paediatricians also worry when fever is present [Citation27], even though fewer than 2% of infants with a temperature >39˚C have manifest bacteraemia [Citation28] which could contribute to fever phobia among the parents. Parents’ ability to make clinical judgements regarding their child's illness has mostly been studied in connection with developing and validating acute illness observation scales, and parents in these studies had a tendency to perceive illness as more severe than did the paediatricians [Citation16,Citation29]. In our study, we explored the connection between the parents’ assessment and the infants’ illness severity, symptoms, and contact with the doctor.
While 14% of the infants had 10 or more days with fever, parents assessed only 4% to have severe illness on at least one day in the observation period. These parents may have had experience of fever with older siblings, or the fever gradient may correlate strongly with rating of illness severity. We did not ask for the exact temperature.
Conclusion
Specific symptoms such as fever, earache, and vomiting were strongly associated with the probability that parents rated the infant as ill. An earache would make the parents contact a doctor immediately. Fever and vomiting were other symptoms that triggered a doctor contact. First, these symptoms could cause the parents to want a doctor's expert evaluation of the infant's illness; second, the parents could expect medication to be necessary; or third, it could just be difficult for the parents to handle the ill infant.
Acknowledgements
Funded by the Danish Research Foundation for General Practice.
Declaration of interest: The authors report no conflicts of interest. The authors alone are responsible for the content and writing of the paper.
References
- Dingle JH, Badger GF, Jordan WS. Illness in the home. A study of 25,000 illnesses in a group of Cleveland families. Cleveland: Western Reserve University; 1964.
- Hay AD, Heron J, Ness A. The prevalence of symptoms and consultations in pre-school children in the Avon Longitudinal Study of Parents and Children (ALSPAC): A prospective cohort study. Fam Pract 2005;22:367–74.
- Holme CO. Incidence and prevalence of non-specific symptoms and behavioral changes in infants under the age of 2 years. Brit J Gen Pract 1995;45:65–9.
- McCormick A, Fleming D, Charlton J. Morbidity statistics from general practice: Fourth national study, 1991–92. London: HMSO, 1995.
- Janicke DM, Finney JW, Riley AW. Children's health care use: A prospective investigation of factors related to care-seeking. Med Care 2001;39:990–1001.
- Little P, Somerville J, Williamson I, Warner G, Moore M, Wiles R, . Family influences in a cross-sectional survey of higher child attendance. Br J Gen Pract 2001;51:977–84.
- Ostberg M. Parental stress, psychosocial problems and responsiveness in help-seeking parents with small (2–45 months old) children. Acta Paediatr 1987;69–76.
- Harsten G, Prellner K, Heldrup J, Kalm O, Kornfalt R. Acute respiratory tract infections in early childhood. Acta Otolaryngol 1992;492(Suppl):72–4.
- Saxena S, Majeed A, Jones M. Socioeconomic differences in childhood consultation rates in general practice in England and Wales: Prospective cohort study. BMJ 1999;318:642–6.
- Ekholm O, Kjøller M, Davidsen M, Hesse U, Eriksen L, Christensen AI, . Sundhed og sygelighed i Danmark & udvikling siden 1987 [Health and morbidity in Denmark and changes since 1987]. Copenhagen: Statens institut for Folkesundhed; 2006.
- Saunders NR, Tennis O, Jacobson S, Gans M, Dick PT. Parents’ responses to symptoms of respiratory tract infection in their children. Can Med Assoc J 2003;168:25–30.
- Bruijnzeels MA, Foets M, van der Wouden JC, van den Heuvel WJA, Prins A. Everyday symptoms in childhood: Occurrence and general practitioner consultation rates. Br J Gen Pract 1998;48:880–4.
- Ertmann RK, Söderström M, Reventlov S. Parents’ motivation for seeing a physician. Scand J Prim Health Care 2005;23:154–8.
- Kai J. What worries parents when their preschool children are acutely ill, and why: A qualitative study. BMJ 1996; 313:983–6.
- Cornford CS, Morgan M, Ridsdale L. Why do mothers consult when their children cough. Fam Pract 1993;10:193–6.
- Shepperd S, Perera R, Bates S, Jenkinson C, Hood K, Harnden A . A children's acute respiratory illness scale (CARIFS) predicted functional severity and family burden. J Clin Epidemiol 2004;57:809–14.
- Morley CJ, Thornton AJ, Cole TJ, Hewson PH, Fowler MA. Baby check: A scoring system to grade the severity of acute systemic illness in babies under 6 months old. Arch Dis Child 1991;66:100–6.
- Bauchner H, McCarthy PL, Sznajderman SD, Baron MA, Fink HD, Forsyth B . Do mothers overestimate the seriousness of their infants’ acute illnesses? J Dev Behav Pediatr 1987;8:255–9.
- Butz A. Use of health diaries in pediatric research. J Pediatr Health Care 2004;18:262–3.
- Ertmann RK. What makes parents consult a physician? PhD thesis. Copenhagen: Research Unit for General Practice in Copenhagen; 2007.
- Johansen A, Jespersen L, Michelsen S, Due P. Danske børns sundhed og sygelighed [Danish children's health and morbidity]. Copenhagen: Statens Institut for Folkesundhed. Syddansk Universitet, 2009.
- Von Linstow ML, Holst KK, Larsen K, Koch A, Andersen PK, Hogh B. Acute respiratory symptoms and general illness during the first year of life: A population-based birth cohort study. Pediatr Pulmonol 2008;43:584–93.
- Monto AS, Ullman BM. Acute respiratory illness in an American community – Tecumseh Study. JAMA 1974; 227:164–9.
- Kasper Gynther. The consultation frequencies in Frederiksborg County, The National Health Service, Denmark, 2010.
- Marx J, Osguthorpe JD, Parsons G. Day care and the incidence of otitis media in young children. Otolaryngol Head Neck Surg 1995;112:695–9.
- Jensen JF, Tonnesen LL, Soderstrom M, Thorsen H, Siersma V. Paracetamol for feverish children: Parental motives and experiences. Scand J Prim Health Care 2010;28: 115–20.
- May A, Bauchner H. Fever phobia: The pediatrician's contribution. Pediatrics 1992;90:851–4.
- Luszczak T. Evaluation and management of infants and young children with fever. Am Fam Physician 2001;64: 1219–26.
- McCarthy P, Freudigman K, Cicchetti D, Mayes L, Benitez JL, Salloum S . The mother–child interaction and clinical judgment during acute pediatric illnesses. J Pediatr 2000;136:809–17.