Abstract
Objective. To determine the number of symptoms experienced in an adult population and their relationship with self- reported health, demographic, and lifestyle factors. Design. A postal questionnaire addressing 23 different symptoms, health, demographic, and lifestyle factors. Setting. The community of Ullensaker, Norway, in 2004. Subjects. 3325 subjects (participation rate = 54.4%). Main outcome measure. Number of self-reported symptoms. Results. At least one symptom was reported by 91.9% of the participants, 46.7% reported six or more, and 17.3% reported 10 or more symptoms. Symptom reporting was frequent in all age groups, also among young people. Women reported a greater mean number of symptoms than men (6.7 vs. 5.1). Those reporting poor health, receipt of social security benefit, unemployment, low education, or obesity had most symptoms. The proportion of respondents with these characteristics increased almost linearly with increasing number of symptoms. According to an adjusted multivariate model, self-reported overall health explained 28.2 % of the variance in the number of symptoms. Conclusion. A large proportion of the responders reported a high number of symptoms. A simple method of counting symptoms may be useful in approaching patients in general and multi-symptom patients in particular, because the total burden of symptoms is strongly associated with the patient's self-reported health and may even be a predictor of future disability.
The total burden of symptoms is important for assessing a patient's overall health and may even predict future disability.
The number of symptoms reported in a general population is high in all age groups. Women report more symptoms than men do.
A strong association exists between reported number of symptoms and demographic and lifestyle factors.
Self-reported overall health explains most of the variance in how many symptoms individuals report.
Introduction
In an article on symptom reporting in different cultures, it was stated, “as long as you have a body you will notice it, wherever you live in the world” [Citation1]. Although individuals from all cultures experience many symptoms, few population-based studies on symptom reporting have been conducted [Citation2]. Some data are available on the symptoms that patients report when they consult a general practitioner [Citation3], but data are lacking on symptoms that are not reported and their importance for the individual's perceived health. In previous reports from the Ullensaker study, it was revealed that the number of pain sites predicted health and functioning better than the location of pain [Citation4]. In a recent article we show a strong association between the number of pain sites and the number of non-musculoskeletal symptoms [Citation5]. The number of pain sites and the total number of reported symptoms are correlated with reduced function, and the number of pain sites can predict future disability pension [Citation6,Citation7]. These findings suggest that the number of symptoms per se may be used as a health indicator at both individual and population levels.
At least one-third of the symptoms reported in primary care and also in population-based studies are considered medically unexplained (MUS), i.e. symptoms for which there are no evident medical explanations [Citation8]. Health-related outcomes for patients with MUS are generally poor [Citation6,Citation9,Citation10]. Consideration of total symptom load in terms of their numbers may provide benefit for assessing patients’ overall health during medical consultations. However, this requires knowledge of symptom prevalence in the general population.
We have undertaken a questionnaire survey in a community-based population. In the long-term follow-up studies our interest has gradually moved from the location of complaints via counting number of pain sites to also include non-muscular symptoms. Here we present the total number of reported symptoms and the relationship to demographic variables, lifestyle factors, and self-reported health.
Material and methods
Study design and sample
The present study is a part of the Ullensaker study, a large population-based cohort survey in Ullensaker municipality 40 km north of Oslo, Norway. Postal surveys were conducted in 1990, 1994, and 2004, primarily focusing on musculoskeletal complaints. In 2004, questionnaires asking about number of pain sites and number of non-musculoskeletal symptoms were sent to all inhabitants in the following age groups: 24–26, 34–36, 44–46, 54–56, 64–66, 74–76, and 84–86-year-olds. In total, 6108 individuals were contacted. A reminder was sent to non-responders after six weeks. In this article, we present cross- sectional data from 2004.
Variables
The Standardized Nordic Questionnaire (SNQ), illustrated by text and a body manikin, was used to assess musculoskeletal symptoms [Citation11]. We added headache to the original nine pain sites. Participants were asked to report pain or discomfort experienced during the previous week in any of the following 10 body regions: head, neck, shoulder, elbow, hand/wrist, upper back, lower back, hip, knee, and ankle/foot. The response categories were yes/no. To assess symptoms of non-musculoskeletal origin, we used a modified version of the Subjective Health Complaints Inventory (SHC) (13), where musculoskeletal-related symptoms were omitted because they were already included in the SNQ. Hence, we asked about extra heartbeats, chest pain, breathing difficulties, heartburn, stomach discomfort, diarrhoea, constipation, eczema, tiredness, dizziness, anxiety, depression, and sleep problems experienced during the previous 30 days. Participants were asked to grade the intensity of each complaint on a four-point scale: “not at all”, “a little”, “some”, and “severe”. The dependent variable was the total number of reported symptoms (0–23), and consists of the sum of yes-answers to the SNQ (10 questions) and report of at least a little bothered to the SHC (13 questions). The independent variables are listed in .
Table I. Mean number of symptoms (0–23) in an adult population according to demographic factors, lifestyle factors, and self-reported health.
Statistical analysis
Frequencies and percentages were used to describe the prevalence of symptoms. T-tests and analysis of variance (ANOVA) were used to explore the associations between the number of symptoms and the independent variables.
Linear regression analysis was performed to determine bivariate and adjusted relationships between the number of symptoms and the independent variables. Because of relatively few participants, the two oldest age groups (74–76- and 84–86- year-olds) were pooled during analysis. Furthermore, an imputation procedure was performed assuming that individuals who had reported at least one symptom meant to answer “not at all” to the unanswered questions.
To determine the extent to which the imputation procedures influenced the results, we performed sensitivity analysis using non-imputed data. The software package PASW statistics 18 was used for all analysis.
Results
Study sample
After one reminder, 3325 individuals responded (response rate 54.4%). Individuals who did not respond to any of the questions on symptoms were excluded (n = 98), resulting in a final sample of 3227 individuals, of whom 1772 (54.9%) were women.
Number of symptoms
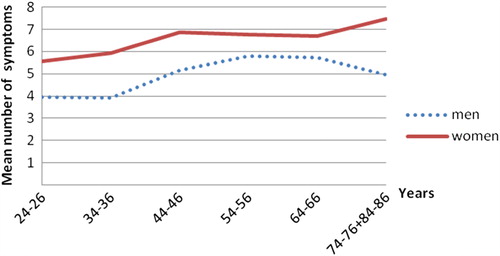
A total of 91.9 % of subjects (94.6% of women and 88.6% of men) had experienced at least one symptom. The mean number of symptoms reported was 6.0 (women 6.7 and men 5.1). In all age groups, women had a higher mean number of symptoms than men. Symptom reporting was frequent in all age groups, and also among young people (). One to five symptoms were reported by 45.2% (women 41.4% and men 49.7%), six or more symptoms by 46.7% (women 53.2% and men 38.9%), whereas 17.3% reported 10 or more symptoms (women 24.6% and men 11.4%). The highest mean number of symptoms was seen in respondents who reported very poor health (13.4 symptoms), receipt of long-term social security benefits (10.1), unemployment (7.9), low education level (7.5), or obesity (7.3) (see ).
Figure 1. Mean number of symptoms (0–23) reported in an adult population according to gender and age.
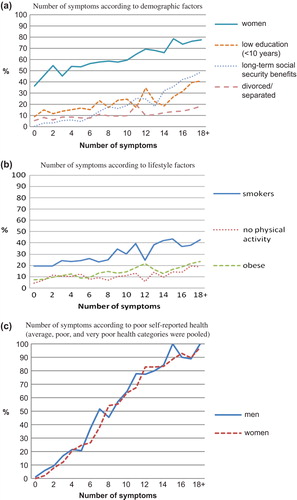
Relationships between the number of symptoms and self-reported health, demographic factors, and lifestyle factors were almost linear (). As the number of symptoms increased from zero to 18+, the proportion of people receiving long-term social security benefits increased from zero to 50%, whereas the proportion of people with low education level increased fourfold, the proportion of divorced people increased threefold, and the proportion of women increased twofold. Similar patterns were observed for physical inactivity, obesity, and smoking. The strongest association was between number of symptoms and self-reported health. The proportion of people who reported having an average health or worse increased from zero to 100% as the number of symptoms increased from zero to 18 + in both genders.
Figure 2. Number of symptoms reported in an adult population according to demographic factors, lifestyle factors, and self-reported health.
In the linear regression model, self-reported health explained 28.2% (R2-change = 0.282) of the variance in the number of symptoms (). The model as a whole explained 46.9 % of the variance in the number of symptoms (R2 = 0.469).
Table II. Linear regression analyses of the association between number of symptoms in an adult population and socio-demographic factors, lifestyle factors and self-reported health.
Sensitivity analyses, in which all analyses were conducted using non-imputed data, showed that the imputation procedure had a tendency to weaken, rather than strengthen, the associations in our data.
Discussion
This Ullensaker population reported on average six symptoms out of 23, women more than men, and the number of symptoms was high in all age groups. The highest number of symptoms was seen in individuals reporting poor self-perceived health, receipt of social security benefits, or unemployment. In the multivariate model, most of the explanatory power resided with self-reported overall health.
The strength in our study is that it included a large number of participants (3325), and a large variety of symptoms, although the modest response rate (54%) is a concern. Some studies have found that individuals with good health are more likely to respond to health surveys [Citation12,Citation13], whereas others found no such differences [Citation14]. Compared with the general population of Norway, our study population had higher proportions of women, pensioners, middle-aged people, and highly educated people. This might have affected the results by over- or underestimating the number of symptoms.
The Ullensaker cohort study has used the SNQ to measure musculoskeletal symptoms since it began in 1990, and to be able to maintain longitudinal data the SNQ was continued in 2004. For our purpose, we have added a tenth body region (head) to the original nine pain regions. The SHC, designed to measure common health complaints, was added to the questionnaire in 2004 to include also non-musculoskeletal symptoms. It is a limitation that we used a modified version of the SHC. Even if the combination of these two instruments is not validated, both instruments are widely used and separately validated [Citation11,Citation15].
By using these two instruments, we have a mismatch between the seven-day time window in SNQ and the 30-day window in SHC. Consequently, our results are not a consistent measurement of the total symptom count for a defined period. This is a constraint in our study, which may weaken the conclusions. As our main interest is the association between symptoms and other variables, and as the associations are so strong, the main conclusions should not be hampered by the different time windows.There is a general problem in research with different studies including different symptoms and using different symptom definitions and different time frames. To avoid such limitations in future research, there is a need for consensus concerning instruments for symptom reporting.
We found that a substantial proportion of the population reported a high number of symptoms. Our results can be compared with a recent large UK study [Citation2], in respect of the associations with demographic factors, but they found a relatively lower mean number of symptoms (4 out of 22) than we did (6 out of 23). Women had more symptoms than men (1.3:1), but the gender difference was notably smaller than reported for multi-symptom syndromes like fibromyalgia, chronic fatigue syndrome, and irritable bowel syndrome [Citation16–19], implying that gender may be a less important factor in symptom reporting than is commonly believed [Citation2]. The age group 24–26 years had almost as many symptoms as the oldest age group. This may have resulted from a lower threshold for reporting complaints in younger people, complaints that older people tend to normalize [Citation20]. In some studies, an increase in symptom reporting has been related to an increase in age [Citation21], whereas other studies have not observed this effect or have even observed a decrease in symptom reporting with age [Citation22–24].
Individuals who reported poor health, low education, receipt of social security benefits and obesity had most symptoms. This is consistent both with findings in the UK study, and with previous results from the Ullensaker studies showing a strong, linear association between the number of pain sites and several demographic and health-related variables [Citation4].
We did not differentiate between “mental” and “somatic” symptoms. Earlier studies have shown a strong association between mental problems and the number of somatic symptoms [Citation7,Citation25]. Symptoms such as depression, mental stress, anxiety, sleep problems, and tiredness may precede or follow the development of pain syndromes such as fibromyalgia and chronic widespread pain [Citation26]. In our approach, we have formerly distinguished between musculoskeletal and non-musculoskeletal symptoms. In the future both epidemiological and clinical research on symptom reporting should avoid such distinctions and instead include all relevant symptoms.
As the distribution of symptoms shows no obvious cut-off point for dichotomizing data into illness and non-illness categories, but rather represents a continuum of symptoms closely related to the individual's perception of health, the burden of symptoms may be one possible precursor in multi-symptom conditions such as MUS. This is consistent with the theory that concurrent stressors cause a functional imbalance in the body resulting in “sustained arousal” or “allostatic load” [Citation10,Citation27,Citation28].
A large proportion of the population report a high number of symptoms, most likely more than is usually disclosed during a medical consultation. In our opinion assessing an individual's total symptom load is important as it can be seen not only as an expression of the individual's present health condition, but also as a vulnerability to or risk of developing disease and reduced function in the future. The burden of symptoms may be a predictor of future health and disability.
Acknowledgements
This study was financed by the Norwegian Research Council, the University of Oslo, and grants from the Fibromyalgia Association of Norway.
Ethical approval
The study was approved by the Regional Committee of Research Ethics in Norway.
Declaration of interest
The authors report no conflict of interest. The authors alone are responsible for the content and writing of the paper.
References
- Wilhelmsen I, Mulindi S, Sankok D, Wilhelmsen AB, Eriksen HR, Ursin H. Subjective health complaints are more prevalent in Maasais than in Norwegians. Nord J Psychiatry 2007;61:304–9.
- McAteer A, Elliott AM, Hannaford PC. Ascertaining the size of the symptom iceberg in a UK-wide community-based survey. Br J Gen Pract 2011;61:e1–11.
- Aiarzaguena JM, Grandes G, Salazar A, Gaminde I, Sanchez A. The diagnostic challenges presented by patients with medically unexplained symptoms in general practice. Scand J Prim Health Care 2008;26:99–105.
- Kamaleri Y, Natvig B, Ihlebaek CM, Bruusgaard D. Localized or widespread musculoskeletal pain: Does it matter? Pain 2008;138:41–6.
- Tschudi-Madsen H, Kjeldsberg M, Natvig B, Ihlebaek C, Dalen I, Kamaleri Y, . A strong association between non-musculoskeletal symptoms and musculoskeletal pain symptoms: Results from a population study. BMC Musculoskelet Disord 2011;12:285.
- Kamaleri Y, Natvig B, Ihlebaek CM, Bruusgaard D. Does the number of musculoskeletal pain sites predict work disability? A 14-year prospective study. Eur J Pain 2009;13:426–30.
- Kroenke K, Spitzer RL, Williams JB, Linzer M, Hahn SR, deGruy FV, 3rd, . Physical symptoms in primary care. Predictors of psychiatric disorders and functional impairment. Arch Fam Med 1994;3:774–9.
- Kroenke K. Patients presenting with somatic complaints: Epidemiology, psychiatric comorbidity and management. Int J Methods Psychiatr Res 2003;12:34–43.
- Kroenke K. Chronic fatigue: Frequency, causes, evaluation, and management. Compr Ther 1989;15:3–7.
- Ursin H, Eriksen H. Cognitive activation theory of stress, sensitization, and common health complaints. Ann N Y Acad Sci 2007;1113:304–10.
- Kuorinka I, Jonsson B, Kilbom A, Vinterberg H, Biering-Sorensen F, Andersson G, . Standardised Nordic questionnaires for the analysis of musculoskeletal symptoms. Appl Ergon 1987;18:233–7.
- Melchior M, Niedhammer I, Berkman LF, Goldberg M. Do psychosocial work factors and social relations exert independent effects on sickness absence? A six year prospective study of the GAZEL cohort. J Epidemiol Community Health 2003;57:285–93.
- Hansson TH, Hansson EK. The effects of common medical interventions on pain, back function, and work resumption in patients with chronic low back pain: A prospective 2-year cohort study in six countries. Spine 2000;25:3055–64.
- Lund E, Kumle M, Braaten T, Hjartaker A, Bakken K, Eggen E, . External validity in a population-based national prospective study: The Norwegian Women and Cancer Study (NOWAC). Cancer Causes Control 2003;14: 1001–8.
- Eriksen HR, Ihlebaek C, Ursin H. A scoring system for subjective health complaints (SHC). Scand J Public Health 1999;27:63–72.
- Yunus MB. Gender differences in fibromyalgia and other related syndromes. J Gend Specif Med 2002;5:42–7.
- Barsky AJ, Peekna HM, Borus JF. Somatic symptom reporting in women and men. J Gen Intern Med 2001;16: 266–75.
- Ouyang A, Wrzos HF. Contribution of gender to pathophysiology and clinical presentation of IBS: Should management be different in women?Am J Gastroenterol 2006;101: S602–9.
- Naess H, Sundal E, Myhr KM, Nyland HI. Postinfectious and chronic fatigue syndromes: Clinical experience from a tertiary-referral centre in Norway. In Vivo 2010;24: 185–8.
- Eriksen HR, Svendsrød, R., Ursin, G., Ursin, H. Prevalence of subjective health complaints in the Nordic European Countries in 1993. Eur J Public Health 1998;8:294–8.
- Kroenke K, Jackson JL, Chamberlin J. Depressive and anxiety disorders in patients presenting with physical complaints: Clinical predictors and outcome. Am J Med 1997;103: 339–47.
- Klapow J, Kroenke K, Horton T, Schmidt S, Spitzer R, Williams JB. Psychological disorders and distress in older primary care patients: A comparison of older and younger samples. Psychosom Med 2002;64:635–43.
- Kroenke K, Arrington ME, Mangelsdorff AD. The prevalence of symptoms in medical outpatients and the adequacy of therapy. Arch Intern Med 1990;150:1685–9.
- Kroenke K, Stump T, Clark DO, Callahan CM, McDonald CJ. Symptoms in hospitalized patients: Outcome and satisfaction with care. Am J Med 1999;107:425–31.
- Burton C. Beyond somatisation: A review of the understanding and treatment of medically unexplained physical symptoms (MUPS). Br J Gen Pract 2003;53:231–9.
- Yunus MB. Role of central sensitization in symptoms beyond muscle pain, and the evaluation of a patient with widespread pain. Best Pract Res Clin Rheumatol 2007; 21:481–97.
- McEwen BS. Stress, adaptation, and disease: Allostasis and allostatic load. Ann N Y Acad Sci 1998;840:33–44.
- Wyller VB, Eriksen HR, Malterud K. Can sustained arousal explain the Chronic Fatigue Syndrome?Behav Brain Funct 2009;5:10.