
Abstract
Objective A pay-for-performance (P4P) programme for primary care was introduced in 2011 by a Swedish county (with 1.6 million inhabitants). Effects on register entry practice and comparability of data for patients with diabetes mellitus were assessed.
Design and setting Observational study analysing short-term outcomes before and after introduction of a P4P programme in the study county as compared with a reference county.
Subjects A total of 84 053 patients reported to the National Diabetes Register by 349 primary care units.
Main outcome measures Completeness of data, level and target achievement of glycated haemoglobin (HbA1c), blood pressure (BP), and LDL cholesterol (LDL).
Results In the study county, newly recruited patients who were entered during the incentive programme were less well controlled than existing patients in the register – they had higher HbA1c (54.9 [54.5–55.4] vs. 53.7 [53.6–53.9] mmol/mol), BP, and LDL. The percentage of patients with entry of BP, HbA1c, LDL, albuminuria, and smoking increased in the study county but not in the reference county (+26.3% vs –1.5%). In the study county, with an incentive for BP < 130/80 mmHg, BP data entry behaviour was altered with an increased preference for sub-target BP values and a decline in zero end-digit readings (38.3% vs. 33.7%, p < 0.001).
Conclusion P4P led to increased register entry, increased completeness of data, and altered BP entry behaviour. Analysis of newly added patients and data shows that missing patients and data can cause performance to be overestimated. Potential effects on reporting quality should be considered when designing payment programmes.
A pay-for-performance programme, with a focus on data entry, was introduced in a primary care region in Sweden.
Register data entry in the National Diabetes Register increased and registration behaviour was altered, especially for blood pressure.
Newly entered patients and data during the incentive programme were less well controlled.
Missing data in a quality register can cause performance to be overestimated.
Key points
Introduction
A pay-for-performance (P4P) programme covering 40 clinical indicators was introduced in 2011 by the Västra Götaland Region (VGR) of Sweden [Citation1]. For diabetes mellitus (DM) care, financial incentives were linked to nine indicators covering register entry and the fulfilment of intermediate medical targets. Register entry and thereby reporting quality was remunerated better than medical target achievement. P4P payment was based on data in the National Diabetes Register (NDR) [Citation2].
Evidence for the effectiveness of P4P is inconclusive [Citation3–5]. The National Health Service in the UK uses a similar payment programme, which demonstrated increased quality of care for the first year after introduction [Citation6]. Concern has been expressed that adoption of P4P might elicit behaviours that jeopardize data quality, such as exclusion of patients who are not likely to reach the targets [Citation7,Citation8]. In order to use national registers as a basis for quality improvement and reimbursement, data quality must be consistent for all providers. Good reporting quality and completeness of data are important, at both the care unit and patient level [Citation9].
The effects of a P4P payment programme in a Swedish context that is based on national quality register data and that focuses on register entry quality have not been studied previously. An influx of patients and results that have not been entered previously may influence the comparability of care providers. Increased knowledge of the effects of poor reporting quality and thereby of missing data is needed.
Our aim was to assess the effects of the payment programme that had been adopted on register entry practice for individuals with DM by using patient data in the NDR. Register data quality and comparability were studied by evaluating characteristics of new patients and data that were entered after introduction of the P4P payment programme.
Material and methods
Study basis
A new P4P payment programme was introduced by VGR (the study county) on 1 January 2011. To avoid uncontrolled changes over time we included and compared data from 2010 and 2011. We chose the Skåne Region as the reference county because it is similar to VGR in terms of its primary care organization including population choice and enrolment with a primary care unit, responsibility for expenditures and the gross structure of the payment programme [Citation10]. Both counties used a fixed-payment approach for enrolled individuals (capitation) to primary care units based on age, sex, socio-economic indicators, diagnostic classification, etc. There was no payment for patient visits or contacts. NDR patient entry (regardless of the completeness of data) was rewarded in both counties during the study period. The counties are demographically similar in terms of urban and rural areas. The population of the study county in 2011 was 1.6 million and it had 200 primary care units. The reference county had 1.3 million inhabitants and 149 primary care units [Citation11].
After introduction of the P4P programme a maximum of 4% of the total income of primary care units was based on quality indicators, approximately one-quarter of which was accounted for by DM care [Citation1]. Participation of a care unit in the incentive programme was mandatory and there was no system for excluding patients. The P4P programme in the study county rewarded NDR patient entry in the same way as before, as well as the percentage of patients with:
a recorded value of HbA1c, BP, LDL cholesterol, albuminuria and smoking respectively;
HbA1c < 52 mmol/mol;
BP < 130/80 mmHg;
LDL cholesterol < 2.5 mmol/l.
Of payment linked to quality indicators, 79% involved register entry (patients 53%, separate variables in accordance with no. 1 above 5.3% each) and 21% involved intermediate medical outcomes (HbA1c and BP 5.3% each, LDL cholesterol 10.5%). The threshold for full compensation was set below 100% for all quality indicators; for example full compensation is achieved when 65% of the patients reach BP < 130/80.
The NDR was launched in 1996 as a nationwide, population-based register for quality improvement of DM care [Citation2]. Annual reporting to the register is performed by separate care units either online or through databases of clinical records. All included patients gave their informed consent. The register covers approximately 85% of Swedish patients with DM [Citation12]. The data included in the NDR are year of diagnosis, cardiovascular comorbidity, diabetes and other medical treatment, blood pressure (BP), glycated haemoglobin (HbA1c), low-density lipoprotein (LDL), occurrence of albuminuria, and smoking habits. The number of DM patients in primary care who are entered in the NDR increased steadily from approximately 144 000 in 2007 to 259 000 in 2010 and to 273 000 in 2011. The national primary care trend in 2007–2011 for HbA1c shows an increase in the mean and a decline in target fulfilment (HbA1c < 52 mmol/mol) levelling out in 2010–2011. The percentage of patients who reach the BP (<130/80 mmHg) and LDL target (<2.5 mmol/l) has also increased.
The Regional Ethical Review Board at the University of Gothenburg approved this study.
Study subjects
We obtained patient data from the NDR for the study and reference county in 2008–2011. All patients entered in the register in 2010 or 2011 for the study and reference county were included, with the exception of those who moved from one to the other between 2010 and 2011. Data for 2008–2009 were used in order to determine which patients or patient data were new to the register in 2010–2011, i.e. not having been entered for the previous two years.
Analyses were performed for patients age 18–79, the range covered by the payment programme. A total of 97% of DM cases in Swedish primary care are classified as type 2 diabetes [Citation12]. Thus, no distinction was made between whether a patient had been diagnosed with type 1 or 2 diabetes and all DM patients in primary care were included.
Data were collected in accordance with the last observation carried forward (LOCF) method. In other words, the latest entry of each variable was used for each successive year.
The descriptive clinical characteristics were age, sex, diabetes duration, BMI, albuminuria, and smoking habits. The outcome measures were HbA1c, BP, LDL cholesterol, and the percentage of patients who reached the targets: HbA1c < 52 mmol/mol, BP < 130/80 mmHg, and LDL cholesterol < 2.5 mmol/l.
Statistical methods
Descriptive statistics are presented using the arithmetic mean and standard deviation for continuous variables, as well as frequencies and percentages for categorical variables. Statistical significance tests were based on Student’s t-test for continuous variables and the chi-square test for categorical variables. For continuous dependent variables an ANCOVA model with correction for covariates was used to adjust for possible confounders: sex, DM duration, and age. A generalized linear model was used for binary dependent variables. All hypothesis tests have a two-sided alternative hypothesis; a p-value < 0.05 was considered statistically significant.
The amount of data missing from the NDR varies between patients. For each variable analysed, all patients for whom the information was available are included in the associated analyses. For example a patient, with a BP value but no information about smoking habits is included in the analysis of BP mean but not in the estimate of smoking prevalence.
For statistical analyses, we used SPSS version 20.0 (SPSS Inc., Chicago, USA).
Results
Descriptive data
Descriptive data are given in . Demographic data in each county did not change from year to year. Patients in the study county were significantly older than patients in the reference county, although the difference was small in size. The total number of registered patients increased in both counties (see ).
Table 1. Descriptive data for all patients in the NDR for the study and reference county in 2010 and 2011 (aged 18–79).
In the study county, there were significant improvements for the levels of HbA1c, BP, and LDL cholesterol from 2010 to 2011. In the reference county an improvement was seen for HbA1c and LDL cholesterol but not for BP. The change in the percentage of patients who reached the BP target (<130/80) in the study county was pronounced and corresponded only to a small change in systolic and diastolic blood pressure level. The improvement from 2010 to 2011 was significantly greater in the study county than the reference county when it came to target achievement for HbA1c, BP, and LDL cholesterol.
New patients
Levels of HbA1c, BP, and LDL cholesterol were significantly poorer and treatment intensity was lower for new than for existing patients in the register 2011 (see ). New patients are younger than existing patients and the results are adjusted for this using an ANCOVA model.
Table 2. Descriptive and outcome data for patients in the study county in 2011 with DM duration of at least two years broken down into two groups: (1) patients already in the register (existing patients) – entered in 2011 and 2009/2010); (2) new patients in the register – entered in 2011 but not 2009–2010: Crude data and adjusted for diabetes duration, age, and sex.
New data
There was a significant increase in the percentage of patients with entry of all variables (HbA1c, BP, LDL cholesterol, albuminuria, and smoking) in the study county: 71.6% vs. 56.7% (see ). In the reference county, entry rates were lower for four out of five variables.
Table 3. Percentage of patients with entry of separate variable for the study and reference county in 2010 and 2011.
The variable entry rate that increased most in the study county was for LDL cholesterol: 17.8% (see ). Patients with newly reported values were less well controlled. LDL cholesterol for 2011 was higher if data were missing for previous years: 2.68 (2.65–2.71) mmol/l with missing values for both 2009 and 2010, as opposed to 2.56 (2.55–2.58) mmol/l if entered for both 2009 and 2010 (p < 0.001). Analyses were ANCOVA-adjusted for sex, age, and diabetes duration.
Blood pressure
In the study county, the percentage of patients with BP just below the target values increased significantly (see ). BP entry was unaltered for all categories in the reference county.
Table 4. Percentage (%) of patients in various BP categories for the study and reference county in 2010 and 2011.
To better describe the impact of new BP reporting around the threshold on the overall decrease in mean BP between the years, we analysed mean systolic BP (SBP) for 2011 throughout the range of systolic BP for 2010 ().
Figure 1. Mean systolic blood pressure in 2011 (Y-axis) for each 1 mm blood pressure reading in 2010 (X-axis) for the study and reference county (98.9% of patients had SBP of 100–180 in 2010).
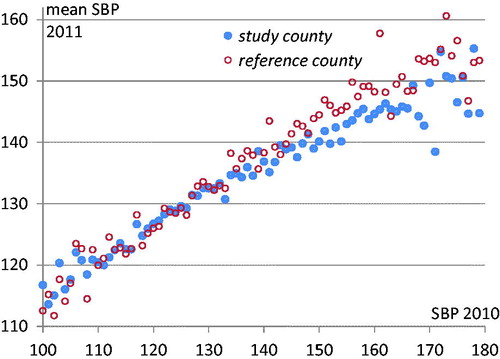
The lower SBP in the study county for 2011 as seen in (133.8 vs. 135.6 mmHg, p < 0.001) is primarily the result of lower SBP above the target of 130 mmHg (see ).
Patients with SBP ≥ 130 in 2010 had lower SBP in 2011 in the study county than the reference county (137.5 vs. 139.8, p < 0.001) while if SBP < 130 in 2010, mean SBP 2011 was slightly higher in the study county (125.9 vs. 125.4, p = 0.064). For patients with poorly controlled SBP (≥140) the lowering in systolic BP from 2010 to 2011 was greater in the study county than in the reference county (–9.3 vs. –6.3 mmHg, p < 0.001). For patients with SBP 2010 < 140, there was no significant difference in SBP change between the counties. Analyses were adjusted for age, sex, and diabetes duration.
Discussion
Statement of principal findings
Significant and clinically relevant changes in register entry behaviour were seen after adoption of a detailed P4P payment programme. Data quality increased in terms of patient coverage and completeness of data. Newly recruited patients and data differed from existing patients suggesting that there are comparability problems when coverage is low.
Strengths and weaknesses
Data are comprehensive and reliable due to a high degree of automated data collection and the absence of a system for excluding patients, leading to high coverage in the NDR. Although this is a short-term study, we observed distinct changes in entry practice. Separating out the effects of intervention in a natural experiment is a well-known problem (4). However, we were partly able to overcome the problem by using a reference county, since Swedish regions design their payment programmes independently, and by restricting the study period to one year [Citation10].
Findings in relation to other studies
Our results concerning increased register entry and completeness of data concur well with findings in previous studies [Citation6,Citation7,Citation13–18]. The most detailed reports describe the Quality and Outcomes Framework (QoF) in the UK. An important difference between the payment programme in the study county and QoF is that payment linked to reporting quality in DM care accounts for 15% in the UK, as opposed to over 75% in our study county. The P4P component of the payment programme in the study county, however, accounts for a substantially smaller proportion of total revenues for primary care practices (approximately 4%) than with QoF (approximately 25%). Thus, P4P in DM care accounts for about 1% as opposed to 2.5% of total revenues [Citation1,Citation13,Citation19]. Although a smaller portion of payment was linked to P4P in the study county – primarily for register entry rather than medical outcomes – there was a significant impact on care provider behaviour. Care provider behaviour, under a payment programme with a high degree of fixed capitated payment, has earlier been shown to be responsive also to a small size P4P programme [Citation20]. As in earlier studies, a better baseline value was associated with poorer improvement [Citation15]. For example, in the study county the register data entry of LDL cholesterol increased from 70.2% to 82.7% while for HbA1c the increase was only 0.9 percentage points from 94.4% to 95.3%.
Importantly, we found that patients who were not newly diagnosed but were entered in the register after the introduction of the payment programme were less well controlled for HbA1c, BP, and LDL cholesterol than patients who had already been entered. We also found that new LDL cholesterol values for previously known patients were higher than for patients with repeated entries. A similar result was seen for patients not included in a clinical surgical database – their outcomes were worse than included patients [Citation21]. This also implies that patients and data that are missing from a register can cause performance to be overestimated and more importantly that not all patients with the greatest need of treatment improvement are included in the quality register. A problem that has been discussed in other studies is the exclusion of patients who are less likely to reach treatment goals [Citation7,Citation8]. When introducing a payment programme that rewards well-treated patients, one concern is that patients who are difficult to treat may be excluded. This concern is not supported by our study, most likely due to the design of the payment programme, given that the emphasis is on register entry quality rather than medical outcomes.
In line with earlier studies, we saw a changed reporting of BP readings around the target value with an increased preference for BP values just below the target [Citation22,Citation23]. We also noticed an avoidance of the threshold value that did not qualify for payment. In an earlier study, there was an increased preference for sub-target end digits, and the proportion of zero end-digit readings declined after the introduction of a P4P programme that incentivized BP [Citation23]. Despite an altered entry pattern around the threshold value and a substantially higher percentage of patients who reached the target, blood pressure was only moderately lower. Our data indicate that the decrease in blood pressure reflected the higher range (>140) and not the area around the threshold. The impact of financial incentives on register entry behaviour in the study county was also demonstrated in a study in which diagnosis entry behaviour changed when payment was linked to a case-mix index based on diagnoses by which chronic diseases qualified for higher remuneration than minor health problems [Citation24].
A problem with financial incentives linked to targets is that the primary focus may be on keeping as many patients as possible below the target, ignoring mean value, variation, and improvement over time [Citation25]. We could not confirm such a behaviour in our study. The percentage of patients with poorly controlled DM (HbA1c > 72 mmol/mol) did not increase in this study and despite effect on register entry behaviour for blood pressure around the target, there was a decrease in higher blood pressures levels for many patients. More importantly, more patients at greater risk were included in the register during the study.
Conclusion
In summary, P4P led to increased register entry and completeness of data. Newly recruited patients who were entered during the incentive programme were less well controlled for the studied risk factors than existing patients. The same applied to newly recruited data. Thus, patients and data that are missing from a quality register can cause performance to be overestimated. A payment programme, such as the one implemented in the study county, favours register entry aspects and thereby gives the possibility to promote inclusion of patients who need a systematic quality improvement effort.
It is important to consider effects on reporting quality when designing payment programmes and when using register data for comparing care providers.
Ethical approval
The study was approved by the Regional Ethical Review Board in Gothenburg.
Declaration of interest
The authors report no conflicts of interest. The authors alone are responsible for the content and writing of the paper.
Postgraduate studies were funded by Närhälsan R&D Health Care, R&D Centre Gothenburg, and Södra Bohuslän. The project is also granted funds from the Local Research and Development Board for Gothenburg and Södra Bohuslän.
References
- Krav- och kvalitetsbok. Förfrågningsunderlag med förutsättningar för att bedriva vårdverksamhet inom VG Primärvård. Gällande från och med 2011 [Demands and quality, tender request documentation with requirements for running health care in Västra Götaland primary care]. Vänersborg: Västra Götalandsregionen; 2011.
- Gudbjornsdottir S, Cederholm J, Nilsson PM, Eliasson B. The National Diabetes Register in Sweden: An implementation of the St. Vincent Declaration for Quality Improvement in Diabetes Care. Diabetes Care 2003;26:1270–6.
- Scott A, Sivey P, Ait Ouakrim D, Willenberg L, Naccarella L, Furler J, et al. The effect of financial incentives on the quality of health care provided by primary care physicians. Cochrane Database Syst Rev 2011 Sep 7(9):CD008451.
- Flodgren G, Eccles MP, Shepperd S, Scott A, Parmelli E, Beyer FR. An overview of reviews evaluating the effectiveness of financial incentives in changing healthcare professional behaviours and patient outcomes. Cochrane Database Syst Rev 2011 Jul 6;(7):CD009255.
- Eijkenaar F, Emmert M, Scheppach M, Schoffski O. Effects of pay for performance in health care: A systematic review of systematic reviews. Health Policy. 2013;110:115–30. Epub 2013/02/06.
- Kontopantelis E, Reeves D, Valderas JM, Campbell S, Doran T. Recorded quality of primary care for patients with diabetes in England before and after the introduction of a financial incentive scheme: A longitudinal observational study. BMJ Qual Saf 2013;22:53–64.
- Chang RE, Lin SP, Aron DC. A pay-for-performance program in Taiwan improved care for some diabetes patients, but doctors may have excluded sicker ones. Health Aff (Millwood) 2012;31:93–102.
- Dalton AR, Alshamsan R, Majeed A, Millett C. Exclusion of patients from quality measurement of diabetes care in the UK pay-for-performance programme. Diabet Med 2011;28:525–31.
- Rystedt J, Montgomery A, Persson G. Completeness and correctness of cholecystectomy data in a national register: Gallriks. Scand J Surg 2014 Dec;103(4):237–44.
- Anell A. Choice and privatisation in Swedish primary care. Health Econ Policy Law 2011;6:549–69.
- Statistisk årsbok för Sverige 2013 [Statistical Yearbook of Sweden 2013]. Stockholm: SCB, Statistics Sweden, Communication Department; 2013.
- Nationella Diabetesregistret Årsrapport 2011 [The National Diabetes Registry Annual report 2011]. Västra Götaland: Registercentrum, Nationella Diabetesregistret (NDR); 2011.
- Campbell SM, Reeves D, Kontopantelis E, Sibbald B, Roland M. Effects of pay for performance on the quality of primary care in England. N Engl J Med 2009;361:368–78.
- Campbell S, Reeves D, Kontopantelis E, Middleton E, Sibbald B, Roland M. Quality of primary care in England with the introduction of pay for performance. N Engl J Med 2007;357:181–90.
- Kirschner K, Braspenning J, Akkermans RP, Annelies Jacobs JE, Grol R. Assessment of a pay-for-performance program in primary care designed by target users. Fam Pract 2013 Apr;30(2):161–71.
- Chen JY, Tian H, Taira Juarez D, Hodges KA, Jr, Brand JC, Chung RS, et al. The effect of a PPO pay-for-performance program on patients with diabetes. Am J Manag Care 2010 Jan 1;16(1):e11–9.
- Lai CL, Hou YH. The association of clinical guideline adherence and pay-for-performance among patients with diabetes. J Chin Med Assoc 2013;76:102–7.
- Cheng SH, Lee TT, Chen CC. A longitudinal examination of a pay-for-performance program for diabetes care: Evidence from a natural experiment. Med Care 2012;50:109–16.
- Quality and outcomes framework: Achievement, prevalence and exceptions data, 2011/12. V1.0. Leeds: Prescribing and Primary Care Team, Health and Social Care Information Centre; 2012.
- Kantarevic J, Kralj B. Link between pay for performance incentives and physician payment mechanisms: Evidence from the Diabetes Management Incentive in Ontario. Health Econ 2013 Dec;22(12):1417–39.
- Elfstrom J, Stubberod A, Troeng T. Patients not included in medical audit have a worse outcome than those included. Int J Qual Health Care 1996;8:153–7.
- Carey IM, Nightingale CM, DeWilde S, Harris T, Whincup PH, Cook DG. Blood pressure recording bias during a period when the Quality and Outcomes Framework was introduced. J Hum Hypertens 2009;23:764–70.
- Alsanjari ON, de Lusignan S, van Vlymen J, Gallagher H, Millett C, Harris K, et al. Trends and transient change in end-digit preference in blood pressure recording: Studies of sequential and longitudinal collected primary care data. Int J Clin Pract 2012 Jan;66(1):37–43.
- Hjerpe P, Bostrom KB, Lindblad U, Merlo J. Increased registration of hypertension and cancer diagnoses after the introduction of a new reimbursement system. Scand J Prim Health Care 2012;30:222–8.
- Bergman B. Ännu bättre vård – vad kan vi lära från variationen i öppna jämförelser? [Even better care – what can we learn from the variation in open comparisons?]. Stockholm: Sveriges kommuner och landsting (SKL); 2012.