Abstract
Background. The prognostic and predictive value of magnetic resonance (MR) investigations in clinical oncology may be improved by implementing strategies for discriminating between viable and necrotic tissue in tumors. The purpose of this preclinical study was to investigate whether the extent of necrosis in tumors can be assessed by dynamic contrast-enhanced magnetic resonance imaging (DCE-MRI) and/or T2-weighted MR imaging. Material and methods. Three amelanotic human melanoma xenograft lines differing substantially in tumor necrotic fraction, necrotic pattern, extracellular volume fraction, and blood perfusion were used as experimental models of human cancer. MRI was performed at 1.5 T and a spatial resolution of 0.23 × 0.47 × 2.0 mm3. Gadolinium diethylene-triamine penta-acetic acid (Gd-DTPA) was used as contrast agent. Plots of Gd-DTPA concentration versus time were generated for each voxel, and three parameters were calculated for each curve: the extracellular volume fraction (νe), the final slope (a), and the Gd-DTPA concentration at one minute after the contrast administration (C1min). Parametric images of νe, a, C1min, and the signal intensity in T2-weighted images (SIT2W) were compared with the histology of the imaged tissue. Results. The νe, a, and C1min frequency distributions were significantly different for necrotic and viable tissue in all three tumor lines. By using adequate values of νe, a, and C1min to discriminate between necrotic and viable tissue, significant correlations were found between the fraction of necrotic tissue assessed by MRI and the fraction of necrotic tissue assessed by image analysis of histological preparations. On the other hand, the SIT2W frequency distributions did not differ significantly between necrotic and viable tissue in two of the three tumor lines. Conclusion. Necrotic regions in tumor tissue can be identified in parametric images derived from DCE-MRI series, whereas T2-weighted images are unsuitable for detection of tumor necrosis.
The microvasculature of most malignant tumors shows severe morphological and architectural abnormalities, and these abnormalities result in inadequate and heterogeneous blood supply and the development of regions with necrotic tissue [Citation1]. Histological examinations have revealed that the pattern of necrosis can differ substantially among individual tumors resected from the same organ. Some tumors show a few large necrotic regions centrally, whereas others develop many small necrotic foci throughout the tissue [Citation2,Citation3]. Necrotic tumor regions do not represent a therapeutic problem, but may confound biological and physiological studies of malignant tissues [Citation4]. Moreover, the development of necrosis in malignant tissues after treatment may provide information on tumor treatment response [Citation5]. A non-invasive method for assessing the fraction of necrotic tissue in tumors is therefore highly warranted.
Several magnetic resonance (MR) techniques have been used to detect tumor necrosis, including dynamic contrast-enhanced imaging, T2-weighted spin echo imaging, diffusion weighted imaging, phosphorous spectroscopy, and contrast-enhanced imaging with contrast agents showing high affinity for necrotic tissue [Citation6–11]. However, the usefulness of these strategies is uncertain as detailed comparative MR and histological studies investigating their general validity are sparse.
The potential of gadolinium diethylene-triamine penta-acetic acid (Gd-DTPA)-based dynamic contrast-enhanced magnetic resonance imaging (DCE-MRI) for characterizing the physiological microenvironment of tumors is currently being investigated in our laboratory by using human tumor xenografts as preclinical models of human cancer [Citation12–17]. In these studies, images of Ktrans (the volume transfer constant of Gd-DTPA) and νe (the extracellular volume fraction of the imaged tissue) are obtained by subjecting DCE-MRI series to pharmacokinetic analysis using the modified Kety model developed by Tofts et al. [Citation18]. We have shown that our experimental procedure produces highly reproducible parametric images of Ktrans and νe [Citation12,Citation15] and that the numerical values of E·F (a Ktrans-related parameter) and νe are closely related to the absolute values of blood perfusion and extracellular volume fraction in the viable tissue regions of human melanoma xenografts [Citation16]. Furthermore, even though the Tofts pharmacokinetic model is not valid for necrotic tissue, our algorithms produce very low Ktrans values for voxels in tumor regions with extensive necrosis, consistent with the assumption of no blood perfusion in necrotic tissue [Citation16]. The main purpose of the study reported here was to investigate whether the fraction of necrotic tissue in tumors can be assessed accurately by DCE-MRI and/or T2-weighted MR imaging. The study was based on previous work in our laboratory having suggested that pharmacokinetic analysis of DCE-MRI series may produce unphysiological values for νe in tumor necroses [Citation17] and that tumor necroses may show shorter T2 values than viable tissue [Citation7]. Three human melanoma xenograft lines differing substantially in necrotic fraction, necrotic pattern, extracellular volume fraction, and blood perfusion were used as tumor models.
Material and methods
Tumor models
T-22, V-27, and Z-98 human melanoma xenografts growing in adult (8–12 weeks of age) female BALB/c nu/nu mice were used as tumor models. Tumors were initiated from established cell lines cultured in RPMI-1640 (25 mM HEPES and L-glutamine) supplemented with 13% bovine calf serum, 250 mg/l penicillin, and 50 mg/l streptomycin. Approximately 5 × 10⁵ cells in 10 μl of Hanks’ balanced salt solution were inoculated intradermally in the mouse leg. The mice were kept under specific pathogen-free conditions and were given sterilized food and tap water ad libitum. Experiments were initiated when the tumors had grown to a volume of 100–600 mm3. Tumor volume (V) was calculated as V = π/6 × a × b2, where a is the longer and b is the shorter of two perpendicular diameters. MR imaging was carried out with anesthetized mice. Fentanyl citrate (Janssen Pharmaceutica, Beerse, Belgium), fluanisone (Janssen Pharmaceutica), and midazolam (Hoffmann-La Roche, Basel, Switzerland) were administered intraperitoneally in doses of 0.63 mg/kg, 20 mg/kg, and 10 mg/kg, respectively. Animal care and experimental procedures were approved by the Institutional Committee on Research Animal Care and were performed in accordance with the Interdisciplinary Principles and Guidelines for the Use of Animals in Research, Marketing, and Education (New York Academy of Sciences, New York, NY).
Contrast agent
Gd-DTPA (Schering, Berlin, Germany), diluted in 0.9% saline to a final concentration of 0.06 M, was used as contrast agent. The contrast agent was administered in the tail vein of the mice in a bolus dose of 5.0 ml/kg. The administration was performed after the mice had been placed in the MR scanner by using a 24G-neoflon connected to a syringe by a polyethylene tubing.
MRI
MRI was performed with a 1.5-T whole-body scanner (Signa, General Electric, Milwaukee, WI) and a cylindrical slotted tube resonator transceiver coil constructed for mice [Citation12,Citation17]. The coil was insulated with styrofoam to prevent excessive heat loss from the mice. The body core temperature of the mice was kept at 37–38°C during imaging by using a thermostatically regulated heating pad. Two calibration tubes, one with 0.5 mM Gd-DTPA in 0.9% saline and the other with 0.9% saline only, were placed adjacent to the mice in the coil. The mice were placed in the scanner with the tumor in the isocenter, and the tumors were imaged axially in a single scan through the tumor center. A scan thickness of 2 mm was used, and the number of excitations was one. The image matrix was 256 × 64 with a field of view of 6 × 3 cm2, corresponding to a voxel size of 0.23 × 0.47 × 2.0 mm3. Interpolation algorithms applied by the imaging system resulted in an apparent resolution of 0.23 × 0.23 × 2.0 mm3.
DCE-MRI series consisting of two types of spoiled recalled gradient images were recorded: proton density images with TR = 900 ms, TE = 3.2 ms, and α = 20°, and T1-weighted images with TR = 200 ms, TE = 3.2 ms, and α = 80°. Two proton density images and three T1-weighted images were acquired before the contrast agent was administered. The durations of the sequences were 64 s and 14 s, respectively. After the administration of contrast agent, T1-weighted images were recorded every 14 s for 15 min. Finally, two proton density image were acquired. Prior to the DCE-MRI, T2-weighted signal intensity images were recorded by using a spin echo sequence with TR = 5000 ms and TE = 65 ms. The strengths and weaknesses of our MRI methods have been discussed in great detail in several previous reports [Citation13,Citation14,Citation16].
Image processing and data analysis
Tumor images were stored in the DICOM format and analyzed by using in-house-made software developed in IDL (Interactive Data Language, Boulder, CO). Gd-DTPA concentrations were calculated from signal intensities as described by Hittmair et al. [Citation19]. Curves for Gd-DTPA concentration versus time were generated for each voxel, and three parameters were calculated for each curve: the extracellular volume fraction (νe) was calculated by using the arterial input function determined by Benjaminsen et al. [Citation12] and the Tofts pharmacokinetic model [Citation18] as described earlier [Citation14,Citation17], the final slope (a) was calculated by linear regression analysis using the five last minutes of the recordings, and the concentration of Gd-DTPA in the tumor tissue at one minute after the Gd-DTPA administration (C1min) was calculated as the mean of the measurements recorded 45–75 s after the contrast administration. Images of νe, a, C1min, and the signal intensity in T2-weighted images (SIT2W) were generated by using the SigmaPlot software (SPSS Science, Chicago, IL).
Assessment of fraction of necrotic tissue
Histological sections were prepared from the tumors subjected to MRI for assessment of the fraction of necrotic tissue. To ensure that the histological sections matched the MR scans, we marked off the central axial scan on the tumors with a felt-tip pen and euthanized the mice immediately after imaging. The tumors were then cut into two halves along the middle of the scan, resected, and fixed in phosphate-buffered 4% paraformaldehyde. Three to six histological sections, separated by ˜400 μm, were cut from the central axial plane of each tumor, corresponding to the 2-mm-thick MR scan. The histological sections were stained with hematoxylin and eosin using standard procedures. The fraction of necrotic tissue (i.e., the area fraction showing necrotic tissue) was determined by subjecting the histological sections to image analysis [Citation17].
Statistical analysis
Statistical comparisons of data were performed by using the Student's t-test when the data complied with the conditions of normality and equal variance. Under other conditions, comparisons were carried out by nonparametric analysis using the Mann-Whitney rank-sum test. The Kolmogorov-Smirnov method was used to test for normality. The Bonferroni method was used to correct for multiple comparisons. Comparisons of pooled frequency distributions were based on the median values of the underlying single frequency distributions. Correlations between two parameters were searched for by linear regression analysis. Probability values (p) and correlation coefficients (R2) were calculated by using the SigmaStat statistical software (SPSS Science). A significance criterion of p < 0.05, determined from two-sided test, was used.
Results
A total of 12 T-22 tumors, 14 V-27 tumors, and 11 Z-98 tumors were subjected to MRI and subsequent histological examination. The necrotic pattern differed substantially among the tumor lines (). The T-22 tumors showed several small necroses distributed throughout the tissue, most V-27 tumors had a large central necrosis, and the Z-98 tumors exhibited one or more medium-sized necrotic regions, frequently with islands of viable tissue within the necroses.
Figure 1. Histological images (a) and plots of Gd-DTPA concentration versus time for single voxels located in necrotic (●,■) or viable (○,□) tissue (b) of representative T-22, V-27, and Z-98 tumors.
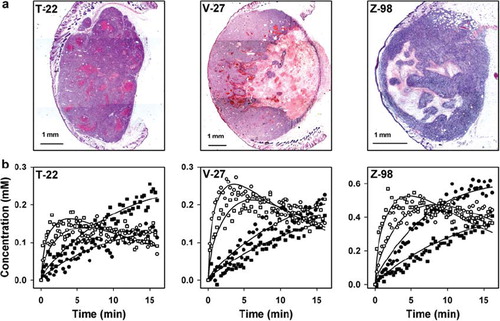
The curves for Gd-DTPA concentration versus time differed substantially between voxels in necrotic tissue and voxels in viable tissue in all tumor lines (). Voxels in viable tissue generally showed curves with a clear maximum, consistent with rapid uptake and slow washout of Gd-DTPA. In the vast majority of the voxels, the maximum occurred within the first 10 minutes of the recordings, and was followed by a linear decrease in the Gd-DTPA concentration. In contrast, the curves for most voxels in necrotic tissue were nearly linear during the whole imaging period, consistent with slow diffusion of Gd-DTPA into the necrotic tissue from the surrounding viable tissue. By calculating the final slopes of the curves from the five last minutes of the recordings, we hypothesized that the numerical value of a would be negative for most voxels in viable tissue and positive for most voxels in necrotic tissue. Furthermore, based on these Gd-DTPA uptake curves, we hypothesized that C1min would discriminate well between viable and necrotic tissue and clearly better than the maximum Gd-DTPA concentration.
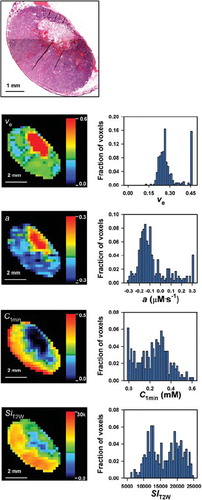
To investigate whether necrotic tumor regions were identifiable in parametric MR images, images of νe, a, C1min, and SIT2W were compared with histological preparations from the imaged tissue. One example is illustrated in , which shows a histological image and the corresponding parametric MR images of a representative V-27 tumor. In general, large necroses were easily recognizable in νe, a, and C1min images, whereas SIT2W images depicted necrotic regions less clearly.
Figure 2. A histological image and parametric MR images and frequency distributions of νe, a, C1min, and SIT2W for a representative V-27 tumor.
To investigate whether the numerical values of νe, a, C1min, and SIT2W differed between necrotic and viable tissue, νe, a, C1min, and SIT2W frequency distributions were determined for tumor regions consisting of necrotic tissue only and tumor regions consisting of viable tissue only (). Each of the frequency distributions in is based on five tumor regions, identified by examining all histological preparations from an imaged tissue. The νe frequency distributions for viable tissue differed among the tumor lines (p < 0.01), and the numerical values were similar to those typical for the extracellular volume fraction of tumors. On the other hand, unphysiological νe values were achieved for large fractions of the voxels in necrotic tissue. The parameter a had a negative value for most voxels in viable tissue and a positive value for the majority of the voxels in necrotic tumor regions, consistent with our hypothesis. C1min had a positive value for the voxels in viable tissue and was close to zero for most voxels in necroses. The νe, a, and C1min frequency distributions were significantly different for necrotic and viable tissue in all three tumor lines (p < 0.01). However, despite these differences, the overlap was substantial regardless of whether νe, a, or C1min was considered. The frequency distributions for SIT2W, on the other hand, did not differ between necrotic and viable tissue in T-22 and Z-98 tumors (p > 0.05), but the SIT2W values were significantly higher for viable than for necrotic tissue in V-27 tumors (p < 0.05).
Figure 3. Frequency distributions of νe, a, C1min, and SIT2W for viable and necrotic tissue in T-22, V-27, and Z-98 tumors. Each frequency distribution represents pooled data from five tumor regions.
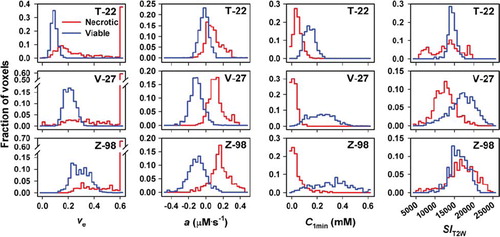
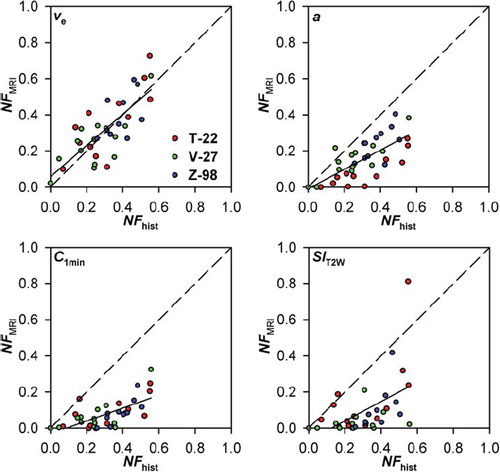
The frequency distributions in suggested that voxels in viable tissue have νe values below 0.15 (T-22), 0.35 (V-27), or 0.45 (Z-98), a values below 0.1 mM·s–1 (T-22, V-27) or 0.15 mM·s–1 (Z-98), C1min values above 0.05 mM (T-22) or 0 mM (V-27, Z-98), and SIT2W values between 12000 and 17500 (T-22), 7000 and 25000 (V-27), or 11000 and 22000 (Z-98). To investigate whether the fraction of voxels with νe, a, C1min, or SIT2W values outside these threshold values (NFMRI) reflected the fraction of necrotic tissue as assessed by histological examination (NFhist), plots of NFMRI versus NFhist were generated for each MR parameter (). Linear correlations were found between NFMRI and NFhist for both νe (p < 0.0001; R2 = 0.59), a (p < 0.0001; R2 = 0.51), C1min (p < 0.0001; R2 = 0.43), and SIT2W (p = 0.0017; R2 = 0.25). The correlation between NFMRI and NFhist for νe was consistent with a one-to-one correlation, whereas NFhist was underestimated by NFMRI for a, C1min, and SIT2W.
Figure 4. Fraction of necrotic tissue assessed by MRI (NFMRI) versus fraction of necrotic tissue assessed by histological analysis (NFhist) for T-22, V-27, and Z-98 tumors. NFMRI refers to the fraction of voxels with numerical values of νe, a, C1min, and SIT2W outside those detected in viable tissue in each of the tumor lines. The solid lines were fitted to the data by regression analysis. The dashed lines represent theoretical one-to-one correlations.
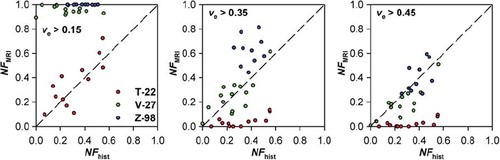
The one-to-one correlation between NFMRI and NFhist for νe in was achieved by using different νe threshold values for the different tumor lines. To investigate whether significant correlations between NFMRI and NFhist could be achieved by using the same νe threshold value for all tumor lines, plots of NFMRI versus NFhist were generated for νe threshold values of 0.15, 0.35, and 0.45 (i.e., the optimal νe threshold value for T-22, V-27, and Z-98 tumors, respectively). However, each of these threshold values resulted in NFMRI values that were either significantly higher or significantly lower than NFhist for at least one of the tumor lines ().
Figure 5. Fraction of necrotic tissue assessed by MRI (NFMRI) versus fraction of necrotic tissue assessed by histological analysis (NFhist) for T-22, V-27, and Z-98 tumors. NFMRI refers to the fraction of voxels with νe values > 0.15, 0.35, and 0.45. The dashed lines represent theoretical one-to-one correlations.
Discussion
Several institutions are attempting to develop biomarkers and predictive assays for the outcome of treatment of cancer patients based on DCE-MRI [Citation20,Citation21]. Moreover, DCE-MRI is being used to monitor the response to treatment of cancer patients [Citation22]. The prognostic value of DCE-MRI and its usefulness in prediction and monitoring of tumor treatment response may be improved substantially by implementing adequate methods for differentiating between necrotic and viable tissue.
In the present work, the T-22, V-27, and Z-98 melanoma xenograft lines were used as preclinical models to investigate whether the fraction of necrotic tissue in tumors can be assessed by DCE-MRI and/or T2-weighted imaging. These lines differ substantially in tumor necrotic fraction, pattern of necrosis, extracellular volume fraction, and blood perfusion and should thus be suitable models for elucidating the questions addressed in the present study. However, the tumor lines were of the same histological type and, consequently, it may be necessary to perform similar experiments with xenografted tumors of other histologies to investigate the general validity of our conclusions.
Parametric images of νe, a, C1min, and SIT2W were generated and compared with the histology of the imaged tissue. These parameters were selected because parameters related to a, C1min, and SIT2W are being used to identify necrotic regions in preclinical and clinical studies without experimental verification of their validity as adequate measures of tumor necrosis [Citation23–25]. Significant correlations between NFMRI and NFhist were found for all four parameters. However, there are weaknesses associated with each of these parameters since none of them provided distinctly different numerical values for necrotic and viable tissue.
Voxels with unphysiological νe values colocalized with necrotic regions in histological sections, and the fraction of voxels with νe values higher than those found in viable tissue showed a strong one-to-one correlation with NFhist. However, a one-to-one correlation between NFMRI and NFhist required the use tumor line-specific threshold values for the upper limit of νe in viable tissue. The use of common threshold νe values, on the other hand, resulted in NFhist being significantly overestimated or significantly underestimated by NFMRI in at least one of the tumor lines, most likely because the extracellular volume fraction of the viable tissue differed significantly among the tumor lines. These observations suggest that the fraction of voxels with unphysiological νe values is an excellent parameter for the fraction of necrotic tissue in experimental tumors, where the upper limit of the νe of viable tissue can be determined easily. However, since the fraction of voxels with unphysiological νe values is sensitive to this threshold νe value, the usefulness of the fraction of voxels with unphysiological νe values as a parameter for tumor necrosis may be limited in clinical DCE-MRI.
Moreover, NFMRI showed significant correlations to NFhist both when the fraction of voxels with a values higher than those found in viable tissue and when the fraction of voxels with C1min values lower than those found in viable tissue were used as parameters for NFMRI. The correlations were found to be insensitive to the exact time interval used for the calculation of a as long as the starting point of the regression analysis was beyond the time point where the majority of the voxels in viable tissue had their maximum value and the time interval was sufficiently long that the outcome of the regression analysis was not influenced significantly by noise, and insensitive to the exact time point used for assessing the concentration of Gd-DTPA as long as it was early in the observation period, but sufficiently late to have a significant uptake of Gd-DTPA in the viable tissue. However, although significant correlations were found, NFhist was underestimated by NFMRI for both parameters of NFMRI, primarily because a significant proportion of the voxels in necrotic tissue showed a values and C1min values similar to those found in viable tissue. Typically, low a values and high C1min values were found in small necroses and in the periphery of large necroses, probably because Gd-DTPA diffused into necrotic tissue from the surrounding viable tissue [Citation17]. Furthermore, it is also possible that NFMRI underestimated NFhist because a large proportion of the voxels consisting of a mixture of necrotic and viable tissue may have shown low a values and/or high C1min values.
T-22 and Z-98 tumors showed SIT2W frequency distributions that were not significantly different for necrotic and viable tissue. Consequently, necrotic regions cannot be detected in T2-weighted images of tumors similar to the T-22 and Z-98 tumors studied here.
The MRI was carried out by using a voxel size of 0.23 × 0.47 × 2.0 mm3. This voxel size is large compared with the size of many necrotic structures, implying that a significant proportion of the voxels contained a mixture of viable and necrotic tissue. It is thus possible that any correlation between NFMRI and NFhist would be improved by increasing the spatial resolution of the MRI. An increased spatial resolution would probably make it possible to detect a larger number of small necroses and, hence, would be particularly beneficial in examinations of tumors with many small necrotic foci scattered throughout the tissue. Furthermore, an increased spatial resolution would probably improve the delineation of large necrotic regions in any parametric MR image of tumors. However, the spatial resolution used here is similar to or higher than that commonly used in clinical MRI [Citation20–22] and, hence, the present observations should be clinically relevant.
Several investigators have suggested that tumor necrosis can be detected by diffusion-weighted [Citation8] or T1-weighted [Citation26] MRI. These possibilities have been investigated earlier in our laboratory by using melanoma xenografts as tumor models [Citation7,Citation27]. The apparent diffusion coefficient (ADC) was found to correlate well with the fraction of necrotic tissue in D-12 tumors but not in U-25 tumors, suggesting that ADC maps may be used to quantify necrosis in some but not in all experimental tumors [Citation27]. T1 was found to be shorter in the necrotic tissue than in the surrounding viable tissue of BEX-t, HUX-t, and SAX-t tumors, but the delineation of the necroses in T1-weighted and pure T1 images did not correspond well to the histological appearance of the necroses [Citation7].
In summary, our preclinical study suggests that tumor necrosis can be identified accurately in νe images provided that the upper limit of the νe of the viable tissue can be determined. Furthermore, tumor necrosis can also be detected in images of a and C1min related parameters, but the borderline between viable and necrotic tissue may be diffuse due to diffusion of contrast agent from the viable tissue into the necrotic tissue. On the other hand, T2-weighted signal intensity images may be unsuitable for detecting tumor necrosis because the signal intensity distributions in viable and necrotic tissue are similar in some tumors.
Acknowledgements
Financial support was received from the Norwegian Cancer Society and the South-Eastern Norway Regional Health Authority.
Declaration of interest: The authors report no conflicts of interest. The authors alone are responsible for the content and writing of the paper.
References
- Jain RK. Determinants of tumor blood flow: A review. Cancer Res 1988;48:2641–58.
- Steel GG. Growth kinetics of tumors. Oxford UK: Clarendon Press; 1977.
- Vaupel P, Kallinowski F, Okunieff P. Blood flow, oxygen and nutrient supply, and metabolic microenvironment of human tumors: A review. Cancer Res 1989;49:6449–65.
- Fenton BM, Kiani MF, Siemann DW. Should direct measurements of tumor oxygenation relate to the radiobiological hypoxic fraction of a tumor? Int J Radiat Oncol Biol Phys 1995;33:365–73.
- Verheij M. Clinical biomarkers and imaging for radiotherapy-induced cell death. Cancer Metastasis Rev 2008;27: 471–80.
- Toms AP, White LM, Kandel R, Bleakney RR, Noseworthy M, Lee S, . Limitations of single slice dynamic contrast enhanced MR in pharmacokinetic modeling of bone sarcomas. Acta Radiol 2009;50:512–20.
- Jakobsen I, Kaalhus O, Lyng H, Rofstad EK. Detection of necrosis in human tumour xenografts by proton magnetic resonance imaging. Br J Cancer 1995;71:456–61.
- Vossen JA, Buijs M, Geschwind JF, Liapi E, Prieto V, Lee KH, . Diffusion-weighted and Gd-EOB-DTPA-contrast-enhanced magnetic resonance imaging for characterization of tumor necrosis in an animal model. J Comput Assist Tomogr 2009;33:626–30.
- Kettelhack C, Wickede M, Vogl T, Schneider U, Hohenberger P. 31Phosphorus-magnetic resonance spectroscopy to assess histologic tumor response noninvasively after isolated limb perfusion for soft tissue tumors. Cancer 2002;94:1557–64.
- Bremer C, Bankert J, Filler T, Ebert W, Tombach B, Reimer P. High-dose Gd-DTPA vs. Bis-Gd-mesoporphyrin for monitoring laser-induced tissue necrosis. J Magn Reson Imaging 2005;21:801–8.
- Metz S, Daldrup-Unk HE, Richter T, Räth C, Ebert W, Settles M, . Detection and quantification of breast tumor necrosis with MR imaging: Value of the necrosis-avid contrast agent Gadophrin-3. Acad Radiol 2003;10:484–90.
- Benjaminsen IC, Graff BA, Brurberg KG, Rofstad EK. Assessment of tumor blood perfusion by high-resolution dynamic contrast-enhanced MRI: A preclinical study of human melanoma xenografts. Magn Reson Med 2004;52: 269–76.
- Graff BA, Benjaminsen IC, Brurberg KG, Ruud EBM, Rofstad EK. Comparison of tumor blood perfusion assessed by dynamic contrast-enhanced MRI with tumor blood supply assessed by invasive imaging. J Magn Reson Imaging 2005;21:272–81.
- Vestvik IK, Egeland TA, Gaustad JV, Mathiesen B, Rofstad EK. Assessment of microvascular density, extracellular volume fraction, and radiobiological hypoxia in human melanoma xenografts by dynamic contrast-enhanced MRI. J Magn Reson Imaging 2007;26:1033–42.
- Benjaminsen IC, Brurberg KG, Ruud EBM, Rofstad EK. Assessment of extravascular extracellular space fraction in human melanoma xenografts by DCE-MRI and kinetic modeling. Magn Reson Imaging 2008;26:160–70.
- Egeland TAM, Simonsen TG, Gaustad JV, Gulliksrud K, Ellingsen C, Rofstad EK. Dynamic contrast-enhanced magnetic resonance imaging of tumors: Preclinical validation of parametric images. Radiat Res 2009;172:339–47.
- Egeland TAM, Gaustad JV, Benjaminsen IC, Hedalen K, Mathiesen B, Rofstad EK. Assessment of fraction of hypoxic cells in human tumor xenografts with necrotic regions by dynamic contrast-enhanced MRI. Radiat Res 2008;169:689–99.
- Tofts PS, Brix G, Buckley DL, Evelhoch JL, Henderson E, Knopp MV, . Estimating kinetic parameters from dynamic contrast-enhanced T1-weighted MRI of a diffusable tracer: Standardized quantities and symbols. J Magn Reson Imaging 1999;10:223–32.
- Hittmair K, Gomiscek G, Langenberger K, Recht M, Imhof H, Kramer J. Method for the quantitative assessment of contrast agent uptake in dynamic contrast-enhanced MRI. Magn Reson Med 1994;31:567–71.
- Mayr NA, Yuh WT, Arnholt JC, Ehrhardt JC, Sorosky JI, Magnotta VA, . Pixel analysis of MR perfusion imaging in predicting radiation therapy outcome in cervical cancer. J Magn Reson Imaging 2000;12:1027–33.
- Loncaster JA, Carrington BM, Sykes JR, Jones AP, Todd SM, Cooper R, . Prediction of radiotherapy outcome using dynamic contrast-enhanced MRI of carcinoma of the cervix. Int J Radiat Oncol Biol Phys 2002;54:759–67.
- Morgan B, Utting JF, Higginson A, Thomas AL, Steward WP, Horsfield MA. A simple, reproducible method for monitoring the treatment of tumours using dynamic contrast-enhanced MR imaging. Br J Cancer 2006;94:1420–7.
- Nielsen T, Murata R, Maxwell RJ, Stødkilde-Jørgensen H, Østergaard L, Horsman MR. Preclinical studies to predict efficacy of vascular changes induced by combretastatin A-4 disodium phosphate in patients. Int J Radiat Oncol Biol Phys 2008;70:859–66.
- Viertl D, Delaloye AB, Lanz B, Poitry-Yamate C, Gruetter R, Mlynarik V, . Increase of [18F]FLT tumor uptake in vivo mediated by FdUrd: Toward improving cell proliferation positron emission tomography. Mol Imaging Biol 2010, June 16 [Epub ahead of print]. DOI: 10.1007/s11307-010-0368-z.
- Mima K, Hirota M, Abe S, Iwatsuki M, Imamura H, Tsuruzoe S, . Small solid pseudopapillary tumor of the pancreas in a 32-year-old man: Report of a case. Surg Today 2010;40:772–6.
- DeJordy JO, Bendel P, Horowitz A, Salomon Y, Degani H. Correlation of MR imaging and histologic findings in mouse melanoma. J Magn Reson Imaging 1992;2:695–700.
- Lyng H, Haraldseth O, Rofstad EK. Measurement of cell density and necrotic fraction in human melanoma xenografts by diffusion weighted magnetic resonance imaging. Magn Reson Med 2000;43:828–36.