Abstract
Background. Lung cancer patients referred to radiotherapy (RT) often present with regional lung function deficits, and it is therefore of interest to image their lung function prior to treatment. In this study a method was developed that uses a deformable image registration (DIR) between the peak-inhale and peak-exhale phases of a thoracic four-dimensional computed tomography (4D-CT) scan to extract ventilation information. The method calculates the displacement vector fields (DVFs) resulting from the DIR using the Jacobian map approach in order to extract information regarding regional lung volume change. Material and methods. The DVFs resulting from DIRs were analysed to compute the Jacobian determinant of vectors in the field, thus obtaining a map of the vector gradients of the entire registered CT image, i.e. voxel-wise local volume change. Geometric and quantitative validation was achieved using images of both phantoms and patients. In the phantom studies, translations and deformations of known size and direction were introduced to validate both the DIR algorithm and the method as a whole. Furthermore, five patients underwent 4D-CT for planning of stereotactic body RT (SBRT). The patients were immobilised in a stereotactic body frame (SBF) and for each patient, two thoracic 4D-CT scans were acquired, one scan with respiration restricted by an abdominal compression plate and the other under free breathing. Results. In the phantom studies deformation errors were found to be of the order of the expected precision of 3 mm, corresponding to the image slice distance, in lateral and vertical directions. For the longitudinal direction a more pronounced discrepancy was observed, with the algorithm predicting displacement lengths of less than half of the physically introduced deformation. Qualitatively the method performed as expected. In the patient study an inverse consistency test showed deviations of up to 5.8 mm, i.e. almost twice the image slice separation. Jacobian maps of the patient images indicated well-ventilated areas as anatomically expected. Conclusion. The established method provides a means of using a (commercially available) DIR algorithm to obtain a quantitative measure of local lung volume change. With further phantom and patient validation studies, quantitative maps of specific ventilation should be possible to produce and use in a clinical setting.
Lung cancer patients referred to radiotherapy (RT) often present with reduced lung function due to regional lung function deficits, such as reduced ventilation and diffusion capabilities [Citation1–3]. Earlier studies have shown that incorporating functional lung imaging into inverse RT planning might be useful in reducing normal lung morbidity [Citation4–11], hence allowing iso-toxic RT dose escalation to assumed curative levels [Citation12–15]. The spatial pattern of lung function can be measured using, for example ventilation/ perfusion (V/Q) single photon emission computed tomography (CT) combined with x-ray CT (SPECT-CT) [Citation16]. The accessibility of SPECT-CT, however, is often limited and its spatial resolution is poor due to blurring during long acquisition times and low directionality of the signal [Citation9,Citation17]. Sufficiently detailed and easily accessible lung functional maps would be a valuable asset to guide RT planning for all tumour sites involving irradiation of normal lung tissue. Taking into account the functional heterogeneity of the lungs could potentially allow reducing damage to normal tissue, possibly even more so for volumetric-modulated arc therapy (VMAT) [Citation7–10,Citation18,Citation19].
Methods to obtain lung functional maps from two thoracic CT image sets acquired in phases far apart in the breathing cycle, such as the peak-inhale (PI) and peak-exhale (PE) phases of a four-dimensional CT (4D-CT) scan, have been proposed by several groups [Citation9,Citation20–23]. A quantification of the regional lung volume change between the source (image to be deformed) and target image (image acting as target for the deformation) can be calculated using the so-called Jacobian map, i.e. the determinant of the Jacobian matrix of the displacement vector field (DVF) resulting from a deformable image registration (DIR) between the two CT scans [Citation21–24]. The determinant is denoted by Det(J) which is unitless. In the Jacobian map corresponding to a DIR, a value of Det(J) above one indicates expansion, whereas numbers below one indicate contraction [Citation23]. As 4D-CT scans are becoming a standard component of RT planning protocols for lung cancer, use of these scans to also obtain lung functional information is an appealing possibility. Besides, the introduction of on-line cone-beam CT scanning including the related 4D approaches opens further possibilities for on-line/frequent lung function imaging.
The technique of using 4D-CT images and a DIR algorithm to produce ventilation maps for use in intensity modulated radiotherapy (IMRT) or VMAT lung planning protocols has already been proposed by other groups [Citation9,Citation19]. The fundamental component of this method is the specific deformation algorithm used in the process [Citation25]. Before introducing this technique into a clinical protocol setting it is therefore imperative to first validate the algorithm with respect to qualitative and quantitative predictions of tissue deformations and displacements. The aim of this study was therefore to validate an available DIR algorithm with regard to its applicability in identifying regional volume changes in lungs both qualitatively and quantitatively, and to establish and validate a method for automatic quantitative assessment of local lung tissue expansion in clinical patients using the DVFs produced by the DIR algorithm, based on the Jacobian maps of the DVFs. This was realised in part by phantom studies introducing simple translations and deformations of known size and direction, and in part by a study of five patients with non-small cell lung cancer (NSCLC) eligible for stereotactic body RT (SBRT), undergoing two thoracic 4D-CT scans with and without restricted breathing. The DVFs of DIRs obtained from phantom image sets were used for validation of the method, which in turn was evaluated using the patient data.
Material and methods
Deformable image registration and analysis
Deformable image registrations were performed using an algorithm available in the SmartAdapt application integrated with our Eclipse treatment planning system (TPS) (Eclipse v. 10.0; Varian Medical Systems, Palo Alto, CA, USA). This DIR algorithm is a demons [Citation26,Citation27] type algorithm, which uses intensity information or radiodensity (in Hounsfield Units (HU)) to simulate local intensity differences between the two images as diffusion processes by iterative optimisation of displacements due to these local forces or ‘demons’, morphing a voxel in the source image to its spatial alignment in the target image. The specific demons algorithm in our TPS was improved in efficiency and accuracy by adding a symmetric external interaction force function and by varying the resolution of the images during optimisation [Citation28,Citation29]. The algorithm required an initial rigid registration to reduce the impact of large deformations between the two images [Citation28]. This was performed manually or based on DICOM origin for phantom studies and automatically based on the DICOM origin for patients. The SmartAdapt algorithm was in this study applied for patient and lung phantom image sets with a “Thorax” anatomical preset provided by the vendor. No segmentation procedures or volume of interest (VOI) outlining were required.
Image sets from a deformed object (a phantom) and patients were used for validation of the DIR algorithm with respect to suitability for DIR in lung, as well as in the further development of the method, as detailed in the following sections.
Analysis of the DVFs produced by the algorithm was carried out either by visual inspection of the DVFs in Eclipse SmartAdapt v.10.0 or from data processed through a MATLAB (MathWorks, Natick, MA, USA) routine written to interpret and perform operations on the DICOM format DVFs resulting from a DIR in the TPS. From the three-dimensional (3D) DVF tensors we calculated the Jacobian determinant of the displacement field, using the MATLAB programming environment with the Computational Environment for Radiotherapy Research (CERR) [Citation30].
Validation of the MATLAB routine and the method as a whole was performed by visually inspecting data in the DVF files using various plots: DVF vectors were represented using two-dimensional (2D) arrow plots; the length of these vectors were displayed using CT images in select imaging planes overlaid with 2D colour coded contour maps in all three coronal imaging planes created by processing DVF data through the MATLAB routine. Relative quantitative and qualitative assessment of lung ventilation was performed by analysing the Jacobian maps with respect to a threshold value in figures representing the Jacobian map as 2D colour gradient plots overlaying CT images in the corresponding imaging plane. These observations also served to validate the method as a whole.
Phantom study for DIR algorithm validation
A 3D-CT scan (Philips Healthcare Brilliance Big Bore, Best, The Netherlands) with a slice thickness of 3 mm, image size 512 × 512 pixels and 800 mAs per slice was acquired of a static lung phantom (IMRT Thorax Phantom, CIRS Tissue Simulation & Phantom Technology, Norfolk, VA, USA) consisting of water equivalent material with two blocks of lung tissue equivalent material and a block of bone equivalent material embedded to simulate thorax with lungs and spine, free of inhomogeneities. As a first validation test of the DIR algorithm, this scan was registered to an identical copy and a DIR between these two scans was inspected qualitatively by looking at vector length plots in all CT slices. If the DIR algorithm performs correctly, it should result in zero-length displacement vectors in all pixels.
To further test the basic ability of the DIR algorithm to correctly predict a known deformation, one-dimensional translations of known sizes and directions were introduced offline in the manual rigid registrations between the two copies of the lung phantom scan, evaluating the resulting DVFs with respect to size and direction of the displacements predicted by the DIR algorithm.
In the third phantom test a 3D-CT scan (Philips Healthcare Brilliance Big Bore) of slice thickness 3 mm, image size 512 × 512 pixels and 200 mAs per slice was obtained of a phantom consisting of slabs of water equivalent plastic material (Solid Water Gammex 457, Gammex, Middleton, WI, USA), each with an extent of 20 cm × 20 cm. The slabs were stacked to a total height of 20 cm and positioned on the CT couch to represent a block of water equivalent material of dimensions (dlat,dlong,dvert) = (20,20,20) cm. To simulate a large deformation of known size and direction a similar slab of water equivalent material of dimensions 20 cm × 20 cm × 2 cm was added to the stack first in the lateral direction, yielding a phantom block of (22,20,20) cm of water equivalent material, then in the longitudinal direction creating a block of dimensions (20,22,20) cm, and finally in the vertical direction creating a block of dimensions (20,20,22) cm, obtaining similar 3D-CT scans of all situations. DIRs between the laterally, longitudinally and vertically extended phantom blocks and the basic block of (20,20,20) cm were computed and analysed with respect to length and direction of the resulting displacement vectors both in the TPS and through the MATLAB program.
To test the MATLAB implementation's interpretation of image metrics, i.e. axis orientations, displacement vector lengths and directions in all image planes, plots representing the displacement vector lengths and the displacement vector sizes and directions were produced for both expanding-direction DIRs and contracting-direction DIRs (using the convention of ImageA→ImageB indicating the deformation of ImageA, the source image, to ImageB, the target image) and analysed by visual inspection.
4D-CT imaging and patient study for DIR algorithm validation
Five patients diagnosed with NSCLC with tumours no larger than 5 cm in diameter and without mediastinal involvement, thus all being eligible for SBRT, were immobilised in a stereotactic body frame (SBF) (Elekta Stereotactic Body Frame®, Stockholm, Sweden). Each patient underwent two thoracic 4D-CT scans (Philips Healthcare Brilliance Big Bore) where the Varian Real-time Position Management (RPM) system (Varian Medical Systems) was used for acquisition of an external respiratory signal, and prior to scanning patients were instructed in shallow breathing, both orally and in print. Pitch values in the CT scan were typically between 0.065–0.105 with a rotation time of 0.5 s. Slice thickness was 3 mm, image size 512 × 512 pixels and we used 800 mAs per slice for normal size patients and 1000 mAs for obese patients. During the first scan an abdominal compression plate was applied to restrict the patients’ breathing motion, whereas they were permitted to breathe freely during the second scan, changing nothing else in the imaging parameters than removing the compression plate. The 4D-CT image sets were automatically sorted into ten respiratory phases and analysed offline using Eclipse External Beam Planning v.8.6.0 with 4D-capabilities (Varian Medical Systems).
By visual inspection of the 4D-CT image sets in static and cine-mode the phases corresponding to PI and PE were determined based on diaphragm position, taking into account also severe artefacts in the PI and PE phases. The selected PE phase of a scan was deformably registered to the PI phase (i.e. PE acted as source image and PI as target image, denoted PE→PI), producing a DVF corresponding to maximum volume change during expansion of the lungs.
To test the inverse consistency of the DIR algorithm a deformable registration of PI→PE was produced and compared quantitatively to that of PE→PI by comparing displacement vector lengths of one deformation pixel-wise to those of the other. Maximum difference in displacement vector lengths was found using the MATLAB program. Differences were also qualitatively assessed via a colour coded contour plot of a difference map between the displacement vector lengths and a colour-gradient plot of a difference map between the Jacobian maps for selected image planes. This was performed for all patients and all 4D-CT scans with and without abdominal compression.
As a further validation of the robustness of the specific DIR algorithm with respect to small and large volume changes the DVFs of registrations of 4D-phases 10→0, 20→10, 30→20, 40→30 and 50→40 (numbers referring to percent completed of the breathing cycle) in a scan were compared qualitatively, using arrow plots, to a registration of phase 50→0 (PE→PI), corresponding to stepwise expansion and maximum expansion, respectively. The same was done for the contracting part of the breathing cycle, comparing stepwise contraction to the PI→PE registration.
Finally the Jacobian maps of scans for all patients both with and without abdominal compression were compared in selected imaging planes to investigate the relative difference in the location and magnitude of lung ventilation. PE→PI DIRs were used to produce ventilation maps showing maximum local lung volume change. Ventilation maps produced in the frontal imaging plane were analysed using a threshold value of Det(J) >1 to locate the most widely expanding regions within the lungs.
Results
Phantom validation
In the first phantom test, registering two identical lung phantom scans with no translations introduced, the algorithm correctly predicted no displacement in all pixels inside the phantom. Outside the phantom, however, the algorithm introduced some registration artefacts in air, predicting displacements of up to 1.7 mm, the largest of which were seen in the longitudinal direction. These artefacts, displayed and measured using the tools available in the TPS and verified using the MATLAB program, were only observed in a small area at and near one extreme end of the CT scan. Explicit values are tabulated in .
Table I. Maximum and minimum displacements in the lung phantom study: For no translation between scan copies and for offline introduced translations of 1 cm in lateral, longitudinal and vertical directions, respectively. Displacement distances in phantom and in air are estimated using the tools available in the TPS and global maximum displacement values are extracted directly from the data using MATLAB. In air all minimum displacements were 0 mm and hence are not tabulated.
In the second phantom test, deliberately erroneous rigid registrations between the lung phantom scans introduced 1 cm translations in the lateral, longitudinal or vertical directions. For these situations the algorithm predicted off-translational axis displacements of the order of 0–1.9 mm inside the phantom and 0–2.5 mm in air. In the direction of translation the algorithm was most accurate in its prediction of the lateral and vertical translations (i.e. in the CT imaging plane), indicating displacements of 6.0–10.6 mm and 7.6–10.1 mm, respectively, inside the phantom, and 0–4.5 mm and 0–4.6 mm, respectively, in air. In contrast, the DIR for the longitudinally translated image (i.e. in the CT imaging direction) predicted a displacement of only 3.6–7.7 mm in the longitudinal direction and displacements of up to 0.7 mm in the off-translational directions within the phantom, and 0–4.6 mm in the longitudinal direction and up to 1.9 mm in the off-translational directions in air. The maximum and minimum values of displacements in all directions for all translations regarding the lung phantom DIRs as estimated using the tools available in the TPS are tabulated in . Also tabulated are the absolute global maximal displacement values as extracted using MATLAB. In general the quantitative predictions of displacement along the translation direction were largest and – for the lateral and vertical translation directions – most accurate close to material boundaries, whereas they would differ the most from the introduced 1 cm translations far from these edges within the phantom or in air.
Results from the water equivalent phantom tests are tabulated in for DIRs computed with the base phantom CT image acting as source and the enlarged block acting as target image (base→enlarged), corresponding to an expansion, and inversely (enlarged→base), corresponding to a contraction. In the laterally and vertically enlarged phantom DIRs the translational direction displacements amounted approximately to the expected 20 mm inside the phantom whereas the longitudinally enlarged phantom DIR showed displacements in the translational direction of up to only 6.4 mm for the expanding-direction DIR and 9.5 mm for the contracting-direction DIR.
Table II. Maximum displacements in the water equivalent phantom study: The base phantom CT image acting as source (base→enlarged) corresponds to an expansion, whereas the base phantom image acting as target (enlarged→base) corresponds to a contraction. Displacement distances in phantom and in air are estimated using the tools available in the TPS and global maximum displacement values are extracted directly from the data using MATLAB. Minimum displacements were 0 mm in all cases and hence are not tabulated.
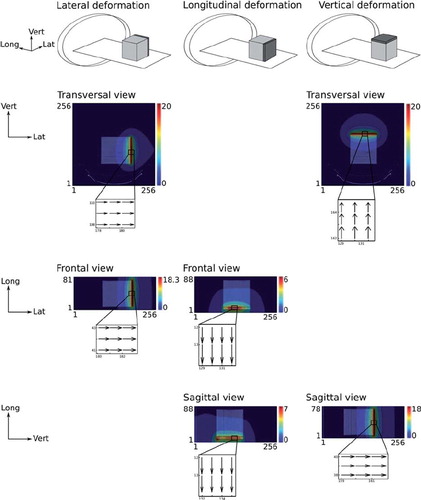
Processing the DIR data from the water equivalent phantoms through the MATLAB program we were able to verify the MATLAB interpretation of image metrics by visual inspection of figures representing vectors (2D arrow-plot) or vector lengths (2D contour-plot) in all three coronal imaging planes and for DIRs corresponding to both expansion and contraction of material as defined above. This process is illustrated in .
Figure 1. Illustration of the process of validating the MATLAB program's interpretation of image metrics, comparing DIRs between CT scans of phantom blocks of water equivalent material extending a base block of 20 cm × 20 cm × 20 cm in lateral, longitudinal and vertical directions by 2 cm. Here the deformation vector lengths are displayed in colour contour-plots overlying the corresponding CT images in transversal, frontal and sagittal image planes as required to verify axis orientation. In figures showing the transversal imaging plane the horizontal axis shows lateral pixel value and the vertical axis shows vertical pixel value (note that the TPS rescales the 512 × 512 pixels CT images to 256 × 256 pixels when performing the DIR). In figures showing the frontal or sagittal imaging planes the horizontal axis shows lateral and vertical pixel values respectively, whereas the vertical axis shows CT slice number, corresponding to the longitudinal direction. Displacement vector directions are shown as an insert under all figures, verifying correct MATLAB representation of DVFs (shown here for expansion, i.e. base→enlarged phantom image).
Patient studies
In four of five patients PI and PE were found at 0% and 50% time elapsed of the respiration cycle (naming these phases phase0 and phase50, or PI and PE) respectively, when observing diaphragm motion. For the last patient the diaphragm assumed its most cranial position in phase60. However as this particular phase60 had more artefacts than the corresponding phase50 which showed a diaphragm position of almost maximal cranial position, the latter was chosen as PE. In all patients thus phase0 and phase50 were selected as PI and PE, respectively, and these phases were used to produce maximum volume change DVFs.
The consistency test of the DIR algorithm, comparing registrations PE→PI with registrations PI→PE was performed for both scans of all patients. An example of a difference map between vector lengths and Jacobian maps of two such registrations is shown in and maximum deviations are tabulated in . In general, some differences were found between the PE→PI and PI→PE DIRs of the order of 3.4–5.8 mm.
Figure 2. Comparison of PE→PI vs. PI→PE registrations in the 4D-CT image for Patient 1 with abdominal compression in the same CT slice. First row shows the vector size colour coded contour map for the DVF of the PE-PI registration (expanding direction), the PI-PE registration (contracting direction) and a difference maps showing the discrepancies between predicted lengths, all in millimetres. Second row shows the corresponding Jacobian maps and a difference map between these, calculated as the absolute value of Jacobians of the expanding direction DVF minus one, minus the absolute value of Jacobians of the contracting direction DVF minus one. (Note that the TPS rescales the 512 × 512 pixels CT images to 256 × 256 pixels when performing the DIR.)
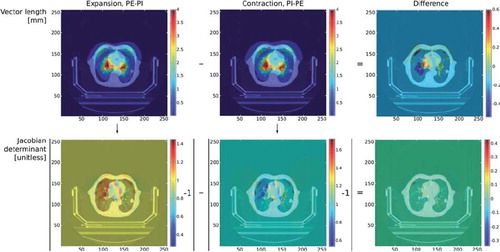
Table III. Maximum difference in vector lengths in the patient scans: PE→PI DIR vector lengths are compared to PI→PE DIR vector lengths using MATLAB. With/without refers to the patient scan with or without use of abdominal compression.
The stepwise expansion and contraction test was performed for one scan for each patient, using two CT image sets with abdominal compression and three images without. An example of the displacement vector arrow-plots used for visual inspection of this issue is shown in . We found the DIR algorithm to predict maximum and stepwise volume change consistently in all cases.
Figure 3. Vectors in the DVFs resulting from DIRs between PI and PE phases and the stepwise expansion and contraction corresponding to the PE→PI registration and the PI→PE registration respectively in a thoracic 4D-CT scan of a patient in SBF fixation without abdominal compression. Numbers indicate the phase of the breathing cycle as percent completed. The first number indicates the source image and the second number indicates the target image. The selected section of the DVF corresponds to a zoomed-in area around the particular patient's tumour in the transversal plane at a fixed longitudinal position. Horizontal axis shows lateral pixel value, vertical axis shows vertical pixel value. Note that the 512 × 512 pixels CT images are scaled to 256 × 256 pixels by the TPS when performing the DIR. The vector sizes and directions of the smaller-step deformations verify that stepwise expansion corresponds to the predicted total expansion of the PE→PI registration and similarly for the contraction of the PI→PE registration.
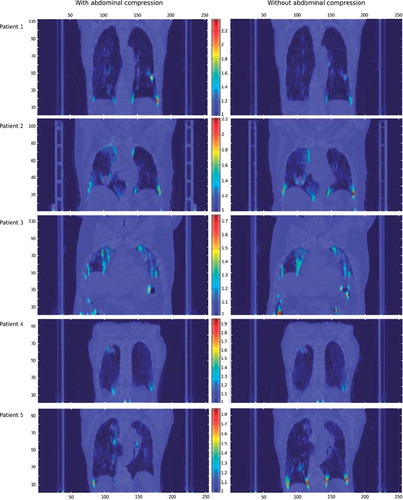
Ventilation maps were produced for all patients for the images both with and without abdominal compression, in select frontal imaging planes. Ventilation maps are shown in . The range of Det(J) is similar for all patients, showing values corresponding to expansion of between 0 and 2.35. For all patients the DIR algorithm reproduced the approximate areas of high ventilation in scans with abdominal compression in scans without abdominal compression, further validating the algorithm and the method as a whole. Patient 2 and Patient 5 had volumes of the lung where a better ventilation was seen when allowing the patient to breathe freely as compared to when restricting abdominal breathing motion. For Patient 1 and Patient 4 we observed the opposite, with the areas of high ventilation being most pronounced when breathing was restricted. In Patient 3 hardly any difference could be seen, neither in this imaging plane nor in other frontal planes.
Figure 4. Ventilation maps for all patients both with and without abdominal compression in a frontal imaging plane showing the patients’ tumours. Horizontal axis shows lateral pixel value (the TPS converts the 512 × 512 pixels CT images to 256 × 256 pixels when performing a DIR), vertical axis shows CT slice number. Note that the colour scales, showing the value of the Jacobian determinant (Det(J), unitless), are synchronised for each patient, while it changes the upper limit between patients. The lower limit is set at Det(J) = 1 corresponding to no local volume change. The brightest areas of the ventilation maps thus have the highest ventilation.
Discussion
In this study, a method for using 4D-CT images and a Jacobian map to obtain a measure of ventilation in patients has been investigated. The method provides a means of essential validation of a commercially available DIR algorithm for this purpose, using phantom and patient images, and applying tools already available at many RT institutions.
Demons-type algorithms such as the one used by our TPS, are not necessarily the fastest and most robust algorithms in use for deformable registration in all clinical cases, but they are, however, widely available and serves as a standard for comparison due to their simplicity [Citation31]. This class of algorithm is generally thought to work well in lung [Citation25,Citation32]. Overall the algorithm seemed to perform fairly well, but it has some trouble keeping deformation errors low in areas of air and far from material boundaries in the CT images. For the water equivalent phantom registration discrepancies were particularly large along the CT imaging direction, but displacement errors are also observed in the CT imaging plane directions. This is as expected although the maximum deviations are larger than the CT imaging slice separation of 3 mm [Citation9,Citation25]. Improvement in the accuracy of the DIR can be achieved at the cost of additional preparation by segmenting the lung regions prior to registration. This also bears the disadvantage of introducing displacement errors at the interfaces between lungs and other tissue [Citation32].
The water equivalent phantom study enabled a straight-forward validation of the MATLAB routine's geometric implementation of the DVFs. It also revealed a possible serious discrepancy between actual and predicted deformation when introducing a deformation in the CT imaging direction. Here the predicted deformation showed displacements of no more than half of the true displacement. The error was somewhat mirrored in the virtual displacement deformation of the lung phantom, although here the predicted deformation showed displacements about two thirds of that expected. This error, however, may also likely pertain to the fact that the DIRs are produced between phantoms consisting of different volumes of equal-density material, thereby invalidating the assumption behind the diffusion-driven demons algorithm that mass is preserved [Citation26]. The other quantitative errors observed may well originate from the phantom blocks consisting of homogeneous material, giving the algorithm no landmarks to confirm its predictions. Then, if the slight air gap between the base water equivalent phantom block and the longitudinally extended phantom block happens to fall between two imaging slices, this direction of expansion of the base phantom differs significantly from the laterally and longitudinally extended phantoms and this would explain why larger errors were seen for the longitudinal deformation. The size of the introduced deformation may also be an issue, as 800 cm3 additional material must be considered a very large deformation. It is well-known that the demons algorithm needs landmarks or other inhomogeneities in order to correctly perform large deformations [Citation24]. A phantom displaying true deformation, preferably similar to the sliding deformation observed in lungs [Citation32,Citation33], is required to validate the DIR algorithm quantitatively in an experimental setup approach [Citation34], and a thorough quantitative validation is required prior to implementing the method in clinical practice. Other groups have suggested using computational modelling of anatomic deformation for quantitative validation of DIR algorithms [Citation35], validation methods based on landmark point determination [Citation36], or post-registration similarity measure evaluation with subsequent synthetic transformations and contour-based metrics [Citation37]. Using the patient data, the algorithm qualitatively passes simple tests of robustness and reproducibility, and performs fairly well, though not perfectly on the consistency test. Also in favour of this method is the relatively straight-forward conversion of DVF data into ventilation maps, which in turn are easily manipulated to show several aspects of regional lung volume change due to the matrix nature of the MATLAB programming environment. To justify the use of the method to produce overview qualitative ventilation maps and quantitative specific ventilation maps from 4D-CT images, however, it is necessary to perform further tests as suggested above.
Further analysis of the patient data may also contribute to a clinical validation: The stepwise expansion and contraction test can be improved by implementing tracking of the individual voxels between the stepwise registration DVFs. The distance between final voxel position in the stepwise process compared to the direct deformation would then, of course, ideally be zero. If there is a difference in final voxel position this strategy provides a quantitative measure of the DIR algorithm robustness. The method, however, does not yet support such a quantitative validation as further work is required to implement voxel tracking.
As 4D-CT surpasses the geometric accuracy of SPECT-CT it is desirable to use these images to obtain ventilation maps. In choosing 4D-CT over SPECT-CT one should, however, bear in mind that although resolution is improved for the ventilation map, there does not at the moment exist a method for using CT images alone to obtain lung perfusion data. To achieve a complete representation of the patient's lung functional status, perfusion, being a surrogate of ventilation, should also be imaged. Even so, the ventilation maps presumably show the most well-functioning areas of lung tissue [Citation9]. Assuming that the ventilation and perfusion deficits that many lung cancer patients present with are a permanent state of the patient's lung, i.e. that the extent and distribution of the defective and the well-functioning lung regions will not change due to irradiation of lung tissue, dose limitations similar to healthy lung tissue (typically using dose constraints relating to e.g. V20, the total volume of lung receiving more than 20 Gy) need not be applied to the damaged lung tissue. The ventilation information may then be used to guide lung RT treatment planning to spare only functional lung [Citation4,Citation5,Citation9], and leading to new planning constraints possibly enabling dose escalation attempts. Validation studies of the 4D-CT and Jacobian map method have showed good correlation between the ventilation image estimates of tidal volume and tidal volumes measured directly from the CT images [Citation21,Citation22], as well as with xenon-enhanced CT measures of specific ventilation [Citation23] and SPECT lung functional imaging [Citation19]. With further validation of the DIR algorithm and further tests on clinical 4D-CT images, preferably alongside co-registration with V/Q SPECT-CT images or gated SPECT-CT images in order to obtain an absolute quantitative validation of the Jacobian map representations, the method should be usable to quickly obtain an overview of a patient's ventilation status and the distribution of highly ventilated areas within the lung.
Acknowledgements
This work has been supported by research grants from CIRRO-The Lundbeck Foundation Center for Interventional Research in Radiation Oncology, the Danish Cancer Society, FSS (The Danish Council for Independent Research) as well as the Danish Council for Strategic Research. Varian Medical Systems (Palo Alto, CA, USA) are acknowledged for providing the DIR application pre-release. Tine B. Nyeng would like to thank Bent Bisballe Nyeng for his help in further developing the MATLAB routine. She would also like to thank Ditte Sloth Møller for providing the CT scan of the lung phantom.
Declaration of interest: The authors report no conflicts of interest. The authors alone are responsible for the content and writing of the paper.
References
- Paludan M, Hansen AT, Petersen J, Grau C, Høyer M. Aggravation of dyspnea in stage I non-small cell lung cancer patients following stereotactic body radiotherapy: Is there a dose-volume dependency? Acta Oncol 2006;45:818–22.
- Baumann P, Nyman J, Hoyer M, Gagliardi G, Lax I, Wennberg B. Stereotactic body radiotherapy for medically inoperable patients with stage I non-small cell lung cancer – a first report of toxicity related to COPD/CVD in a prospective phase II study. Radiother Oncol 2008;88:359–67.
- Kopek N, Paludan M, Petersen J, Hansen AT, Grau C, Høyer M. Co-morbidity index predicts for mortality after stereotactic body radiotherapy for medically inoperable early-stage non-small cell lung cancer. Radiother Oncol 2009;93: 402–7.
- Marks LB, Spencer SP, Sherouse GW, Bentel G, Clough R, Vann K, . The role of three dimensional functional lung imaging in radiation treatment planning: The functional dose-volume histogram. Int J Radiat Oncol Biol Phys 1995;33:65–75.
- Seppenwoolde Y, Engelsman M, De Jaeger K, Muller SH, Baas P, McShan DL, . Optimizing radiation treatment plans for lung cancer using lung perfusion information. Radiother Oncol 2002;63:165–77.
- Christian JA, Partridge M, Nioutsikou E, Cook G, McNair H A, Cronin B, . The incorporation of SPECT functional lung imaging into inverse radiotherapy planning for non-small cell lung cancer. Radiother Oncol 2005;77:271–7.
- Lavrenkov K, Christian JA, Partridge M, Nioutsikou E, Cook G, Parker M, . A potential to reduce pulmonary toxicity: The use of perfusion SPECT with IMRT for functional lung avoidance in radiotherapy of non-small cell lung cancer. Radiother Oncol 2007;83:156–62.
- Lavrenkov K, Singh S, Christian JA, Partridge M, Nioutsikou E, Cook G, . Effective avoidance of a functional spect-perfused lung using intensity modulated radiotherapy (IMRT) for non-small cell lung cancer (NSCLC): An update of a planning study. Radiother Oncol 2009;91:349–52.
- Yaremko BP, Guerrero TM, Noyola-Martinez J, Guerra R, Lege DG, Nguyen LT, . Reduction of normal lung irradiation in locally advanced non-small-cell lung cancer patients, using ventilation images for functional avoidance. Int J Radiat Oncol Biol Phys 2007;68:562–71.
- Shioyama Y, Jang SY, Liu HH, Guerrero T, Wang X, Gayed IW, . Preserving functional lung using perfusion imaging and intensity-modulated radiation therapy for advanced-stage non-small cell lung cancer. Int J Radiat Oncol Biol Phys 2007;68:1349–58.
- Bates EL, Bragg CM, Wild JM, Hatton MQ, Ireland RH. Functional image-based radiotherapy planning for non-small cell lung cancer: A simulation study. Radiother Oncol 2009;93:32–6.
- Ricardi U, Filippi R, Guarneri A, Giglioli FR, Mantovani C, Fiandra C. Dosimetric predictors of radiation-induced lung injury in stereotactic body radiation therapy. Acta Oncol 2009;48:571–7.
- Partridge M, Tree A, Brock J, McNair H, Fernandez E, Panakis N, . Improvement in tumour control probability with active breathing control and dose escalation: A modelling study. Radiother Oncol 2009;91:325–9.
- Yee D, Hanson J, Butts C, Reiman A, Joy A, Smylie M, . Phase I dose escalation trial of hypofractionated limited-field external beam thoracic radiotherapy for limited-stage small cell carcinoma of the lung. Radiother Oncol 2010;96:78–83.
- Guckenberger M, Baier K, Polat B, Richter A, Krieger T, Wilbert J, . Dose-response relationship for radiation-induced pneumonitis after pulmonary stereotactic body radiotherapy. Radiother Oncol 2010;97:65–70.
- King GG, Harris B, Mahadev S. V/Q SPECT: Utility for investigation of pulmonary physiology. Semin Nucl Med 2010;40:467–73.
- Petersson J, Sánchez-Crespo A, Larsson SA, Mure M. Physiological imaging of the lung: Single-photon-emission computed tomography (SPECT). J Appl Physiol 2007;102: 468–76.
- Partridge M, Yamamoto T, Grau C, Høyer M, Muren LP. Imaging of normal lung, liver and parotid gland function for radiotherapy. Acta Oncol 2010;49:997–1011.
- Yamamoto T, Kabus S, von Berg J, Lorenz C, Keall PJ. Impact of four-dimensional computed tomography pulmonary ventilation imaging-based functional avoidance for lung cancer radiotherapy. Int J Radiat Oncol Biol Phys 2011;79:279–88.
- Simon BA. Non-invasive imaging of regional lung function using x-ray computed tomography. J Clin Monit Comput 2000;16:433–42.
- Guerrero T, Sanders K, Noyola-Martinez J, Castillo E, Zhang Y, Tapia R, . Quantification of regional ventilation from treatment planning CT. Int J Radiat Oncol Biol Phys 2005;62:630–4.
- Guerrero TM, Sanders K, Castillo E, Zhang Y, Bidaut L, Pan T, . Dynamic ventilation imaging from four-dimensional computed tomography. Phys Med Biol 2006;51:777–91.
- Reinhardt JM, Ding K, Cao K, Christensen GE, Hoffman EA, Bodas SV. Registration-based estimates of local lung tissue expansion compared to xenon CT measures of specific ventilation. Med Image Anal 2008;12:752–63.
- Leow AD, Yanovsky I, Chiang M-C, Lee AD, Klunder AD, Lu A, . Statistical properties of Jacobian maps and the realization of unbiased large-deformation nonlinear image registration. IEEE Transactions Med Imaging 2007;26: 822–32.
- Brock KK, Deformable Registration Accuracy Consortium. Results of a multi-institution deformable registration accuracy study (MIDRAS). Int J Radiat Oncol Biol Phys 2010;76:583–96.
- Thirion J-P. Image matching as a diffusion process: An analogy with Maxwell's demons. Med Image Anal 1998;2: 243–60.
- Thörnqvist S, Petersen JBB, Høyer M, Bentzen LN, Muren LP. Propagation of target and organ at risk contours in radiotherapy of prostate cancer using deformable image registration. Acta Oncol 2010;49:1023–32.
- Wang H, Dong L, O'Daniel J, Mohan R, Garden A, Ang KK, . Validation of an accelerated ‘demons’ algorithm for deformable image registration in radiation therapy. Phys Med Biol 2005;50:2887–905.
- Helminen H, Alakuijala J, Pesola K, Laitinen J. Comparison of local external force functions for non-rigid registration of 3D medical images. Medical image computing and computer-assisted intervention - MICCAI 2003. Berlin/ Heidelberg: Springer; 2003;2879:821–8.
- Deasy JO, Blanco AI, Clark VH. CERR: A computational environment for radiotherapy research. Med Phys 2003;30: 979–85.
- Muyan-Özçelik P, Owens JD, Xia J, Samant SS. Fast deformable registration on the GPU: A CUDA implementation of demons. In: 2008 International Conference on Computational Sciences and Its Applications.
- Yim Y, Hong H, Shin YG. Deformable lung registration between exhale and inhale CT scans using active cells in a combined gradient force approach. Med Phys 2010;37: 4307–17.
- Seppenwoolde Y, Shirato H, Kitamura K, Shimizu S, van Herk M, Lebesque JV, . Precise and real-time measurement of 3D tumor motion in lung due to breathing and heartbeat, measured during radiotherapy. Int J Radiat Oncol Biol Phys 2002;53:822–34.
- Wang H, Dong L, Lii MF, Lee AL, de Crevoisier R, Mohan R, . Implementation and validation of a three-dimensional deformable registration algorithm for targeted prostate cancer radiotherapy. Int J Radiat Oncol Biol Phys 2005;61:725–35.
- Zhong H, Kim J, Chetty IJ. Analysis of deformable image registration accuracy using computational modeling. Med Phys 2010;37:970–9.
- Østergaard Noe K, De Sennenville BD, Elstrøm UV, Tanderup K, Sørensen TS. Acceleration and validation of optical flow based deformable registration for image-guided radiotherapy. Acta Oncol 2008;47:1286–93.
- Fallone BG, Rivest DR, Riauka TA, Murtha AD. Assessment of a commercially available automatic deformable registration system. J Appl Clin Med Phys 2010;11:101–23.