Abstract
Background. Molecular and functional imaging techniques such as dynamic positron emission tomography (DPET) and dynamic contrast enhanced computed tomography (DCECT) may provide improved characterization of tumors compared to conventional anatomic imaging. The purpose of the current work was to compare spatiotemporal uptake patterns in DPET and DCECT images. Materials and methods. A PET/CT protocol comprising DCECT with an iodine based contrast agent and DPET with 18F-fluorodeoxyglucose was set up. The imaging protocol was used for examination of three dogs with spontaneous tumors of the head and neck at sessions prior to and after fractionated radiotherapy. Software tools were developed for downsampling the DCECT image series to the PET image dimensions, for segmentation of tracer uptake pattern in the tumors and for spatiotemporal correlation analysis of DCECT and DPET images. Results. DCECT images evaluated one minute post injection qualitatively resembled the DPET images at most imaging sessions. Segmentation by region growing gave similar tumor extensions in DCECT and DPET images, with a median Dice similarity coefficient of 0.81. A relatively high correlation (median 0.85) was found between temporal tumor uptake patterns from DPET and DCECT. The heterogeneity in tumor uptake was not significantly different in the DPET and DCECT images. The median of the spatial correlation was 0.72. Conclusions. DCECT and DPET gave similar temporal wash-in characteristics, and the images also showed a relatively high spatial correlation. Hence, if the limited spatial resolution of DPET is considered adequate, a single DPET scan only for assessing both tumor perfusion and metabolic activity may be considered. However, further work on a larger number of cases is needed to verify the correlations observed in the present study.
Solid tumors are heterogeneous entities with respect to factors that influence resistance to therapy such as vasculature, proliferation, metabolism, and hypoxia [Citation1]. Assessment of such factors before, during and after therapy is thus important to tailor personalized treatment regimens.
Medical imaging techniques such as computed tomography (CT), magnetic resonance imaging (MRI) and positron emission tomography (PET) may provide non-invasive three dimensional (3D) images depicting anatomic, physiologic and metabolic factors [Citation2]. Biologically adaptive strategies are being considered to utilize such images in radiotherapy planning, monitoring and follow-up [Citation3–7]. Some key issues in order to improve treatment outcome are to identify radioresistant regions within solid tumors and to guide focal irradiation of these regions.
In dynamic contrast enhanced CT (DCECT) [Citation8], the spatiotemporal distribution of an intravenously administered iodinated contrast agent is studied. In the ‘vascular phase’, the contrast agent is transported to tissue via the vascular network. The contrast molecules are then passively exchanged between the intravascular space and the extravascular extracellular space by diffusion. This is often referred to as the ‘wash-in phase’. Following renal clearance, the diffusion is reversed, resulting in a ‘wash-out’ of the tracer. Tumors may typically show an increase in the number of blood vessels and in the capillary permeability [Citation8], and contrast enhancement relative to normal tissue may thus be observed.
In 18F-fluoro-deoxyglucose positron emission tomography (FDG-PET) [Citation9], FDG is administered intravenously and thereafter distributed by the vascular network and passively delivered to tissue by diffusion. FDG may then enter the cells and become trapped if glycolysis is activated [Citation10]. Hypermetabolism may thus be detected by employing a static FDG-PET scan around one hour post injection. In dynamic FDG-PET (DPET), the uptake kinetics from the time of injection is monitored. The resulting dynamic image series thus include both the wash-in (perfusion) phase and the metabolic phase. Few studies have been performed on dynamic FDG-PET in oncology, although combined PET imaging of tumor perfusion and metabolism ought to be attractive in clinical studies addressing treatment monitoring.
Abramyuk et al. [Citation11] suggest using combined DCECT and static FDG-PET for assessing tumor perfusion and metabolism, respectively. They expect that the combined imaging protocol will improve radiotherapy outcome prediction of head and neck cancers. Still, as outlined above, the wash-in kinetics depicted in DPET and DCECT should be similar, and DCECT may thus be redundant for response prediction. However, studies are needed were tumor uptake patterns of PET and CT tracers are compared. In the current work, we have examined spontaneous canine tumors with dynamic FDG-PET and DCECT. The spatiotemporal tumor uptake patterns shown by the two imaging modalities were compared using quantitative image analyses.
Material and methods
Animals and treatment
Three dogs with spontaneous head and neck tumors were included in the current study. The study was approved by the National Committee on Animal Research, and written informed consent was obtained from the dogs’ owners. Patient and tumor characteristics are given in . None of the dogs showed evidence of distant metastases at the time of diagnosis, and the treatments were given with curative intent. All imaging and treatments were performed under general anesthesia (see [Citation12,Citation13] for further details).
Table I. Patient and tumor characteristics for the three dogs in the study.
The dogs received fractionated intensity modulated radiotherapy (IMRT) with at total dose 40–46 Gy given in 10 fractions over two weeks. The treatments were performed using 6 MV photons at an Elekta Synergy linear accelerator (Elekta AB, Stockholm, Sweden). For both treatment and imaging, the dogs were positioned in prone position on a vacuum cushion (VacFix, Par Scientific A/S, Odense Denmark) in a polymethyl methacrylate (PMMA) case, with the upper jaw fixed by a dental form attached to the PMMA case (see [Citation12,Citation13]).
Imaging
PET/CT was performed at a Siemens Biograph 16 scanner (Siemens AG, Munich, Germany) with a Somatom Sensation 16 CT unit, including 16 CT detector rows. The DPET scan was performed prior to the DCECT scan to avoid potential errors in attenuation correction due to the iodinated contrast agent (see below). For DPET, an FDG activity per body weight of typically 6 MBq/kg was administered intravenously using a manual syringe. The scan duration was 45 minutes, with the sampling rate varying from 1/15–1/120 s−1. The longitudinal field of view (FOV) was 16.2 cm and the images were reconstructed with a slice resolution of 2 mm and an in-plane resolution of 5.5 mm, using 3D OSEM iterative reconstruction (four iterations, eight subsets) and a gaussian convolution kernel with FWHM = 5.0 mm. For DCECT, Omnipaque (iohexol, 300 mg/ml, GE Healthcare, Oslo, Norway) (patient A) or Visipaque (iodixanol, GE Healthcare, Oslo, Norway) (patients B and C) were administered intravenously at a dose of 600 mg l/kg or 640 mg l/kg by means of a power injector. A scan time of 10 minutes was set up, with the sampling rate varying from 1/7–1/30 s−1 (more frequent imaging at early time points). The scan length was 2.4 cm, with a slice resolution of 1.5 mm. The in-plane CT resolution was typically 0.6 mm. CT image acquisition was performed using a voltage, current and exposure time of 80 kV, 100 mA and one second, respectively. For reconstruction, a smooth filter kernel (B10f; Siemens AG, Munich, Germany) was applied. At three of six imaging sessions, we experienced problems with the DCECT acquisition, resulting in a scan time of only two minutes. Thus, it was decided to only evaluate the images obtained during the first two minutes for both modalities and all cases.
PET/CT imaging was performed three days prior to treatment (session 1), and four months (four weeks for patient A) after treatment (session 2).
Analysis
The image analysis was performed with software developed in Interactive Data Language v6.2 (IDL; ITT Visual Information Solutions, Boulder, USA). First, the PET images outside the limited scan length for CT were discarded. DICOM image and header data were used to downsample CT images to the PET image dimensions so that the DPET and DCECT image series corresponded voxel-by-voxel. The raw CT images were smoothed with a box car filter of 5 × 5 mm width (comparable to the PET resolution) prior to downsampling. In effect, the downsampled CT-images thus represent the mean attenuation within the region covered by each PET-voxel. Translational corrections due to differences in image positions in the scanner (also obtained from the DICOM header) were also performed. Furthermore, the temporal resolution in the CT image series was reduced to the temporal resolution in the PET image series by linear interpolation.
CT contrast enhancement in a given voxel was calculated as the difference between voxel values (in Hounsfield units) obtained at a given time t = ti post injection and at the time of injection t = 0. The PET voxel values were given in kBq, as obtained directly from the DICOM data.
In order to estimate the extension of the tumor uptake in the respective image series, region growing was performed in the PET images and the resampled CT contrast enhancement images obtained one minute post injection. Following a user-defined seed location, the growing procedure finds all pixels within the 3D images series which are connected neighbors and that fall within provided constraints. The constraint was a user-defined multiple of the standard deviation of the voxel values within the grown region. The growing was performed separately in the PET and CT image series, but identical seed locations and constraints were used. The growing was supervised by requiring the resulting uptake volumes not exceeding a user-defined value. The constraints used in the growing were 1.65 (dog A, session 1), 1.58 (A, 2), 1.19 (B, 1), 1.74 (B, 2), 1.27 (C, 1) and 0.33 (C, 2). The grown region was closed by performing a dilation followed by an erosion using a cross-shaped operator 3 voxels wide. The region growing in the respective image series resulted in two uptake volumes (UVs); UVPET and UVCT.
Following region growing, the intersection UV∩ of the two uptake volumes UVPET and UVCT was also defined. This volume represented the basis at which the spatial and temporal tumor uptake characteristics following DPET and DCECT were to be assessed (see below). Furthermore, tumor extensions tentatively provided by UVPET and UVCT were compared by Dice's similarity coefficient:
The mean tracer uptake in each tumor was estimated by calculating the mean activity or contrast enhancement in UV∩. The heterogeneity in intratumoral uptake was evaluated by extracting the lower and upper quartile of the activity/contrast enhancement distribution in UV∩. These calculations were performed for each time point post injection, thus resulting in time-uptake curves. The uptake curves obtained from DPET and DCECT were compared using Pearson's correlation coefficient, providing a measure of the temporal correlation:
UPET, i is the PET uptake in the tumor at time point i, n is the total number of time points, while ŪPET and SPET are the mean and standard deviation, respectively, of the tumor uptake over the time series. The same notation was used for the uptake found for DCECT.
The spatial correlation was assessed by calculating the correlation coefficient between the spatial uptake distribution in DPET and DCECT images at each time point post injection:
Here, uPET, j is the PET uptake in voxel j, m is the total number of voxels (within UV∩), while ūPET and SPET are the mean and standard deviation, respectively, of the uptake distribution over the tumor at the given time point. The same notation was used for DCECT.
Results
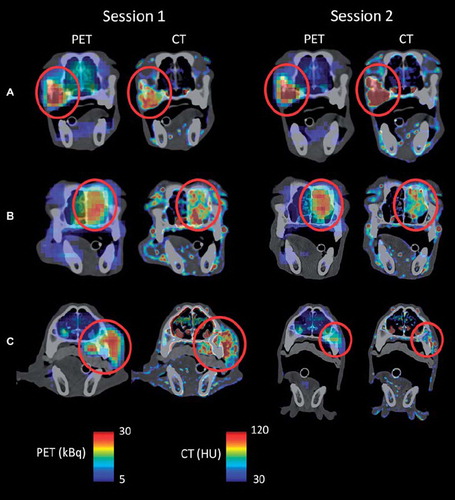
shows coronal PET activity and CT contrast enhancement images given as overlays on precontrast CT images. Results are shown for all three patients at imaging session 1 and 2. As evident, the distribution of PET activity and CT contrast enhancement is qualitatively similar for all patients at both imaging sessions, with the possible exception of patient C at session 2, where little uptake was seen in either image.
Figure 1. Precontrast coronal CT images of patient A–C with PET activity and CT contrast enhancement obtained one minute post injection given as overlay. Level/window settings (see color bars) are indicated. The red circle indicates the location of the tumor. Images were obtained at two sessions; one prior to and one after the course of fractionated radiotherapy (session 1 and 2, respectively).
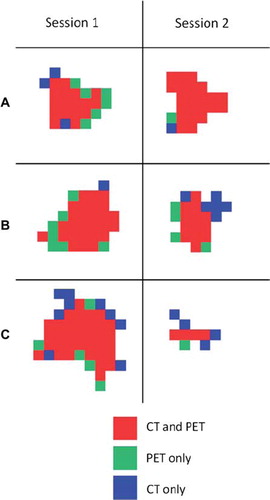
From this point on, all CT data analyzed were downsampled to PET image dimensions. The uptake regions resulting from region growing in the PET and the CT contrast enhancement images obtained one minute post injection are shown in . The grown regions appeared to be highly overlapping for all patients and imaging sessions, but some differences were evident. The uptake volumes following region growing in PET and CT contrast enhancement images are provided in , together with the intersection (UV∩) of the two uptake volumes. The uptake volumes are generally smaller than the original tumor volumes (see ), due to the limited scan length. As shown in , the uptake volumes derived from PET and CT were quite similar, with PET giving on average 6% greater volume. Dice's similarity coefficient between UPET and UVCT is also given. A median Dice coefficient of 0.81 was obtained, considering all patients and imaging sessions.
Figure 2. Segmented tumor uptake regions following region growing in FDG-PET (light green) and DCECT (blue) images obtained one minute post injection. The intersection of the regions is given in red. Only the central coronal plane of the tumor is shown.
shows the temporal uptake characteristics in the tumors (that is, within UV∪) at both imaging sessions. The temporal characteristics between the PET and contrast enhanced CT images were highly correlated (), with a median correlation of 0.85. Furthermore, the tumor heterogeneity, as evaluated by the lower and upper quartiles of the uptake distribution, is often high in both image series at very early time points (). Both DPET and DCECT showed a significant (p = 0.03 and p = 0.01, respectively) reduction in tumor heterogeneity with time following a first order linear regression on a pooled dataset containing all patients and imaging sessions. Overall, using a two-sided paired t-test, there were no significant differences in tumor heterogeneity as evaluated by PET and CT.
Figure 3. Time-activity/time-enhancement curves for FDG-PET and DCECT, respectively, for patients A–C at imaging sessions 1 and 2. The curves were obtained by extracting the mean uptake within the tumor (corresponding to UV∩;) at each time point post injection. Data were further normalized to the mean uptake over the time period in question. The bars indicate the upper and lower quartile of the uptake distribution within the tumor.
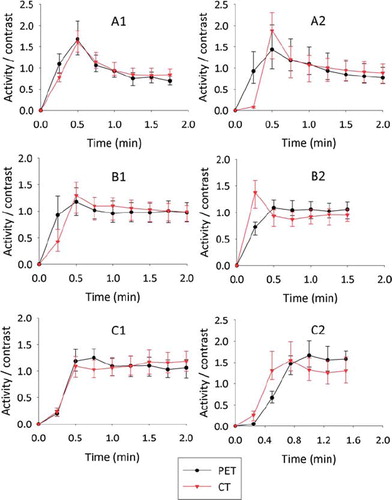
Table II. Uptake volumes (UVs) following region growing in FDG-PET and DCECT images obtained one minute post injection for patient A–C at imaging sessions 1 and 2 (prior to and after fractionated radiotherapy). UV∩is the intersection of UVPET and UVCT. Dice's similarity coefficient for UVPET and UVCT, the maximum spatial correlation between FDG-PET and DCECT (within UV∩) and the temporal correlation is also given.
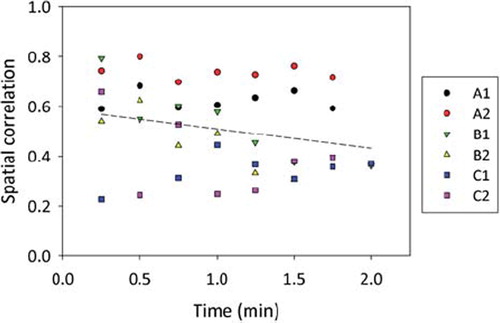
shows the uptake pattern within the tumor for both PET and CT at different time points for patient B at imaging session 1. Corresponding voxel-by-voxel plots of the PET values against the CT contrast enhancement values are also provided, with Pearson's correlation coefficient given as a measure of the spatial correlation. For the case shown, a marked reduction in the spatial correlation with time post injection was evident. The spatial correlation as a function of time post injection is shown in for all patients and imaging sessions. Using first order linear regression, a significant (p < 0.02) decrease in the spatial correlation with time was found only for patient B at both sessions. In , the maximum spatial correlation over the interval 0–2 minutes post injection between PET and CT images is given for each patient and imaging session. The population-based median of the maximum spatial correlation was 0.72. A first order linear regression on a pooled dataset containing all patients and imaging sessions is also shown in , showing an insignificant (p = 0.14) decrease in correlation with time.
Figure 4. Central coronal FDG-PET and DCECT images of a tumor obtained at different time points post injection (left). All PET and CT voxel values within the entire tumor are plotted against each other (right). The solid line is a first order linear regression, while the r-values represent Pearson's correlation coefficient, indicating the degree of spatial correlation. The example is shown for patient B at imaging session 1.
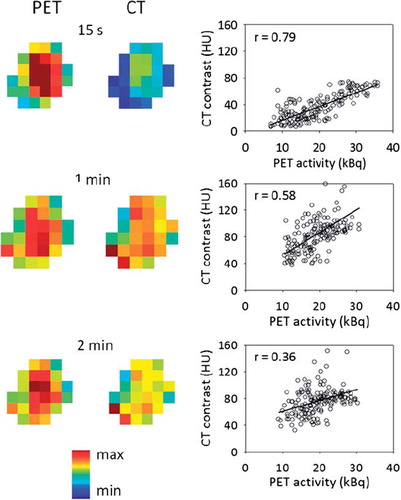
Figure 5. The dependence of the spatial correlation between FDG-PET and DCECT voxel values within the tumor on time post injection. Data for individual patients (A–C) at given imaging session (1 and 2) are shown. The dashed line indicates a first order linear regression on the pooled data.
Discussion
In the current work, tumor uptake patterns depicted by DPET and DCECT were compared in time and space. It was shown that uptake volumes segmented from the respective image series were, in absolute terms, quite similar. Also, the uptake volumes showed a relatively good spatial correspondence, as assessed by Dice's similarity coefficient. Furthermore, both the spatial and temporal uptake characteristics showed relatively high correlations between DCECT and DPET, with the temporal uptake patterns showing the greatest resemblance. Thus, this study indicates that the wash-in characteristics of FDG and iohexol/iodixanol are similar, and that dynamic PET therefore could prove a powerful method where perfusion and metabolism potentially may be assessed in a single scan. This is in line with a study comparing dynamic FDG-PET and blood flow measured by 15O-labeled water [Citation14], where the early uptake of FDG was linearly correlated with blood flow (r = 0.86). The authors of that study thus concluded that the early uptake of FDG may provide an estimate of tumor perfusion.
The current study has some limitations, in addition to the limited number of patients that were included. First, absolute concentrations of iohexol/iodexanol could not be obtained, and only correlation analysis was thus relevant. Also, it has been argued that the temporal resolution should be as high as 1/2 s−1 in order to depict tracer entering and passing through the capillary bed [Citation15], while the temporal resolution in the dynamic PET image series was only 1/15 s−1. Thus, the vascular distribution phase was most likely missed using the current protocol. However, increasing the temporal resolution would have increased the noise in the images, reducing the relevance of comparing the spatial uptake pattern in DPET and DCECT images. Furthermore, only the central part of the tumors could be analyzed due to the limited CT scan length (2.4 cm). Also, the bolus size and time to administer FDG or iohexol/iodexanol differs. Moreover, a possible source of error is small unwarranted shifts in patient positioning between DCECT and DPET imaging. Furthermore, as FDG is a smaller molecule compared to iohexol and iodexanol (molecular weights of 181, 821 and 1550 Da, respectively), diffusion of FDG may be faster under permeability-limited conditions. Also, the PET and CT systems register and reconstruct the image information in inherently different ways, and downsampling and interpolation of the CT image series was necessary. This may lead to systematic differences between the respective image series.
Due to the physiologic differences in the uptake of FDG and iohexol/iodexanol discussed, it is expected that the uptake patterns are most similar at the earliest time points post injection. At later time points, when wash-out of iohexol/iodexanol starts while FDG, on the other hand, becomes incorporated in glycolytically active cells, larger differences between DPET and DCECT images are expected. However, although the correlation between DPET and DCECT images was reduced with time after injection ( and ), the reduction was not significant (considering all patients and imaging sessions). This could potentially be due that the scan time (2 min) was too short for observing large differences, or that noise or other limitations addressed above dominate over the underlying spatiotemporal uptake patterns.
Abnormal vasculature and elevated glucose metabolism are both markers for malignant tumors [Citation1]. In a case report on one of the currently enrolled patients (patient A), we noted a qualitative resemblance between images provided by contrast enhanced CT, contrast enhanced cone beam CT and static FDG-PET [Citation12]. In addition to the spatiotemporal analysis performed above, we have also compared static FDG-PET images obtained 45 min post injection with DCECT and DPET images acquired 0–2 min post injection (data not shown). Taken over all patients and imaging sessions, the median of the maximum spatial correlation between DCECT and static PET was 0.51 (range 0.17–0.76) and the maximum correlation between DPET and static PET was 0.70 (range 0.53–0.88). Thus, our data that indicate that images obtained during the early wash-in phase do, to some degree, resemble images obtained during the late metabolic phase. In contrast, Abramyuk et al. [Citation11] found weak correlations between static PET and blood volume maps from DCECT of about 0.3 for 10 patients with head and neck cancer. However, the image analysis and estimated image parameters in that work seem quite different from that used in the current study, preventing a direct comparison.
Assessment of intra-tumor heterogeneity by medical imaging may be of importance in both treatment outcome prediction and biologically adapted strategies [Citation16–19]. We found no differences in tumor uptake heterogeneity between DPET and DCECT images (with 5 mm voxel resolution), further supporting the hypothesis that the early uptake phase is similarly depicted by the two modalities. However, when comparing the intra-tumor heterogeneity in the native CT images with the downsampled ones, we found a two- to threefold reduction in heterogeneity after downsampling (data not shown). This reduction may partly be due to the implicit noise filtering in the downsampling, but true biological variations may also have been lost. For instance, the intervessel distance in tumors may vary from 10–1000 μm [Citation20], and high-resolution DCECT (voxel size about 500 μm) images has been shown to correlate with the spatial distribution of blood vessel density [Citation16]. On the other hand, PET (with voxel dimensions of typically 5 mm) may not depict such variations. However, the role of intra-tumor heterogeneity and image resolution on treatment outcome prediction is not clear, and more studies are needed where this issue is addressed.
Spontaneous canine tumors are attractive models in oncology. Unlike xenografts in mice or rats, spontaneous canine tumor are of similar size to human tumors and also share many other tumor biological features with their counterparts in human oncology [Citation21]. We have previously studied the uptake characteristics in canine tumors using dynamic contrast enhanced magnetic resonance imaging (DCEMRI) [Citation22,Citation23]. A reduction in a perfusion-related image parameter (kep) during the course of fractionated therapy was observed [Citation23], which also has been found for patients with cervical cancer [Citation24]. A reduction in a comparable DCEMR image parameter (initial area under the concentration curve; IAUC) has also been observed in murine models following fractionated radiotherapy [Citation25]. Furthermore, it has been speculated whether dynamic contrast enhanced imaging may be a surrogate for hypoxia imaging [Citation3,Citation26–30]. Thus, assessing tumor perfusion by dynamic contrast enhanced imaging, or alternatively dynamic PET, may play a role in treatment monitoring and adaptive strategies.
There are a variety of options available for segmentation of radiotherapy planning volumes in medical images [Citation31]. In the current work, region growing was tentatively used for assessing the uptake volumes. The growing was performed using the same seed location and constraints in the PET and CT images, making the segmentation more objective. Also, a common intersection volume (Uv∩) was identified from the growing where both modalities showed a distinct uptake and where it was sensible to calculate correlations. Quite high Dice similarity coefficients were found (median 0.81, ), considering all the limitations in the current study discussed above. In dynamic PET, segmentation of perfusion (wash-in) images may prove valuable, in addition to segmentation of ‘metabolic’ scans typically obtained one hour post injection. One may consider employing the union of such segmented volumes as the target volume in radiotherapy, as the union contains both regions of abnormal vasculature and metabolism.
In conclusion, the early uptake patterns in tumors assessed by dynamic FDG-PET and dynamic contrast enhanced CT were similar. If imaging of tumor perfusion is considered relevant, one may consider using dynamic PET only. This will also reduce the radiation dose to patients. However, for diagnostic purposes, the high resolution in CT images may still be warranted. Further research and clinical studies on this topic is needed for assessing the value of combined DCECT and PET imaging.
Acknowledgements
Arne Skretting is gratefully acknowledged for support with PET/CT imaging.
Declaration of interest: The authors report no conflicts of interest. The authors alone are responsible for the content and writing of the paper.
References
- Tredan O, Galmarini CM, Patel K, Tannock IF. Drug resistance and the solid tumor microenvironment. J Natl Cancer Inst 2007;99:1441–54.
- Glunde K, Pathak AP, Bhujwalla ZM. Molecular-functional imaging of cancer: To image and imagine. Trends Mol Med 2007;13:287–97.
- Malinen E, Sovik A, Hristov D, Bruland OS, Olsen DR. Adapting radiotherapy to hypoxic tumours. Phys Med Biol 2006;51:4903–21.
- Sovik A, Malinen E, Olsen DR. Strategies for biologic image-guided dose escalation: A review. Int J Radiat Oncol Biol Phys 2009;73:650–8.
- Sovik A, Malinen E, Olsen DR. Adapting biological feedback in radiotherapy. Semin Radiat Oncol 2010;20:138–46.
- Thorwarth D, Alber M. Implementation of hypoxia imaging into treatment planning and delivery. Radiother Oncol 2010; 97:172–5.
- Grau C, Olsen DR, Overgaard J, Hoyer M, Lindegaard JC, Muren LP. Biology-guided adaptive radiation therapy – presence or future? Acta Oncol 2010;49:884–7.
- Lee TY, Purdie TG, Stewart, E. CT imaging of angiogenesis. Q J Nucl Med 2003;47:171–87.
- Castell F, Cook GJ. Quantitative techniques in 18FDG PET scanning in oncology. Br J Cancer 2008;98:1597–601.
- Zhao S, Kuge Y, Mochizuki T, Takahashi T, Nakada K, Sato M, . Biologic correlates of intratumoral heterogeneity in 18F-FDG distribution with regional expression of glucose transporters and hexokinase-II in experimental tumor. J Nucl Med 2005;46:675–82.
- Abramyuk A, Wolf G, Shakirin G, Haberland U, Tokalov S, Koch A, . Preliminary assessment of dynamic contrast-enhanced CT implementation in pretreatment FDG-PET/CT for outcome prediction in head and neck tumors. Acta Radiol 2010;51:793–9.
- Rodal J, Sovik S, Skogmo HK, Knudtsen IS, Malinen E. Feasibility of contrast-enhanced cone-beam CT for target localization and treatment monitoring. Radiother Oncol 2010;97:521–4.
- Sovik A. Rodal J, Skogmo HK, Lervag C, Eilertsen K, Malinen, E. Adaptive radiotherapy based on contrast enhanced cone beam CT imaging. Acta Oncol 2010;49:972–7.
- Mullani NA, Herbst RS, O'Neil RG, Gould KL, Barron BJ, Abbruzzese JL. Tumor blood flow measured by PET dynamic imaging of first-pass 18F-FDG uptake: A comparison with 15O-labeled water-measured blood flow. J Nucl Med 2008; 49:517–23.
- Tofts PS, Brix G, Buckley DL, Evelhoch JL, Henderson E, Knopp MV, . Estimating kinetic parameters from dynamic contrast-enhanced T(1)-weighted MRI of a diffusable tracer: Standardized quantities and symbols. J Magn Reson Imaging 1999;10:223–32.
- Cao M, Liang Y, Shen C, Miller KD, Stantz, KM. Developing DCE-CT to quantify intra-tumor heterogeneity in breast tumors with differing angiogenic phenotype. IEEE Trans Med Imaging 2009;28:861–71.
- Nilsen L, Fangberget A, Geier O, Olsen DR, Seierstad, T. Diffusion-weighted magnetic resonance imaging for pretreatment prediction and monitoring of treatment response of patients with locally advanced breast cancer undergoing neoadjuvant chemotherapy. Acta Oncol 2010;49:354–60.
- Rodal J, Sovik A, Malinen E. Influence of MLC leaf width on biologically adapted IMRT plans. Acta Oncol 2010;49: 1116–23.
- Petit SF, Dekker AL, Seigneuric R, Murrer L, van Riel NA, Nordsmark M, . Intra-voxel heterogeneity influences the dose prescription for dose-painting with radiotherapy: A modelling study. Phys Med Biol 2009;54:2179–96.
- Konerding MA, Fait E, Gaumann A. 3D microvascular architecture of pre-cancerous lesions and invasive carcinomas of the colon. Br J Cancer 2001;84:1354–62.
- Paoloni M, Khanna, C. Translation of new cancer treatments from pet dogs to humans. Nat Rev Cancer 2008;8:147–56.
- Sovik A, Kippenes Skogmo H, Bruland OS, Rune Olsen D, Malinen E. DCEMRI monitoring of canine tumors during fractionated radiotherapy. Acta Oncol 2008;47:1249–56.
- Sovik S, Skogmo HK, Andersen EK, Bruland OS, Olsen DR, Malinen, E. DCEMRI of spontaneous canine tumors during fractionated radiotherapy: A pharmacokinetic analysis. Radiother Oncol 2009;93:618–24.
- Zahra MA, Tan LT, Priest AN, Graves MJ, Arends M, Crawford RA, . Semiquantitative and quantitative dynamic contrast-enhanced magnetic resonance imaging measurements predict radiation response in cervix cancer. Int J Radiat Oncol Biol Phys 2009;74:766–73.
- Horsman MR, Nielsen T, Ostergaard L, Overgaard J. Radiation administered as a large single dose or in a fractionated schedule: Role of the tumour vasculature as a target for influencing response. Acta Oncol 2006;45:876–80.
- Loncaster JA, Carrington BM, Sykes JR, Jones AP, Todd SM, Cooper R, . Prediction of radiotherapy outcome using dynamic contrast enhanced MRI of carcinoma of the cervix. Int J Radiat Oncol Biol Phys 2002;54:759–67.
- Hermans R, Meijerink M, Van den Bogaert W, Rijnders A, Weltens C, Lambin P. Tumor perfusion rate determined noninvasively by dynamic computed tomography predicts outcome in head-and-neck cancer after radiotherapy. Int J Radiat Oncol Biol Phys 2003;57:1351–6.
- Zahra MA, Hollingsworth KG, Sala E, Lomas DJ, Tan LT. Dynamic contrast-enhanced MRI as a predictor of tumour response to radiotherapy. Lancet Oncol 2007;8:63–74.
- Newbold K, Castellano I, Charles-Edwards E, Mears D, Sohaib A, Leach M, . An exploratory study into the role of dynamic contrast-enhanced magnetic resonance imaging or perfusion computed tomography for detection of intratumoral hypoxia in head-and-neck cancer. Int J Radiat Oncol Biol Phys 2009;74:29–37.
- Ellingsen C, Egeland TA, Gulliksrud K, Gaustad JV, Mathiesen, B, Rofstad EK. Assessment of hypoxia in human cervical carcinoma xenografts by dynamic contrast-enhanced magnetic resonance imaging. Int J Radiat Oncol Biol Phys 2009;73:838–45.
- Zaidi H, El Naqa I. PET-guided delineation of radiation therapy treatment volumes: A survey of image segmentation techniques. Eur J Nucl Med Mol Imaging 2010;37:2165–87.