Abstract
Background and purpose. In this study the influence of fiducial markers (FMs) on diffusion-weighted (DW) magnetic resonance images was investigated by measuring the intensity variations due to the artefact from the FM image reconstruction. Material and methods. DW- and reference T1W images were acquired of an Agar-gel phantom containing two fixed cylindrical FMs, with a 1.5- and 3T MR scanner. The center of gravity (CoG) positions of the manually segmented FM artefacts (FMA) and the size of FMAs in x-, y- and z direction were measured in the two corresponding image sets, based on the intensity changes caused by the FM reconstruction. Also, a similarity measure, the Dice similarity coefficient (DSC), of the segmented FMAs in the two image sets was calculated. Results. The mean shift of the CoG of the manually segmented FMAs in the phase encoding (PE) and the two orthogonal directions, respectively, was: 1.5T/3T; 0.3 ± 0.1/0.5 ± 0.3 cm and 1.5T/3T; 0.1 ± 0.1/0.1 ± 0.1 cm. The largest shift was observed in the 3T DW images for FMs aligned with the long axis orthogonal to the PE direction (0.9 ± 0.1 cm). The mean size of the FMA in the PE- and the two orthogonal directions, respectively, was: 1.5T/3T; 1.7 ± 0.5/1.3 ± 0.1 cm, and 1.5T/3T; 0.9 ± 0.3/1.0 ± 0.2 cm. The mean DSC value of the segmented artefact volumes in the DW- vs. T1W images were 21% and 5% for the 1.5- and 3.0T MR scanner, respectively. Conclusions. This study has shown that both the size and displacement of the FMAs increase in the PE direction on DW images. The larger shifts were observed for FMs positioned with the long axis orthogonal to the PE direction. Measurements obtained for different b-values gave consistent results.
T2-weighted (T2W) magnetic resonance (MR) images are frequently utilized to perform prostate target and normal tissue delineations in external beam radiotherapy (RT) planning, due to superior soft tissue contrast compared to computed tomography (CT) [1–3]. An increased interest in performing diffusion weighted (DW) magnetic resonance imaging (MRI) has arisen owing to the ability of DW images to differentiate tumors from healthy tissues [4–6]. In addition, multiple studies have reported that T2W imaging together with DW imaging achieve better prostate cancer detection compared to T2W imaging alone [7–10]. DW imaging combined with standard T2W imaging has shown an increased sensitivity and specificity for detecting prostate cancer of 71–89% and 61–91%, respectively, in comparison to 51–86% and 60–91%, respectively, for T2W imaging alone [7–9]. Miao et al. stated that the performance of DW imaging provide better prostate tumor detection than T2W imaging [11]. They further reported that a 3T MR scanner is preferable to a 1.5T scanner because of higher signal-to-noise ratio (SNR) [11]. An active research area within the field of external beam RT in general and for prostate cancer in particular is the quest for improved delivery precision and hence treatment margin reduction. In prostate cancer this development has been enabled by the introduction of fiducial markers (FMs) inserted into the prostate [12]. In order to implement DW imaging into prostate planning procedures it is of high importance that an accurate DW image registration can be accomplished with T1W- and T2W- as well as CT images based on internal FMs. However, the obstacle is that FMs cause distortions on MR images because of their intrinsic magnetic susceptibility [13], which induces difficulty in determining the accurate shape and true position of the FM. Commonly on MR images, a metal artefact appear with a region of zero signal, usually with a very high intensity rim on one or two edges [14]. The aim of this study was therefore to investigate the amount of distortion that the reconstructed FM artefact (FMA) introduces on DW images by analyzing the produced intensity variation in the images from the FMA.
Materials and methods
An Agar-gel phantom was constructed having two cylindrical FMs (of 24-carat gold; Goldlock®, BEAMPOINT, Kista, Sweden) embedded, each of dimensions 1 × 3 mm. DW-, T1W- and CT images of the phantom were acquired in three different imaging positions, as illustrated in . The phantom was positioned similarly at each image modality by aligning laser equipment with markings on the phantom. The DW- and T1W MR images, generated in the same frame of reference, were acquired both at 1.5T (SymphonyVision, Siemens Medical) and at 3T (Achieva, Philips Medical Systems). The transversal single shot-echo planar imaging (SS-EPI) based DW images (1.5T/3T; TE: 82/79 ms, TR: 2500/3433 ms, acquired resolution (frequency, phase): 2.19, 2.19 /2.25, 2.32 mm/pxl, reconstructed resolution: 2.19/ 0.97 mm/pxl, slice thickness: 5.5/5.5 mm) were based on clinical protocols of the pelvis, including the use of parallel imaging with a sense-factor of 2. The b-values utilized, for each DW image sequence, were: 0, 150, 600, 1000 s/mm2. The DW images were acquired with the phase encoding (PE) direction in the lateral- and in the vertical direction. A rigid auto-match image registration in the Eclipse treatment planning system (TPS) (Varian Medical Systems, Palo Alto, CA, USA) was established of the CT- (slice thickness: 1 mm) and T1W images (1.5T/3T; TE: 15/76.19 ms, TR: 1020/600 ms, acquired resolution: 1.04, 1.04/1.00, 1.12 mm/pxl, reconstructed resolution: 1.04/0.44 mm/pxl, slice thickness: 2.00/2.00 mm) to certify the that the marker reconstruction on the T1W images could be utilized as a reference to the DW images.
Figure 1. The three imaging positions of the phantom in the MR- and CT scanner, where (a) shows image position 1, and (b) and (c) shows image positions 2, rotated 45°, and 3, rotated 90° relative to position 1, respectively.
The size of the FMAs were measured in the DW images in x-, y- and z direction, including the signal void area and the artefacts due to the FM susceptibility, for each b-value, based on the intensity changes generated from the FM image reconstruction. Furthermore, the intensity changes caused by the FMAs on the DW- and T1W images were manually segmented and measured in the Eclipse TPS. In addition, the displacements in x-, y- and z direction of the center of gravity (CoG) of the segmented volumes in DW images relative the reference T1W images were estimated. The minimum intensity position of the markers were also analyzed and compared to the measured CoG positions of the FMA volumes delineated in the DW- and T1W images. A similarity measure, the Dice similarity coefficient (DSC) of the segmented volumes in the two image sets, was calculated to evaluate the match- and similarity agreement of the volumes [15]. A DSC value close to unity describes a better similarity agreement of the two volumes. The DSC was defined as follows:
DSC(A,B)=2|A∩B|/(|A|+|B|)
where A and B are the two volume sets being compared.
The image sets with distinct b-values for each DW image sequence were compared to each other by evaluating the difference in visibility-, pixel intensity- and proportion of generated artefacts of the reconstructed FMAs.
Results
The image registration of the T1W- and CT images of the phantom for all three imaging positions resulted in a good match of the FMs. Hence, all FM measurements performed on DW images in this study were compared to T1W images as a reference.
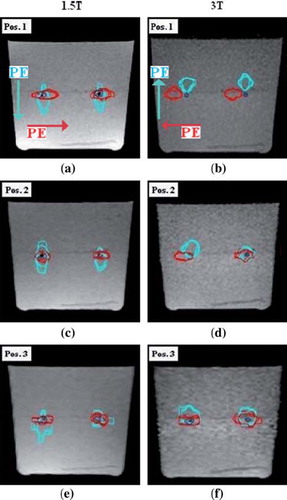
The delineated FMA volume for each b-value in DW images was consistent. presents the FMA delineations performed on T1W- and DW images for all b-values (and both 1.5–3T) acquired for all three phantom positions. The reconstructed FMAs tended to spread out in the PE directions.
Figure 2. The FMA delineations performed in the T1W- and DW images (1.5–3T), for all b-values and phantom positions 1, 2 and 3. The red- and cyan colored delineations represent the FMA contours performed on DW images with the PE direction applied in the lateral- and vertical direction, respectively. The dark-blue colored contouring presents the FMA delineation performed on the T1W images. The 1.5T MR images (a), (c) and (e) has the lateral- and vertical PE in the anterior-posterior (AP)- and right-left (RL) direction, whereas the 3T MR images (b), (d) and (f) has the corresponding PE in the PA- and LR direction.
The displacement of the CoG positions of the FMA volumes, relative the reference images, extended more in the PE direction as compared to the two orthogonal directions (). The mean shift in PE direction for DW images generated in all phantom positions was: 1.5T/3T; 0.3 ± 0.1 cm (max: 0.6)/ 0.5 ± 0.3 cm (max: 0.9). The corresponding mean displacements orthogonal to the PE direction was estimated to: 1.5T/3T; 0.1 ± 0.1 (max: 0.2)/ 0.1 ± 0.1 cm (max: 0.3). The 3T DW images obtained at phantom position 1 showed the largest shift in PE direction (), whereas smaller shifts were estimated for position 2 and 3 (). The smallest FMA shift encountered in the PE direction was for images acquired at phantom position 2, with a mean CoG shift for these volumes in x-, y- and z direction of 0.1 ± 0.1 cm. The minimum intensity position for the FMAs showed a mean mismatch of 0.0 cm (max: 0.3) as compared to the CoG position of the segmented volumes for DW images obtained with both MR scanners. Considerably larger shifts (5 mm) were obtained in the PE direction when comparing 3T to 1.5T, whilst deviations in the other directions of encoding were very small or negligible at both 1.5- and 3T.
Table I. The mean shift of the CoG position including range of the CoG position of the delineated FMA volumes on DW images acquired at phantom position 1, 2 and 3, relative reference T1W images, for the 1.5- and 3T MR scanner, respectively. PE-, FE- and SE correspond to the phase-, frequency- and slice encoding direction in the image.
The measured mean FMA volume in DW images, based on the implemented intensity changes, was approximately nine and 20 times as large as the corresponding volume measured in the reference images, for images obtained with the 1.5- and 3T MR scanners, respectively ().
Table II. The estimated mean FMA volumes (in cm3) on T1W and DW images (1.5–3T), generated at phantom position 1, 2 and 3, respectively, as well as the calculated mean DSC value for corresponding FMA volumes.
The mean DSC value for the delineated FMA volumes in the DW- and reference T1W images was 21% for the 1.5T- and 5% for the 3T MR scanner across all imaging positions. also details the DSC values calculated for the segmented artefact volumes in the two image sets, for all combinations of phantom position and scanners. The DSC value was consistently zero for the artefact volumes delineated in images acquired at phantom position 1 with the 3T MR scanner ().
The measured mean size of the FMAs in x-, y- and z direction, based on intensity variations, were spread out in the PE direction in comparison to the two orthogonal directions (). In the PE direction the mean size of FMAs on DW images for all phantom positions was: 1.5T/3T; 1.7 ± 0.5 (max: 2.5)/ 1.3 ± 0.1 cm (max: 1.6), while the mean size in the orthogonal directions to the PE direction was: 1.5T/3T; 0.9 ± 0.3 (max: 1.8)/ 1.0 ± 0.2 cm (max: 1.3). illustrate the reconstructed FMs on 1.5- and 3T DW image slices for b-values 0 and 1000 and the lateral intensity line profile measured across the FMA. The calculated mean FMA size in respective orthogonal direction can be viewed in . The observed difference between the DW images with low- (0–150 s/mm2) and high b-values (600–1000 s/mm2) was the measured intensity changes at the edges of the low intensity regions of the reconstructed FMs. This did not, however, lead to any notable difference in the measured size of FMAs (–4).
Figure 3. The lateral intensity line profile across the two reconstructed FMAs on 1.5T DW image slices, acquired with phantom in position 1; (a) and (c) shows DW image slices for b-value 0 and the PE direction applied in the anterior-posterior (AP) and right-left (RL) direction, respectively, (b) and (d) shows DW image slices for b-value 1000 with the PE direction applied in the AP- and RL direction, respectively.
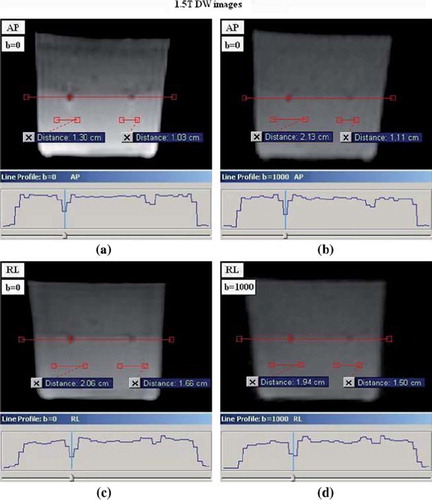
Figure 4. The lateral intensity line profile across the reconstructed FMAs in 3T DW image slices, obtained with phantom in position 1; (a) and (c) shows DW image slices for b-value 0 and the PE direction applied in the posterior-anterior (PA) and left-right (LR) direction, respectively, (b) and (d) shows DW images for b-value 1000 and the PE direction applied in the PA- and LR direction, respectively.
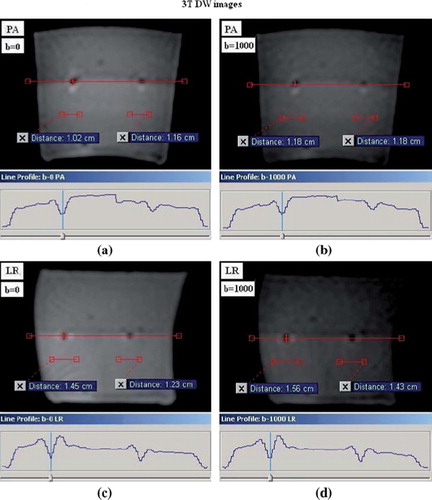
Table III. The estimated mean size of FMAs in the PE-, FE- and SE direction on DW images, for phantom in imaging positions 1, 2 and 3 and for both MR scanners.
Discussion
In DW images the FMAs cause regions of image distortion and hence an uncertainty in the determination of the actual FM position. In this study we have investigated the intensity variations caused by FMAs on 1.5- and 3T DW images that were based on clinical protocols of the pelvis. It was found that the choice of PE direction and orientation of the FM relative to the scanner coordinates has a substantial influence on the reconstructed FMA on DW images. DW sequence parameters such as image resolution and pixel bandwidth also influences the appearance of FMA in the reconstructed image. In order to implement DW imaging into planning routines for prostate RT it is essential that the image representation of the FMA for a given set of MR parameters is well-defined.
The FMAs in the DW images appeared as a low intensity area surrounded by high intensity edges in the FE- and PE direction, where they were particularly extended (–4). The FMAs in the DW images for distinct b-values had a similar appearance. However at higher b-values (600–1000 s/mm2) there was a difficulty in viewing to what extent the low- and high intensity regions reached, due to the lower signal in these DW images. Despite this, it was feasible to measure the size of the FMAs in these images by measuring the intensity profile across the FMAs (–4). Subsequently, the difference in the measured size and volume delineations performed on distinct b-values were negligible.
Moreover, in almost all DW images the observed volume shift and size of FMAs extended considerably in the PE direction as compared to the orthogonal directions. The CoG shifts of the FMA volumes relative to the reference images were generally larger on the 3T DW images in comparison to the 1.5T DW images. This is due to the stronger magnetic field strength applied in the 3T MR scanner, which increases the sensitivity for magnetic susceptibility mis-match between the FM and the surrounding medium. This disturbance further leads to a misinterpretation of the marker position and hence the larger position displacement as the reconstruction algorithm expects the object under imaging to experience a homogenous magnetic field and linear gradients [16]. Previous studies in other fields of application have shown that MR image quality improves when applying the PE direction parallel to the long axis of the metal implant [13,17]. This statement agrees well with the observed smaller shifts for both markers in the 3T DW images and for marker no. 2 in the 1.5T DW images, acquired at position 3. The same results were further obtained for the PE direction orthogonal to the length of the marker, i.e. posterior-anterior (PA) direction in the 3T DW images and in the AP direction in the 1.5T DW images. The CoG shift for the delineated FMA volume of FM no. 1 in DW images acquired at phantom position 2 with both scanners, encountered a mean shift of approximately 1 mm in x, y and z direction for either PE direction, i.e. lateral or vertical. The different results obtained for the two FMs in the phantom on the DW images confirm that the two FMs were not aligned perfectly in parallel. Based on the results the FMA seems to have the largest shift when aligned with its (long) axis orthogonal to the PE direction. However, when rotated from this position the shift in this direction tended to decrease.
The evaluated size of the FMA in x-, y- and z direction, based on intensity measurements was generally larger in the PE direction. Furthermore, the FMA sizes measured were larger on DW images acquired with the 1.5T MR scanner in contrast to the 3T scanner. This is due to the larger pixel bandwidth on the 3T DW images. The increased bandwidth makes the artefact appear smaller in the image, as a result of the frequency change occurring over a decreased number of pixels [17].
The observed shift and size of FMAs on DW images consequently introduce a difficulty in the interpretation of the actual position of the FMs on DW images. Shifts as large as 0.4 cm in the 1.5T DW images and 0.9 cm in the 3T DW images was measured. Besides the shifts, the FM image reconstruction produced a large artefact in the images which introduce yet another uncertainty to validate the FM position with good precision. Hence, in order to utilize FM based co-registered DW images with CT images it is vital that the encountered shift of FMs on DW images can be accurately determined and the position of the FM can be localized with satisfied precision.
The FMs investigated in this study were 24-carat gold markers with dimensions 1 × 3 mm, which is the currently applied FM in our radiotherapy department. However, other FMs of different sizes and material composition may introduce smaller artefacts on DW images. The optimal FM would provide a good visualization of the marker on DW-, T2W- and CT images but also lead to small artefacts in the images.
The DSC value results showed a connection with the CoG shifts of the delineated FMA volumes, thus, the larger the shift introduced the smaller the DSC value. In order to gain a DSC of unity (100%), the two distinct volumes must have identical shape, rotation and position in space. If the two volumes do not overlap on the whole, the DSC value will be zero regardless of the similarity agreement of the two volumes. This is the case for the FMA volumes in the 3T DW- and T1W images generated at position 1, and is explained by the large CoG shift of the FMA in the DW images. The DSC results of the segmented FMA volumes in the 1.5T MR images show that the two comparing volumes overlap to some extent, however, regarding the DSC values the similarity of the volumes is far from equal.
In general, DW imaging is very sensitive to imperfect hardware, such as B0 inhomogeneity, non-linear gradients and to patient related error-sources, such as respiration and air-tissue transitions. Despite the fact that artefacts due to these increases at higher field strength DW imaging of the prostate is feasible at 3T, since the prostate is located in the center of the magnet reducing artefacts due to inhomogeneity and non-linearity of gradients.
The influence on pixel intensities from FMAs is of great importance when interpreting DW images in a quantitative manner by calculating maps of the apparent diffusion coefficient (ADC). The ADC-map is based on the pixel intensities in the DW images acquired with different b-values, and where the ADC-values have been linked to both the cellular density and to the Gleason score in prostate patients [18,19]. Consequently, the ADC-map is an attractive candidate when considering biologically adapted RT, e.g. dose-painting and where the knowledge of which ADC-values that are affected due to the artefact from the FMs is of great interest.
This study focused on the influence of FMs in DW imaging. In future studies it would be of large interest to vary the image acquisition parameters (image resolution, bandwidth, marker orientation relative to PE direction, etc.) that has an impact on the resulting FMA in DW images, in order to find an optimized set of MR parameters to both minimize the artefact whilst still allow for a good definition of the reconstructed FM. These optimized parameters should not only be tested in a phantom but also in patients, as FMAs in a homogenous phantom will not necessarily be reproduced similarly in a non-homogenous ambient of tissues, i.e. a patient. In addition it would be valuable to examine the low pixel area appearing in the artefacts, to evaluate the robustness of this region when alternating the MR parameters. The question is also whether the low pixel area of the FMAs reflects the actual position of the FMs on DW images. Finally, it would be interesting to find an approach to evaluate with what accuracy and precision the FMs can be localized on 1.5- and 3T DW images in a phantom and in particular in patients. If this could be accomplished successfully this will pave the way for clinical implementation of DW imaging for target delineation in prostate RT planning.
In conclusion, based on intensity measurements of gold markers influence on DW images, this study has shown that the size and displacement of the reconstructed marker artefact depends on the particular PE direction chosen relative to the marker orientation in the DW images. It was observed that the size and shift of the artefact, compared to reference T1W images, increased in the PE direction. The larger shifts of the FMAs were observed for markers positioned with the long axis orthogonal to the PE direction. Finally, the measurements performed on DW images for different b-values gave consistent results.
Declaration of interest: The authors report no conflicts of interest. The authors alone are responsible for the content and writing of the paper.
References
- Lee YK, Bollet M, Charles-Edwards G, Flower MA, Leach MO, McNair H, . Radiotherapy treatment planning of prostate cancer using magnetic resonance imaging alone. Radiother Oncol 2003;66:203–16.
- Rasch C, Barillot I, Remeijer P, Touw A, Van Herk M, Lesbesque JV. Definition of the prostate in CT and MRI: A multi-observer study. J Radiat Oncol Biol Phys 1999;43:57–66.
- Buhl SK, Duun-Christensen AK, Kristensen BH, Behrens CF. Clinical evaluation of 3D/3D MRI-CBCT automatching on brain tumors for online patient setup verification – A step towards MRI-based treatment planning. Acta Oncol 2010;49:1085–91.
- Lambrecht M, Deroose C, Roels S, Vandecaveye V, Penninckx F, Sagaert X, . The use of FDG-PET/CT and diffusion-weighted magnetic resonance imaging for response prediction before, during and after preoperative chemoradiotherapy for rectal cancer. Acta Oncol 2010;49:956–63.
- Haack S, Pedersen EM, Jespersen SN, Kallehague JF, Lindegaard JC, Tanderup K. Apparent diffusion coefficients in GEC ESTRO target volumes for image guided adaptive brachytherapy of locally advanced cervical cancer. Acta Oncol 2010;49:978–83.
- Kallehague JF, Tanderup K, Haack S, Nielsen T, Muren LP, Fokdal L, . Apparent diffusion coefficient (ADC) as quantitative parameter in diffusion weighted MR imaging in gynaecologic cancer: Dependence on b-values used. Acta Oncol 2010;49:1017–22.
- Kajihara H, Hayashida Y, Murakami R, Katahira K, Nishimura R, Hamada Y, . Usefulness of diffusion-weighted imaging in the localization of prostate cancer. Int J Radiat Oncol Biol Phys 2009;74:399–403.
- Yoshimitsu K, Kiyoshima K, Irie H, Tajima T, Asayama Y, Hirakawa M, . Usefulness of apparent diffusion coefficient map in diagnosing prostate carcinoma: Correlation with stepwise histopathology. J Magn Reson Imaging 2008;27:132–9.
- Haider MA, van der Kwast TH, Tanquay J, Evans AJ, Hashmi AT, Lockwood G, . Combined T2-weighted and diffusion-weighted MRI for localization of prostate cancer. AJR Am J Roentgenol 2007;189:323–8.
- Shimofusa R, Fujimoto H, Akamata H, Motoori K, Yamamoto S, Ueda T, . Diffusion-weighted imaging of prostate cancer. J Comput Assist Tomogr 2005;29:149–53.
- Miao H, Fukatsu H, Ishigaki T. Prostate cancer detection with 3-T MRI: Comparison of diffusion-weighted and T2-weighted imaging. Eur J Radiol 2007;61:297–302.
- Parker CC, Damyanovich A, Haycrocks T, Bayley A, Catton CN. Magnetic resonance imaging in the radiation treatment planning of localized prostate cancer using intra-prostatic fiducial markers for computed tomography co-registration. Radiother Oncol 2003;66:217–24.
- Suh JS, Jeong EK, Shin KH, Cho JH, Na JB, Kim DH, . Minimizing artefacts caused by metallic implants at MR imaging: Experimental and clinical studies. AJR Am J Roentgenol 1998;171:1207–13.
- McRobbie DW, Moore EA, Graves MJ. MRI from picture to proton. Cambridge University Press: Cambridge; 2003.
- Dice LR. Measures of the amount of ecologic association between species. Ecology 1945;26:297–302.
- Doran SJ, Charles-Edwards L, Reinsberg SA, Leach MO. A complete distortion correction for MR images: I. Gradient warp correction. Phys Med Biol 2005;50:1343–61.
- Viano AM, Gronemeyer SA, Haliloglu M, Hoffer FA. Improved MR imaging for patients with metallic implants. Magn Reson Imaging 2000;18:287–95.
- Zelhof B, Pickles M, Liney G, Gibbs P, Rodrigues S, Kraus S, . Correlation of diffusion-weighted magnetic resonance data with cellularity in prostate cancer. BJU Int 2009;103:883–8.
- Tamada T, Sone T, Yoshimasa J, Toshimitsu S, Yamashita T, Tanimoto D, . Apparent diffusion coefficient values in peripheral and transitional zone of the prostate: Comparison between normal and malignant prostatic tissues and correlation with histologic grade. J Magn Reson Imaging 2008;28:720–6.