Abstract
Purpose. To evaluate the image quality obtained in a standard QA phantom with both clinical and non-clinical cone-beam computed tomography (CBCT) acquisition modes for the head and neck (HN) region as a step towards CBCT-based treatment planning. The impact of deteriorated Hounsfield unit (HU) accuracy was investigated by comparing results from clinical CBCT image reconstructions to those obtained from a pre-clinical scatter correction algorithm. Methods. Five different CBCT acquisition modes on a clinical system for kV CBCT-guided radiotherapy were investigated. Image reconstruction was performed in both standard clinical software and with an experimental reconstruction algorithm with improved beam hardening and scatter correction. Using the Catphan 504 phantom, quantitative measures of HU uniformity, HU verification and linearity, contrast-to-noise ratio (CNR), and spatial resolution using modulation transfer function (MTF) estimation were assessed. To benchmark the CBCT image properties, comparison to standard HN protocols on conventional CT scanners was performed by similar measures. Results. The HU uniformity within a water-equivalent homogeneous region was considerably improved using experimental vs. standard reconstruction, by factors of two for partial scans and four for full scans. Similarly, the amount of capping/cupping artifact was reduced by more than 1.5%. With mode and reconstruction specific HU calibration using seven inhomogeneity inserts comparable HU linearity was observed. CNR was on average 5% higher for experimental reconstruction (scaled with the square-root of dose between modes for both reconstruction methods). Conclusions. Judged on parameters affecting the common diagnostic image properties, improved beam hardening and scatter correction diminishes the difference between CBCT and CT image quality considerably. In the pursuit of CBCT-based treatment adaptation, dedicated imaging protocols may be required.
The introduction of linear accelerator mounted kilovoltage (kV) cone-beam computed tomography (CBCT) units in radiotherapy has improved the possibility to image the patient anatomy in the treatment position on a daily basis [Citation1–3]. Comparing the three dimensional (3D) anatomical information to the planning CT allows for immediate correction of positioning deviations before treatment delivery, but also more advanced use may be applied for dose verification, response assessment and treatment planning/adaptation [Citation4–13]. To save the patient from additional imaging dose, current CBCT acquisitions modes are aiming to reduce dose to a minimum and still achieve sufficient soft tissue and bone contrast for daily setup correction to be performed. However, the reduced dose may lead to limitations in the usability of the acquired image sets as the image quality and accuracy of CT-numbers [Hounsfield units (HU)] may decrease accordingly [Citation14]. The problem is further enhanced by the inherent property of CBCT with its large cone-beam geometry which makes it more prone to artifacts and scatter [Citation15] compared to conventional CT. To address these challenges and reduce the discrepancies to CT, dedicated and task-specific CBCT imaging protocols could be a solution to improve the image quality when, for example CBCT-based treatment adaptation is pursued. Based on the on-board-imager system (OBI, Varian Medical Systems, Palo Alto, CA, USA) the feasibility of treatment planning [Citation16,Citation17] and dose calculation [Citation18] using CBCT in the older clinical OBI v1.3 protocols have been reported as well as the dose calculation accuracy for pelvic adaptive radiotherapy in the clinical OBI v1.4 [Citation19,Citation20].
Since many head and neck (HN) cancer patient experience anatomical changes during the treatment course [Citation21] this site is expected to gain from adaptive radiotherapy [Citation13,Citation22,Citation23]. The aim of this study was to evaluate the image quality obtained with both clinical and non-clinical CBCT acquisition modes relevant for the HN region. The impact of deteriorate CT-number accuracy due to scatter and beam hardening was investigated by comparing results from clinical CBCT image reconstructions to those obtained from a new pre-clinical reconstruction method. This approach included a scatter correction algorithm to account for scatter in the raw image projections prior to reconstruction [Citation24] and has been shown to improve images of a pelvis phantom. At present no standard CBCT image quality protocol exists but following previous studies [Citation14,Citation25–27], we looked at HU uniformity, HU verification/linearity, contrast resolution and spatial resolution. Comparison to a standard head and neck protocol on conventional CT scanners was performed by similar measures.
Method and material
Imaging devices and acquisition parameters
All CBCT scans presented in this study were acquired with an OBI system (OBI v1.4, Varian Medical Systems, Palo Alto, CA, USA) mounted on a Trilogy Tx linear accelerator, consisting of a kV x-ray source and an amorphous silicon detector mounted on the gantry orthogonal to the treatment beam. The geometry of the imaging system was kept fixed for all measurements according to our HN protocols: Full-fan cone with bow tie filtration, source-detector distance of 1500 mm, 3 mm slice thickness, transversal field-of-view (FOV) of 250 mm, and a scan length of 180 mm giving a longitudinal FOV of approximately 175 mm. Five different CBCT acquisition modes were employed in the evaluation (). Standard-dose head (SDH) and high-quality head (HQH) are clinical HN protocols in OBI v1.4, both based on 200° “partial-angle” scan technique at a peak voltage of 100 kVp. Standard-dose head full scan (SDHFS) and high-quality head full scan (HQHFS) are copies of the two above, both with 360° rotation. These two experimental modes have been created and calibrated for this study along with a copy of an older clinical 360° full scan HN protocol in OBI v1.3 (OBI13FS) in which the peak voltage has been increased to 125 kVp.
Table I. Detailed CBCT image acquisition parameters.
To benchmark the CBCT image properties, two conventional multislice CT scanners used for radiotherapy planning in our department were used (models Mx8000 IDT 16 (CTMx) and BB16 (CTBB), Philips Medical Systems, Eindhoven, The Netherlands). The standard clinical spiral CT HN protocols were applied for both scanners: 120 kVp; 250 mm FOV; 16 × 0.75 mm collimation; 512 × 512 pixel matrix; filter sharp (c); 3 mm slice thickness. The exposure was kept fixed at values of 150 mAs or 300 mAs per frame.
CBCT image reconstruction
For all CBCT scans the raw image projections were transferred to a stand-alone reconstruction computer along with a copy of the calibration files for CBCT acquisition on the clinical OBI system. The reconstruction software was installed with a copy of the clinical reconstruction (referred to as OBI) as well as a new experimental pre-clinical reconstruction algorithm (Full fan experimental reconstruction – FFE) (Varian Medical Systems, Palo Alto, CA, USA). All reconstructions were performed using the OBI and FFE methods. Compared to the OBI, the FFE uses an adaptive pencil beam based scatter correction algorithm to account for scatter in the raw projections due to object size, object edge effects, detector scatter properties and the anti-scatter grid mounted on the OBI system. A detailed description of the models and parameters used as well as the complete reconstruction process has recently been presented by Sun and Star-Lack [Citation24]. Furthermore, improved analytical beam hardening correction based on models of beam spectrum, filtration in bow tie filter and object, and detector response has been employed [Citation28]. We have in this study not modified any parameters from the original setup. Only one additional calibration had to be performed “in house” for FFE reconstruction with each of the five modes in . As used for calibration in the clinical OBI, the conversion from linear attenuation coefficients to HU was done using scans of the Catphan 504 phantom (The Phantom Laboratory, Salem, NY) by assigning HU values from the Catphan manual to FFE reconstructed raw image values of seven different inhomogeneity inserts.
Catphan 504 phantom
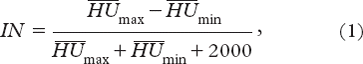
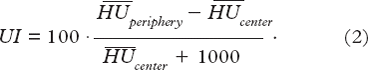
As in previous CBCT studies [Citation14,Citation25–27] we used the Catphan 504 phantom to compare image quality for the different acquisition modes and devices. The cylindrical phantom build of different modules has a diameter of 20 cm and length of 20 cm. The three modules used were the following: CTP 486 uniform water equivalent disk of 150 mm diameter for HU uniformity assessment; the CTP 404 containing eight 12 mm diameter inhomogeneity inserts of air (twice) (−1000 HU), PMP (−200 HU), low density polyethylene (LDPE) (−100 HU), polystyrene (PS) (−35 HU), acrylic (120 HU), Delrin (340 HU) and Teflon (990 HU); and the CTP 528 with 21 line pairs/cm for spatial resolution evaluation. illustrates the three module regions showing the corresponding axial slices and the regions of interest (ROIs) used in the analysis described below.
Figure 1. Representative slices of Catphan 504 phantom used to assess (a) HU uniformity, (b) HU verification and linearity, contrast, and (c) high contrast spatial resolution.
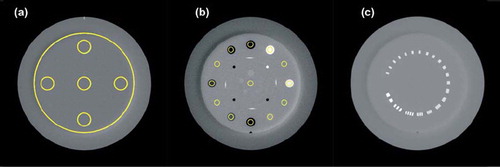
Image quality assessment
For the image quality analysis, all ROI statistics was performed in the software ImageJ (National Institute of Health, USA, http://rsb.info.nih.gov/ij) on image sets DICOM exported from the reconstruction. Results were displayed as an average from a separate analysis for clockwise and counter-clock wise CBCT acquisitions.
A first measure of the uniformity was assessed by looking at mean values and standard deviations of the distribution of HU values within the complete 150 mm diameter disk in the central slice of the CTP 486 module. Next, the mean HU values were measured in five circular 20 mm diameter ROIs, one positioned in the center of the phantom, and four in the periphery at top, right, bottom and left at a radial distance of 55 mm. To be able to compare uniformity between different scan protocols and devices the integral non-uniformity (IN) was calculated according to [Citation27]
where ![]() and
and ![]() are the minimum and maximum mean HU values, respectively, in the five ROIs. To evaluate the amount of cupping or capping, a uniformity index (UI) defined as the maximum percent difference between mean HU values of each the peripheral ROIs and the central ROI was estimated from [Citation27]
are the minimum and maximum mean HU values, respectively, in the five ROIs. To evaluate the amount of cupping or capping, a uniformity index (UI) defined as the maximum percent difference between mean HU values of each the peripheral ROIs and the central ROI was estimated from [Citation27]
Mean HU and standard deviation from 13 ROIs in the CTP 404 modules were measured in the axial slices of the inserts (). The circular ROIs were 8 mm in diameter, and eight of them were positioned in the inserts, four were measuring background between the inserts at the same radial position, and the last was in the center of the slice. HU values were compared to the nominal values for the material inserts.
From the mean (signal) and standard deviations σ (noise) measured in the ROIs above, two contrast measures were evaluated. First, the contrast-to-noise ratio (CNR) was defined as the difference in signal between each insert and background, divided by average noise, according to
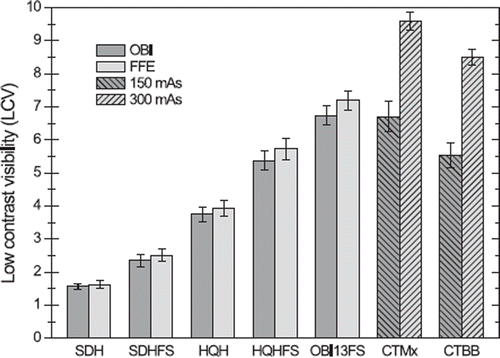
In a similar way, from the two inserts with closest nominal HU values, low-density polyethylene (LDPE, -100 HU) and polystyrene (PS, -35 HU), a low contrast visibility was defined as
The modulation transfer function (MTF) which represents a measure of the spatial resolution in the imaging system was evaluated in the Catphan CTP 528 module according to the method outlined by Grimmer et al. [Citation29]. To summarize, this implementation estimates an average edge spread function (ESF) from 360 radial profiles crossing the edge around the phantom. The derivative of the ESF yields the line spread function (LSF) which by subsequent fast Fourier transformation (FFT) provides the MTF. With normalization to 1 at zero spatial frequency, the MTF value at 50% and 10% were estimated. The analysis was performed on reconstructions with an offset of + 1000 HU added to the HU-scale to avoid clipping of HU values below -1000 HU which may lead to overestimation of the MTF.
To compare the image quality of the different CBCT modes for a humanoid phantom, the head part of the anthropomorphic Alderson Radiation Therapy phantom (RSD Inc., Long Beach, CA, USA) were scanned and reconstructed with both CT and CBCT using the same parameters as above. The distributions of HU values within the body outline over a longitudinal distance of 14 cm were compared.
Results
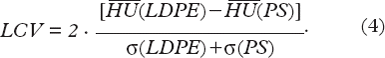
shows the plot of the nominal HU values of the Catphan inserts as a function of the measured raw image values in the ROIs depicted in obtained with FFE reconstruction without assignment of HU values. Before the plotting, the raw image values were translated by adding a constant of 890 and 900 for 100 kV and 125 kV modes, respectively. These two values were not arbitrary but found to yield the best agreement between nominal and measured HU values in the inserts after reconstruction. The results of linear regression fits to the data are also shown in , and these parameters were subsequently used to assign HU values in all FFE reconstructed CBCT images.
Figure 2. Plot of the nominal HU values of the seven Catphan inserts as a function of translated raw image values after FFE reconstruction for the five CBCT modes. Before the plotting, the raw image values were translated by adding a constant of 890 and 900 for 100 kV and 125 kV modes, respectively. Solid lines stem from linear regression fits shown in the figure legends.
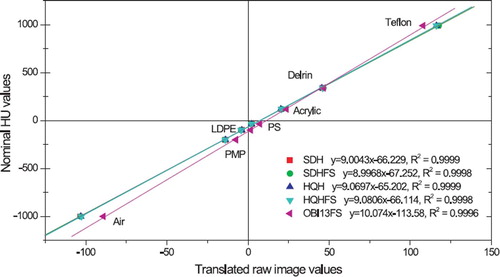
From the distribution of HU values (∼74 000 pixels) in the uniform disk, the mean value and standard deviation (S.D.) have been depicted in . For all five CBCT modes the FFE reconstruction gave narrower distribution judged from the S.Ds which decreased between 9% (OBI13FS) and 49% (HQH), the effect being most notable for the partial scan modes. As can be observed in , the crescent effect giving rise to a darker and brighter region at the edge of the uniform disk in the upper left part and lower right part, respectively, influenced especially the S.D. in this measure. As opposed to the OBI with almost constant mean value, the mean value increased using the FFE reconstruction going through the CBCT modes from left to right in . For comparison, the S.Ds for the CT scans were 29% to 56% lower than the lowest CBCT (FFE of OBI13FS) and the ratio of values at the two exposures was close to ![]() in agreement with scaling of voxel noise.
in agreement with scaling of voxel noise.
Figure 3. Mean HU value and standard deviation from the distribution of values within the central slice of the uniform disk in Catphan for five CBCT modes and two CT scanners. CBCT scans underwent two different reconstructions and CT scans were performed with two different exposures.
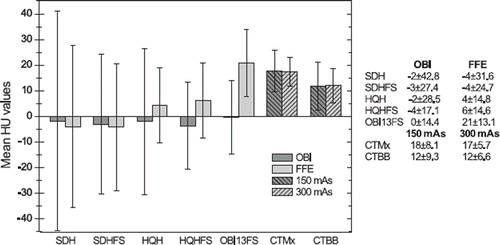
Evaluated in the homogenous region, shows that for CBCT the IN was reduced by the FFE reconstruction compared to OBI, roughly by a factor of two for the partial angle scans and an even larger reduction of a factor of four for the full scans was observed (except OBI13FS reduced with a factor of 2.5). For the FFE going from partial scan to full scan the non-uniformity was reduced by a factor of 2.5 whereas the similar improvement for OBI was half of that value. Similar trends for enhanced CBCT image quality with FFE compared to OBI is seen in for the UI, where the amount of capping was reduced from 2% to 0.5% for the partial scan modes. For the three full scan modes a change of 1.75% altered the amount of capping from more than 1% to cupping below 0.5%. The CT values for both IN and UI is not affected by the increase in exposure (which also holds for CBCT) and the uniformity in CT outperforms CBCT on both these measures.
Figure 4. (a) Integral nonuniformity (IN) and (b) uniformity index (UI) of five CBCT modes and two CT scanners. CBCT scans underwent two different reconstructions and CT scans were performed with two different exposures. Error bars correspond to +/− one standard deviation for mean values over five axial slices.
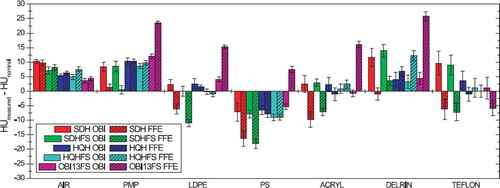
shows the difference between the mean HU values in the Catphan material inserts ordered with increasing density and the nominal HU values for the 5 CBCT modes. The vendor recommended tolerance limit for the clinical application is ± 40 HU which was met for all values. The linearity of the HU was tested by linear regression on the measured HU as a function of the nominal HU for the seven points (data not shown). For all 10 curves (five OBI and five FFE), the R-squared > 0.999 and the slopes and intercepts were in the ranges 0.997 to 1.002 and −4.4 to 12.5, respectively.
Figure 5. Difference between measured and nominal HU values in the seven inserts in Catphan 504 for five CBCT modes reconstructed with OBI and FFE. Error bars correspond to +/− one standard deviation for mean values over five axial slices.
The CNRs for each of the Catphan inserts are depicted in arranged after increasing dose for the CBCT and CT images, respectively. For each CBCT mode the CNR was higher for FFE than OBI reconstruction by on average 4–6% across the seven inserts. As the dose increases between the different CBCT modes the average CNR increase was approximately a factor of 1.4 for full scans vs. partial scans, 2.3 for HQH modes vs. SDH modes, and 1.24 for HQHFS vs. OBI13FS, respectively. Similarly, the CT CNRs scaled with ![]() as expected from the ratio of exposures. The LCV illustrated in showed the same trends with respect to variation between reconstructions and protocols, increasing by a factor of around four from SDH to OBI13FS.
as expected from the ratio of exposures. The LCV illustrated in showed the same trends with respect to variation between reconstructions and protocols, increasing by a factor of around four from SDH to OBI13FS.
Figure 6. Contrast-to-noise ratio (CNR) of the seven Catphan 504 inserts for five CBCT modes reconstructed with OBI and FFE, and two CT scanners with two different exposures. Error bars correspond to +/− one standard deviation for mean values over five axial slices.
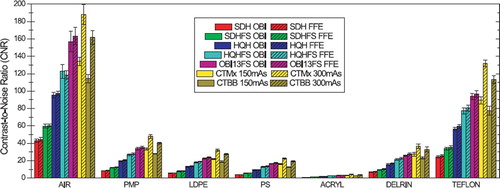
Figure 7. Low contrast visibility from Equation 4 for five CBCT modes reconstructed with OBI and FFE, and two CT scanners with two different exposures. Error bars correspond to +/- one standard deviation for mean values over five axial slices.
The results for estimation of the MTF using the edge spread function are shown in . For CBCT the difference between OBI and FFE reconstruction was more or less the same for all five modes, with FFE marginally higher in f50. The values for full scan modes in were lower than for partial scans.
Table II. MTF for five CBCT modes reconstructed with OBI and FFE, and two CT scanners with two different exposures. MTF values at 50% (f50) and 10% (f10) are shown in line pairs/cm.
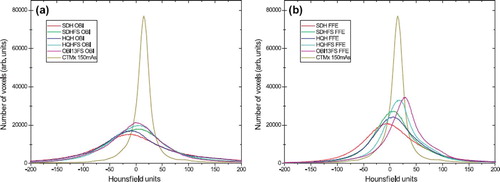
shows axial reconstructions of the central slice in the head phantom. The top and bottom rows depict OBI and FFE results, respectively, ordered after increasing exposure as in . From left to right the improvement is seen with FFE superior to OBI. The crescent artifact observed in the neck was reduced with FFE, but not removed, and the full compared to partial scan showed in general some reduction in streaking artifacts. The distribution of HU values in the scans are illustrated in . The CBCT peaks were much broader than CT as expected. Rough estimates of the full-width-half-maximum (FWHM) values for CBCT going from SDH to OBI13FS showed a reduction from 137 HU to 106 HU and from 110 HU to 58 HU for OBI and FFE, respectively, whereas the CT peak has a FWHM of 23 HU.
Figure 8. Reconstructed anthropomorphic head phantom images from (a) CT, (b)–(f) CBCT OBI, and (g)–(k) CBCT FFE (level =100 HU, window = 600 HU). From left to right the CBCT stem from SDH, SDHFS, HQH, HQHFS and OBI13FS reconstructions, respectively.
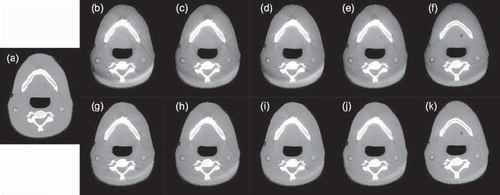
Figure 9. The distribution of HU values from −200 HU to 200 HU in CBCT of anthropomorphic head phantom for (a) OBI and (b) FFE reconstruction. CT data have been added on both for comparison.
Discussion
In this study, we have evaluated the image quality for different CBCT acquisition modes with special emphasis on application in the head and neck region, by means of direct comparison between present clinical image reconstruction and the use of an emerging algorithm with improved scatter correction. To have a common reference the results were compared to those obtained with two conventional CT scanners using our standard HN protocols. As the overall goal was to investigate the impact of CBCT-based treatment planning for adaptive radiotherapy the focus has been on parameters affecting the quantitative diagnostic image properties. The further influence on accuracy of dose calculations will be investigated in a separate study.
In our implementation of the FFE reconstruction, the conversion from raw image values to HU was performed for each acquisition mode using Catphan as used in the clinical OBI. The calibration curves depicted in shows good linear dependence. Bilinear curve fits with different HU thresholds between a low density and high density part was also investigated but judged on the concordance with the nominal HU values after FFE reconstruction a single linear relation gave the best results. Although a separate curve has been used for each of the five modes, the difference between partial and full rotation for the same exposure parameters was small as seen in , i.e. comparable to fluctuations between different calibrations for the same mode or between clockwise and counter-clockwise acquisition, so a single calibration could be applied without major effect on the HU. From CBCT scans of Catphan independent from the ones used for the HU calibration, the HU values were verified as depicted in and a good linearity to nominal values were observed.
As expected from improved beam hardening and scatter correction in the FFE CBCT reconstruction, considerable improvements in the uniformity measures depicted in and were observed compared to OBI. The CBCT results in were influenced by the crescent effect which limits a quantitative interpretation of the difference in HU distribution between the modes. This effect is present for both OBI and FFE, and it stems from the reconstruction procedure which uses one projection angle for normalization and thus is sensitive to small mechanical shifts between source and detector during rotation. In accordance with the result of Kim et al. [Citation14] for the present OBI clinical modes, we observed most crescent effect for the HQH compared to SDH. However, with FFE reconstruction this mode gained most in uniformity (almost 50% based on S.D. in ) and the crescent effect was much reduced. The latter observation was also clear from the head phantom scans depicted in . The ROIs used for both uniformity measures in were not affected by this effect. Marked better performance was observed for FFE (factors of 2–4) with noticeable advantages in the full scan protocols. Simulations have shown that full scan produce uniform angular dose distribution whereas partial scan shows larger dose along the scanning angles than for the non-irradiated angles [Citation14].
Both contrast and voxel noise are influenced by scatter [Citation15]. The ratio, CNR, showed on average a small increase of ∼5% for FFE vs. OBI in all five CBCT modes. As seen in , when the dose increased the CNR values scaled according to the square root of dose for both reconstruction methods. Calculated from values in this corresponds to factors of 1.3, 2.2 and 1.25 for full scan vs. partial scan, HQH modes vs. SDH modes, and HQHFS vs. OBI13FS, respectively. These numbers agree very well with the CNR results deduced from and with our weighted CT dose index (CTDIw) measurements for the clinical CBCT modes of 6.0, 31.8, and 86.7 mGy for SDH, HQH and OBI13FS, respectively. For comparison, the CTDIw values for the used CT protocols ranged from 8.7 mGy to 22.0 mGy, the relative higher CNR values being due to a lower noise level in CT.
From the results of the MTF in very similar values were obtained for OBI and FFE reconstructions consistently for all modes. The removal of (presumable smooth) scatter contribution in raw image projections may lead to more image noise and reduction of MTF [Citation30], but this effect was not observed. The reduction in MTF from partial scan to full scan is likely related to the fact that the full rotation is more sensitive to mechanical instabilities in the CBCT imaging system which lead to smoothing of the MTF. Finally, the lower MTF values for the CT scanners were consistent with literature [Citation31] and depend to a high degree on imaging protocol applied.
All CBCT results presented here have been measured on the imaging system of a single linear accelerator. It is important to notice that image quality parameters can vary considerable between different units, even from the same vendor [Citation27], depending on calibration status, detector properties, mechanical stability etc. Also, the image analysis was performed for reconstruction parameters used in the daily clinical practice. Change in matrix size and slice thickness were tested. Mean values were unchanged within the uncertainty for constant ROI size whereas the noise or standard deviation scaled with the square-root of the voxel size in all three dimensions [Citation15]. Changes in the superior-inferior FOV can have large impact on measures evaluated here as the CBCT image quality improves considerably if x-ray field size is reduced [Citation27]. However, this seems not to be a feasible option for CBCT-based adaptive RT in the HN region due to the, in general, large treatment size.
The FFE reconstruction investigated in this study clearly brings the CBCT image quality closer to CT standard and as the scatter correction algorithm is still the subject of future optimization [Citation24] further improvement could be obtained. Most notably for the full scan versions of the present clinical protocols, the image properties found for FFE compared to OBI with respect to uniformity (and contrast to a lesser degree) indicates a potential for dedicated imaging protocols suited for adaptive radiotherapy.
In conclusion, we have evaluated the image quality of different CBCT acquisition modes for the HN region. Judged on parameters affecting the common diagnostic image properties, improved beam hardening and scatter correction diminishes the difference between CBCT and CT image quality considerably. In the pursuit of CBCT-based treatment adaptation, dedicated imaging protocols may prove advantageous, e.g. partial-angle vs. full-angle scan protocols. The implications for CBCT-based dose calculation are under investigation.
Acknowledgement
Supported by CIRRO – The Lundbeck Foundation Center for Interventional Research in Radiation Oncology, the Danish Council for Strategic Research, the Danish Cancer Society, and a research grant from Varian Medical Systems, Palo Alto, CA, USA.
Declaration of interest: The authors report no conflicts of interest. The authors alone are responsible for the content and writing of the paper.
References
- Jaffray DA, Siewerdsen JH, Wong JW, Martinez AA. Flat-panel cone-beam computed tomography for image-guided radiation therapy. Int J Radiat Oncol Biol Phys 2002;53:1337–49.
- Oldham M, Letourneau D, Watt L, Hugo G, Yan D, Lockman D, . Cone-beam-CT guided radiation therapy: A model for on-line application. Radiother Oncol 2005;75:271–8.
- Dawson LA, Jaffray DA. Advances in image-guided radiation therapy. J Clin Oncol 2007;25:938–46.
- Nijkamp J, de Jong R, Sonke JJ, Remeijer P, van Vliet C, Marijnen C. Target volume shape variation during hypo-fractionated preoperative irradiation of rectal cancer patients. Radiother Oncol 2009;92:202–9.
- van Kranen S, van Beek S, Mencarelli A, Rasch C, van Herk M, Sonke JJ. Correction strategies to manage deformations in head-and-neck radiotherapy. Radiother Oncol 2010;94: 199–205.
- Hatton JA, Greer PB, Tang C, Wright P, Capp A, Gupta S, . Does the planning dose-volume histogram represent treatment doses in image-guided prostate radiation therapy? Assessment with cone-beam computerised tomography scans. Radiother Oncol 2011;98:162–8.
- Wang J, Bai S, Chen N, Xu F, Jiang X, Li Y, . The clinical feasibility and effect of online cone beam computer tomography-guided intensity-modulated radiotherapy for nasopharyngeal cancer. Radiother Oncol 2009;90:221–7.
- Wang W, Wu Q, Yan D. Quantitative evaluation of cone-beam computed tomography in target volume definition for offline image-guided radiation therapy of prostate cancer. Radiother Oncol 2010;94:71–5.
- Wright P, Muren LP, Hoyer M, Malinen E. Evaluation of adaptive radiotherapy of bladder cancer by image-based tumour control probability modelling. Acta Oncol 2010;49:1045–51.
- Vestergaard A, Søndergaard J, Petersen JB, Hoyer M, Muren LP. A comparison of three different adaptive strategies in image-guided radiotherapy of bladder cancer. Acta Oncol 2010;49:1069–76.
- Knap MM, Hoffmann L, Nordsmark M, Vestergaard A. Daily cone-beam computed tomography used to determine tumour shrinkage and localisation in lung cancer patients. Acta Oncol 2010;49:1077–84.
- Søvik A, Rødal J, Skogmo HK, Lervag C, Eilertsen K, Malinen E. Adaptive radiotherapy based on contrast enhanced cone beam CT imaging. Acta Oncol 2010;49: 972–7.
- Elstrøm UV, Wysocka BA, Muren LP, Petersen JBB, Grau C. Daily kV cone-beam CT and deformable image registration as a method for studying dosimetric consequences of anatomic changes in adaptive IMRT of head and neck cancer. Acta Oncol 2010;49:1101–8.
- Kim S, Yoo S, Yin FF, Samei E, Yoshizumi T. Kilovoltage cone-beam CT: Comparative dose and image quality evaluations in partial and full-angle scan protocols. Med Phys 2010;37:3648–59.
- Siewerdsen JH, Jaffray DA. Cone-beam computed tomography with a flat-panel imager: Magnitude and effects of x-ray scatter. Med Phys 2001;28:220–31.
- Yoo S, Yin FF. Dosimetric feasibility of cone-beam CT-based treatment planning compared to CT-based treatment planning. Int J Radiat Oncol Biol Phys 2006;66:1553–61.
- Ding GX, Duggan DM, Coffey CW, Deeley M, Hallahan DE, Cmelak A, . A study on adaptive IMRT treatment planning using kV cone-beam CT. Radiother Oncol 2007; 85:116–25.
- Yang Y, Schreibmann E, Li T, Wang C, Xing L. Evaluation of on-board kV cone beam CT (CBCT)-based dose calculation. Phys Med Biol 2007;52:685–705.
- Guan H, Dong H. Dose calculation accuracy using cone-beam CT (CBCT) for pelvic adaptive radiotherapy. Phys Med Biol 2009;54:6239–50.
- Hatton J, McCurdy B, Greer PB. Cone beam computerized tomography: The effect of calibration of the Hounsfield unit number to electron density on dose calculation accuracy for adaptive radiation therapy. Phys Med Biol 2009;54: N329–N346.
- Barker JL Jr, Garden AS, Ang KK, O'Daniel JC, Wang H, Court LE, . Quantification of volumetric and geometric changes occurring during fractionated radiotherapy for head-and-neck cancer using an integrated CT/linear accelerator system. Int J Radiat Oncol Biol Phys 2004; 59:960–70.
- Hansen EK, Bucci MK, Quivey JM, Weinberg V, Xia P. Repeat CT imaging and replanning during the course of IMRT for head-and-neck cancer. Int J Radiat Oncol Biol Phys 2006;64:355–62.
- Wu Q, Chi Y, Chen PY, Krauss DJ, Yan D, Martinez A. Adaptive replanning strategies accounting for shrinkage in head and neck IMRT. Int J Radiat Oncol Biol Phys 2009;75: 924–32.
- Sun M, Star-Lack JM. Improved scatter correction using adaptive scatter kernel superposition. Phys Med Biol 2010;55: 6695–720.
- Stock M, Pasler M, Birkfellner W, Homolka P, Poetter R, Georg D. Image quality and stability of image-guided radiotherapy (IGRT) devices: A comparative study. Radiother Oncol 2009;93:1–7.
- Yoo S, Kim GY, Hammoud R, Elder E, Pawlicki T, Guan H, . A quality assurance program for the on-board imagers. Med Phys 2006;33:4431–47.
- Bissonnette JP, Moseley DJ, Jaffray DA. A quality assurance program for image quality of cone-beam CT guidance in radiation therapy. Med Phys 2008;35: 1807–15.
- Star-Lack J, Sun M, Kaestner A, Hassanein R, Virshup G, Berkus T, . Efficient scatter correction using asymmetric kernels. Proc SPIE 2009;7258:72581Z.
- Grimmer R, Krause J, Karolczak M, Lapp R, Kachelriess M. Assessment of spatial resolution in CT. Nuclear Science Symposium Conference Record, 2008 NSS ‘08 IEEE 2008; 5562–6.
- Zhu L, Wang J, Xing L. Noise suppression in scatter correction for cone-beam CT. Med Phys 2009;36:741–52.
- McCann C, Alasti H. Comparative evaluation of image quality from three CT simulation scanners. J Appl Clin Med Phys 2004;5:55–70.