Abstract
Background. Cancer stem cells are believed to be more radiation resistant than differentiated tumour cells of the same origin. It is not known, however, whether normal nontransformed adult stem cells share the same radioresistance as their cancerous counterpart. Material and methods. Nontumourigenic (TERT4) and tumourigenic (TRET20) cell lines, from an immortalised mesenchymal stem cell line, were grown in culture prior to irradiation and gene expression analysis. Radiation resistance was measured using a clonogenic assay. Differences in gene expression between the two cell lines, both under nontreated and irradiated conditions, were assessed with microarrays (Affymetrix Human Exon 1.0 ST array). The cellular functions affected by the altered gene expressions were assessed through gene pathway mapping (Ingenuity Pathway Analysis). Results. Based on the clonogenic assay the nontumourigenic cell line was found to be more sensitive to radiation than the tumourigenic cell line. Using the exon chips, 297 genes were found altered between untreated samples of the cell lines whereas only 16 genes responded to radiation treatment. Among the genes with altered expression between the untreated samples were PLAU, PLAUR, TIMP3, MMP1 and LOX. The pathway analysis based on the alteration between the untreated samples indicated cancer and connective tissue disorders. Conclusion. This study has shown possible common genetic events linking tumourigenicity and radiation response. The PLAU and PLAUR genes are involved in apoptosis evasion while the genes TIMP3, MMP1 and LOX are involved in regulation of the surrounding matrix. The first group may contribute to the difference in radiation resistance observed and the latter could be a major contributor to the tumourigenic capabilities by degrading the intercellular matrix. These results also indicate that cancer stem cells are more radiation resistant than stem cells of the same origin.
The cancer stem cell (CSC) theory assumes that cancer arises from the malignant transformation of either adult stem cells or their immediate progenies. Recent studies have also shown that cells isolated from human tumours that were positive for stem cell markers were more radiation resistant than tumour cells without the markers [Citation1–3]. In addition, increased resistance to chemotherapy has been reported for CSC marker positive tumour cells [Citation4,Citation5]. Therefore, the presence of CSC and their response to anti-cancer treatment, especially radiotherapy, may be detrimental for the final clinical outcome.
It is not known, however, whether normal nontransformed adult stem cells share the same radioresistance as their cancerous counterparts. The currently believed theory is that CSCs retain several characteristics from their stem cell origin, such as enhanced damage repair and slow division rate, and that these stem cell characteristics are the main cause for the observed radiation resistance phenotype.
To study this issue one needs a model in which both the normal stem cells and CSC are derived from the same source. Such a model is the human mesenchymal stem cell, which after immortalisation with retroviral inserted telomerase and passaged over a long time period in cell culture, obtained carcinogenic properties [Citation6,Citation7]. The only external factor that differed between the tumourigenic and nontumourigenic cell lines was the different split ratios of this prolonged passage. The model is well characterised and multiple samples have been frozen at different stages of development, thereby making it possible to pinpoint some of the events that occur on the path away from normality.
In the current study, cells from late passages of both the tumourigenic and nontumourigenic cell lines were compared for their growth characteristics and radiation sensitivity. In addition, they were subjected to gene expression analysis before and after irradiation, to investigate whether there are possible common genetic events that link tumourigenicity with radiation response.
Material and methods
The human mesenchymal cell lines hMSC-TERT4 (TERT4) and hMSC-TERT20 (TERT20) were used and are described in detail elsewhere [Citation6,Citation7]. All cell lines were passaged in MEM media containing 10% foetal calf serum, 1% nonessential amino acid, 1% penicillin-streptomycin and 1% sodium pyruvate, and incubated in a 5% CO2 atmosphere at 37°C. The population doubling levels of the cell lines used in the experiments were 301 for TERT4 and 317 for TERT20. The growth rates were assessed by seeding 10*5 cells into T25 flasks and counting three flasks daily in a Bûrker-Tûrk counting chamber, from which the doubling time was calculated.
Radiation sensitivity was determined with an in vitro clonogenic surviving fraction (SF) assay, which has been previously described in detail [Citation8]. Briefly, varying concentrations of cells were seeded in culture flasks and exponentially growing cells were irradiated with single doses of 1–8 Gy at a dose rate of 0.58 Gy/min using a 230 kV x-ray machine (Phillips, Holland) at 23°C. Two weeks later the colonies in the flasks were stained with methylene blue and counted under a stereo microscope. Experiments were performed in triplicate and the SF at each radiation dose was calculated using the formula (SF = colonies counted/(cells seeded*PE), where PE is the counted colonies divided by the number of cells seeded for the 0 Gy flasks. Alpha and beta values for the SF curves were estimated by nonlinear regression and subsequently plotted (SF = exp(Dose*alpha-Dose*Dose*beta)). Statistical analysis was done in Stata 10 (StataCorp) and visualised by Sigmaplot (Systat Software Inc.). A two sided Student's t-test was used to test for significant differences.
Samples for the Affymetrix Human Exon 1.0 ST array chip analysis (Aros Applied Biosystem A/S, Denmark) were purified (miRNeasy Mini kit, Qiagen) from 106 cells four hours after irradiation with either 0 Gy or 2 Gy. Normalisation was performed using Expression Console (Affymetrix, USA) with the RMA gene core algorithm. Genes with linearised expression values above a background threshold of 40 and with at least a two-fold or more difference between control and treated samples were further analysed with the Ingenuity Pathway Analysis (IPA) (Ingenuity Systems, www.ingenuity.com), which displayed the gene networks and biological function. Clustering analysis of gene expression levels was done with Gene Cluster 2.11 (Michael Eisen, rana.lbl.gov/EisenSoftware.htm) using Pearson's correlation and complete linkage and Java Treeview (ver. 1.1.3) for visualisation of the heat map.
Validation of gene expression was done with quantitative Real-Time PCR (q-RT-PCR) on a 7900HT Fast RealTime PCR machine (Applied Biosystem, Europe) using TaqMAN probes as indicated in (Applied Biosystem, Europe). The CHCHD1 probe (Hs00415054_m1) was included as a control. A Student's t-test with a significance level of 0.05 between the different treated samples was used to estimate the likelihood of a true difference.
Table I. Gene expression levels in TERT4 and TERT20.
Table II. Gene interaction networks.
Table III. Genes verified by q-RT-PCR.
Results
The growth rates () showed that TERT4 was slower growing that TER20 and this was supported by the cell line's rate of cell population doubling (0.8 days for TERT20 and 1.3 days for TERT4). The plating efficiencies for the two lines were found to be 0.292 (TERT4) and 0.395 (TERT20), and although the TERT20 had a higher value the difference was not significant.
Figure 1. Growth and SF curves for the TERT4 (●) and TERT20 (○) cell lines. A. Curves show the growth of the cell lines in vitro as a function of time after seeding the cells in T25 flasks. The lines were fitted by eye. B. SF for the cell lines measured 14 days after irradiating the cells in culture. The lines through the data are the linear-quadratic curves based on the alpha and beta values. For both the growth and SF data the points show means (± 1 S.E.) for a minimum of three values.
The response of both cell lines to radiation is shown in . TERT20 had a consistently higher SF value than TERT4 at all dose levels, with this difference becoming significant at 2 Gy and above. The regression estimation showed nearly similar beta values (0.038 for TERT4 and 0.034 for TERT20), while the estimated alpha values showed a larger difference (0.59 for TERT4 and 0.42 for TERT20). The alpha/beta ratio for the cell lines was 15.5 and 12.4 for TERT4 and TERT20, respectively.
In total we found 313 genes with altered expression between TERT4 and TERT20 ( and ). To obtain an overview of these genes, we sorted them into untreated cell line specific and radiation responsive genes. For 297 genes, the gene expression for control and irradiated cells in both cell lines did not differ, but there was a difference between results for the TERT4 and TERT20 cell lines. With 13 genes, no difference was found between the controls for TERT4 and TERT20, nor between the irradiated samples for both cell lines, but for each cell line the irradiated samples were different from the control values. Finally, three genes (GDF15, DYNLL1 and SLC14A1) displayed a difference between treated and nontreated for both cell lines and for values between the cell lines.
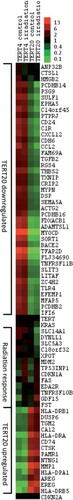
Figure 2. Heat map of those genes showing more than a five-fold altered regulation of expression levels, measured using the Affymetrix Human Exon array chip. Clustering analysis was achieved with Gene Cluster 2.11 using Pearson's correlation and complete linkage and visualised with Java Treeview. Hierarchical clustering of the data with median centred genes and complete linkage; red is up-regulated and green is down-regulated compared to the mean of the individual gene's expression levels. The genes TERT, CDKN2A and K-RAS were included as controls with known expression patterns.
Using an Ingenuity Pathway Analysis of biological function we found a high possibility for cancer to be the main disorder induced by the altered gene expressions. Ordering the genes into pathway networks, as seen in , we found that the top five networks implicated genes in tumour morphology and cell death; cellular and connective tissue development, organisation and assembly; dermatological, immunological, and inflammatory disease; cellular and tissue development and function; and cancer.
To strengthen the findings from the array and gene interaction network assays, gene level verification was done with q-RT-PCR ( and ). A total of 16 RNA samples from two separate experiments were used; eight from each cell line (four controls and four irradiated). The difference in mRNA levels of the selected central genes involved in the two top networks in was verified by q-RT-PCR. We also verified the altered expression of CD24 and CD44, and the radiation responsive genes MDM2, CDKN1A and GDF15. TERT was included as a positive control and similar levels were found in both cell lines. CDKN2A was used as a negative control since the cell lines share a deletion in the gene CDKN2A, which results in no transcription. The q-RT-PCR assay failed to detect any CDKN2A mRNA in any of the 16 samples.
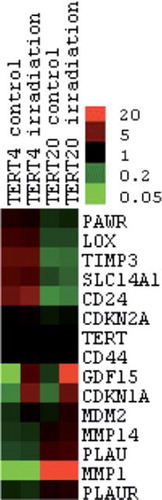
Figure 3. Heat map of the genes verified by q-RT-PCR. Clustering analysis was achieved with Gene Cluster 2.11 using Pearson's correlation and complete linkage and visualised with Java Treeview. Hierarchical clustering of the data with median centred genes and complete linkage; red is up-regulated and green is down-regulated compared to the mean of the individual gene's expression levels. The genes TERT and CDKN2A were included as controls with known expression patterns.
Discussion
In this pre-clinical study we did a comparison between a nontumourigenic (TERT4) and tumourigenic (TERT20) cell lines that were originally derived from the same immortalised mesenchymal stem cell line. We found that the TERT4 grew significantly slower than the TERT20, but was more sensitive to the cell killing effect of radiation. The two cell lines also displayed differences in the expression of a variety of genes involved in a number of biological functions.
Our finding that TERT20 was more resistant to radiation than TERT4 implies that when applying radiation therapy the normal stem cells would be more susceptible to radiation damage than the tumour stem cells. The significant difference in radiation sensitivity between the two cell lines was seen at a radiation dose as low as 2 Gy, which is typically the standard daily dose given in a conventional fractionation schedule. Thus, our findings are totally applicable to the clinical situation. The best cellular markers for CSC are generally considered to be CD133 that was particularly positive in gliomas [Citation1,Citation9] and the combination of CD44 + /CD24 − for breast cancer [Citation10]. Our gene expression analysis in TERT20 indicates a CD44 + /CD24 − status, whereas TERT4 expressed both CD44 and CD24 mRNA, confirming CSC phenotype for TERT20, but not TERT4. Both clones showed a lack of PROM1 gene expression, which is the gene encoding the CD133 surface marker. This was expected since the model is based on mesenchymal stem cells and CD133 is associated with endothelial, gliomas and haematopoietic stem cells. Even if the founder cell line did express CD133, then this would likely be lost due to the long time period that the cells were kept in culture, since this is known to promote the loss of the CD133 marker [Citation11].
Analysis of the microarrays data showed that the genes listed in the first Ingenuity network () centre on PAWR, PLAU and PLAUR, all of which influence the cellular apoptotic pathways. The RNA levels of these three genes were verified by q-RT-PCR on a large number of samples. In our study, PAWR was down-regulated, while PLAU and PLAUR were up-regulated in TERT20. PAWR is a tumour suppressor gene encoding a protein that selectively induces apoptosis in cancer cells [Citation12]. The PLAU and PLAUR genes encode proteins that are part of the plasminogen activation system [Citation13] which interact with the Akt protein kinase involved in apoptosis [Citation14]. Their normal function involves extracellular matrix degradation and tissue remodelling, and reports have implicated an up-regulation in tumour cells showing increased tumour migration, proliferation and metastases [Citation15]. Thus, TERT20 could evade the apoptotic signals from the Akt pathway by up-regulating PLAU and PLAUR and by a reduced expression of the tumour suppressor PAWR.
The second Ingenuity network listed in consists of genes coding for components of the connective tissue and basal membrane, such as ELN, DCN, NID1 and several collagen variants. All were found to be down-regulated in TERT20. The genes MMP1, MMP14, LOX and TIMP3 all affect the balance between creating and degrading connective tissue. The RNA levels of these four genes were also verified by q-RT-PCR. TIMP3 normally inhibits MMP1 and MMP14 degradation of the connective tissue [Citation16], but in TERT20 TIMP3 is down-regulated and MMP1 and MMP14 are up-regulated. MMP1 facilities tumour growth through the extracellular matrix and is seen as a tumour-derived growth factor [Citation17]. It is derived from the surrounding tissue/fibroblasts and can alter the tumour microenvironment in favour of cancer cell migration and invasion through PAR1 cleavage [Citation18]. The gene cluster containing MMP1 is indicated as important for cancer development and progression [Citation19]. We also found that LOX, which establishes cross-linking between the components of the connective tissue [Citation20] was down-regulated in TERT20. This is in line with the observation of PLAU and PLAUR up-regulation and indicates that TERT20, contrary to TERT 4, actively disrupts connective tissue rather that creating it.
HLA class II genes dominate the third network and all are up-regulated in TERT20. These genes play an important role in the immune system [Citation21]. HLA-DP and HLA-DR display the antigens to T-cells. Both have alpha and beta subunits, the levels of which were increased. HLA-DM is a chaperon encoding gene that helps with antigen presentation. Several other genes implicated in cellular immune response were up-regulated in TERT20. This includes CD74, HMGA2 and TGFB2, all of which interact with the HLA class II genes. These effects on immune related genes were only seen in TERT20, even though both cell lines were handled in parallel. This may be linked to the tumourigenic process of TERT20, since some tumours have previously shown an increase in expression of HLA II genes [Citation22].
The fourth network implicates cell morphology, and connective tissue development and function. The most important genes encode for heat shock proteins, caspases, and proteins involved in cell cycle regulation. Lastly, the fifth network consists of genes implicated in cell death, hair and skin development, and cancer. Here the most critical genes involve several integrins and genes related to the regulation of ERK1 / ERK2, although the expression of these latter genes was not affected.
Overall, the Ingenuity pathway analysis indicated that the most likely biological function of those genes that were altered in TERT20 play a role in cancer development; the genes expressed in TERT20 seem more involved in disassembling the basal membrane and connective tissue and less implicated in pathways leading to cell death. Other networks lower on the Ingenuity pathway analysis list also had functions which implicated cancer, tissue morphology or mesenchymal disorders.
In response to radiation treatment with 2 Gy the expression of some 16 genes was altered. CDKN1A, EDA2R, FAS, MDM2, TP53INP1 and TNFRSF10B were up-regulated in both cell lines and all these genes are implicated in either cell cycle inhibition or apoptosis induction [Citation23–27]. An altered RNA level of the two most radiation responsive genes, CDKN1A and MDM2, was verified by Q-RT-PCR. The FST gene was also up-regulated, but this gene does not seem to be involved in either apoptosis or DNA damage pathways. C18orf32 and XPOT were down-regulated in both cell lines after irradiation. All the above listed had the same starting level in TERT4 and TERT20. However, GDF15 is clonally different since the levels in TERT20 were higher than that in TERT4, both before and after irradiation. But GDF15 was up-regulated in both cell lines following irradiation. This pattern was also seen in the q-RT-PCR verification. GDF15 is implicated as a tumour suppressor gene, but has also been reported to be involved in metastasis and tumour proliferation [Citation28]. The up-regulation in TERT20 can partly explain its phenotype if GDF15 functions as a proliferation inducer. The remaining genes only showed a response to treatment in one of the cell lines. SLC5A3 was down-regulated after irradiation in TERT20 only, while CTSL1, ANP32B, and HMGB2 had reduced levels of expression in TERT4 after irradiation. For these three genes the level before irradiation was high and following the radiation treatment was reduced to a level that was similar to that seen in TERT20, regardless of whether the TERT20 were irradiated or not. None of this latter group of genes seem directly implicated in DNA damage or apoptosis.
Among the genes with the greatest differential expression between TERT4 and TERT20 we found that SORT1 was some 20-fold lower in TERT20 compared to TERT4. Since SORT1 is involved in differentiation of mesenchymal stem cells to osteogenic cells and mineralisation [Citation29], then the higher levels in TERT4 could indicate that this TERT4 cell line is being primed for differentiation; the original cell line from which these TERT4 and TERT20 cell lines originated is still in use as a bone formation model and TERT4 seems to have retained the potential to differentiate into osteoblasts.
Conclusion
This study showed that the tumourigenic mesenchymal stem cell line TERT20 has a greater resistance to radiation treatment than the nontumourigenic TERT 4 cell line. Such a finding is consistent with the current theory of enhanced radiation resistance of CSC over normal cells of the same origin. Whether this phenomenon is true for all types of CSC is not known. Our investigation of the tumourigenic TERT20 and nontumourigenic TERT4 cell lines revealed differences in the gene expression that implicate down-regulation of apoptosis and disruption of connective tissue and cellular development. None of the induced gene expression differences fully explain the difference in radiation resistance between the two cell lines, suggesting that there may be an indirect influence from several events related to tumourigenesis that play a role in the observed radiation resistance.
Acknowledgements
The authors would like to thank Ms. Kirsten Hillebrandt, Ms. Inger Marie Thuesen, and Ms. Alice Baden for excellent technical help, and Dr. Jan Alsner for help with the data analysis. Financial support was received from the Danish Cancer Society, the Danish Medical Research Council, CIRRO – The Lundbeck Foundation Centre for Interventional Research in Radiation Oncology & the Danish Council for Strategic Research, and the A.P. Møller Foundation for the Advancement of Medical Science.
Declaration of interest: The authors report no conflicts of interest. The authors alone are responsible for the content and writing of the paper.
References
- Bao S, Wu Q, McLendon RE, Hao Y, Shi Q, Hjelmeland AB, . Glioma stem cells promote radioresistance by preferential activation of the DNA damage response. Nature 2006;444:756–60.
- Phillips TM, McBride WH, Pajonk F. The response of CD24-/low/CD44 + breast cancer-initiating cells to radiation. J Natl Cancer Inst 2006;98:1777–85.
- Rich JN. Cancer stem cells in radiation resistance. Cancer Res 2007;67:8980.
- Hirschmann-Jax C, Foster AE, Wulf GG, Nuchtern JG, Jax TW, Gobel U, . A distinct “side population” of cells with high drug efflux capacity in human tumor cells. Proc Natl Acad Sci USA 2004;101:14228–33.
- Dean M, Fojo T, Bates S. Tumour stem cells and drug resistance. Nat Rev Cancer 2005;5:275–84.
- Serakinci N, Guldberg P, Burns JS, Abdallah B, Schrodder H, Jensen T, . Adult human mesenchymal stem cell as a target for neoplastic transformation. Oncogene 2004;23:5095–8.
- Simonsen JL, Rosada C, Serakinci N, Justesen J, Stenderup K, Rattan SI, . Telomerase expression extends the proliferative life-span and maintains the osteogenic potential of human bone marrow stromal cells. Nat Biotechnol 2002;20:592–6.
- D'Andrea FP, Safwat A, Kassem M, Gautier L, Overgaard J, Horsman MR. Cancer stem cell overexpression of nicotinamide N-methyltransferase enhances cellular radiation resistance. Radiother Oncol 2011;99:373–8.
- Hemmati HD, Nakano I, Lazareff JA, Masterman-Smith M, Geschwind DH, Bronner-Fraser M, . Cancerous stem cells can arise from pediatric brain tumors. Proc Natl Acad Sci 2003;100:15178–83.
- Al-Hajj M, Wicha MS, Benito-Hernandez A, Morrison SJ, Clarke MF. Prospective identification of tumorigenic breast cancer cells. Proc Natl Acad Sci 2003;100:3983–8.
- Strauss R, Li Z-Y, Liu Y, Beyer I, Persson J, Sova P, . Analysis of epithelial and mesenchymal markers in ovarian cancer reveals phenotypic heterogeneity and plasticity. PLoS ONE 2011;6.
- El-Guendy N, Zhao Y, Gurumurthy S, Burikhanov R, Rangnekar VM. Identification of a unique core domain of Par-4 sufficient for selective apoptosis induction in cancer cells. Mol Cell Biol 2003;23:5516–25.
- Montuori N, Carriero MV, Salzano S, Rossi G, Ragno P. The cleavage of the urokinase receptor regulates its multiple functions. J Biol Chem 2002;277:46932–9.
- Gondi CS, Kandhukuri N, Dinh DH, Gujrati M, Rao JS. Downregulation of uPAR and uPA activates caspase mediated apoptosis, inhibits the PI3k/AKT pathway. Int J Oncol 2007;31:19.
- Sidenius N, Blasi F. The urokinase plasminogen activator system in cancer: Recent advances and implication for prognosis and therapy. Cancer Metastasis Rev 2003;22:205–22.
- Sternlicht MD, Werb Z. How matrix metalloproteinases regulate cell behavior. Annu Rev Cell Dev Biol 2001;17:463.
- Hotary KB, Allen ED, Brooks PC, Datta NS, Long MW, Weiss SJ. Membrane type I matrix metalloproteinase usurps tumor growth control imposed by the three-dimensional extracellular matrix. Cell 2003;114:33–45.
- Boire A, Covic L, Agarwal A, Jacques S, Sherifi S, Kuliopulos A. PAR1 is a matrix metalloprotease-1 receptor that promotes invasion and tumorigenesis of breast cancer cells. Cell 2005;120:303–13.
- Sun T, Gao Y, Tan W, Ma S, Zhang X, Wang Y, . Haplotypes in matrix metalloproteinase gene cluster on chromosome 11q22 contribute to the risk of lung cancer development and progression. Clin Cancer Res 2006;12:7009–17.
- Bouez C, Reynaud C, Noblesse E, Thépot A, Gleyzal C, Kanitakis J, . The Lysyl oxidase LOX is absent in basal and squamous cell carcinomas and its knockdown induces an invading phenotype in a skin equivalent model. Clin Cancer Res 2006;12:1463–9.
- Villadangos JA. Presentation of antigens by MHC class II molecules: Getting the most out of them. Mol Immunol 2001;38:329–46.
- Glew SS, Duggan-Keen M, Cabrera T, Stern PL. HLA class II antigen expression in human papillomavirus-associated cervical cancer. Cancer Res 1992;52:4009–16.
- El-Deiry WS, Tokino T, Velculescu VE, Levy DB, Parsons R, Trent JM, . WAF1, a potential mediator of p53 tumor suppression. Cell 1993;75:817–25.
- Wajant H. The Fas signaling pathway: More than a paradigm. Science 2002;296:1635–6.
- Zhang Z, Li M, Wang H, Agrawal S, Zhang R. Antisense therapy targeting MDM2 oncogene in prostate cancer: Effects on proliferation, apoptosis, multiple gene expression, and chemotherapy. Proc Natl Acad Sci 2003;100:11636–41.
- Tomasini R, Seux M, Nowak J, Bontemps C, Carrier A, Dagorn JC, . TP53INP1 is a novel p73 target gene that induces cell cycle arrest and cell death by modulating p73 transcriptional activity. Oncogene 2005;24:8093–104.
- Wu GS, Burns TF, McDonald ER 3rd, Jiang W, Meng R, Krantz ID, . KILLER/DR5 is a DNA damage-inducible p53-regulated death receptor gene. Nat Genet 1997;17:141.
- Bauskin AR, Brown DA, Kuffner T, Johnen H, Luo XW, Hunter M, . Role of macrophage inhibitory cytokine-1 in tumorigenesis and diagnosis of cancer. Cancer Res 2006;66:4983–6.
- Maeda S, Nobukuni T, Shimo-Onoda K, Hayashi K, Yone K, Komiya S, . Sortilin is upregulated during osteoblastic differentiation of mesenchymal stem cells and promotes extracellular matrix mineralization. J Cell Physiol 2002;193:73–9.