Abstract
Purpose. To study soft tissue sarcomas using dynamic positron emission tomography (PET) with the glucose analog tracer [18F]fluoro-2-deoxy-D-glucose (18FDG), to investigate correlations between derived PET image parameters and clinical characteristics, and to discuss implications of dynamic PET acquisition (D-PET). Material and methods. D-PET images of 11 patients with soft tissue sarcomas were analyzed voxel-by-voxel using a compartment tracer kinetic model providing estimates of transfer rates between the vascular, non-metabolized, and metabolized compartments. Furthermore, standard uptake values (SUVs) in the early (2 min p.i.; SUVE) and late (45 min p.i.; SUVL) phases of the PET acquisition were obtained. The derived transfer rates K1, k2 and k3, along with the metabolic rate of 18FDG (MRFDG) and the vascular fraction νp, was fused with the computed tomography (CT) images for visual interpretation. Correlations between D-PET imaging parameters and clinical parameters, i.e. tumor size, grade and clinical status, were calculated with a significance level of 0.05. Results. The temporal uptake pattern of 18FDG in the tumor varied considerably from patient to patient. SUVE peak was higher than SUVL peak for four patients. The images of the rate constants showed a systematic pattern, often with elevated intensity in the tumors compared to surrounding tissue. Significant correlations were found between SUVE/L and some of the rate parameters. Conclusions. Dynamic 18FDG-PET may provide additional valuable information on soft tissue sarcomas not obtainable from conventional 18FDG-PET. The prognostic role of dynamic imaging should be investigated.
Sarcomas are heterogeneous tumors with a low incidence rate (˜1%) and a high number of histological subtypes (˜50). High grade soft tissue sarcomas may be treated with surgery, chemotherapy, and radiotherapy [Citation1]. Due to the heterogeneity of sarcomas it is desirable to identify physiological attributes such as vasculature and metabolism describing tumor biology and malignancy potential.
[18F]fluoro-2-deoxy-D-glucose positron emission tomography (18FDG PET) may visualize the abnormal glycolytic metabolism of cancer cells non- invasively. There is an ongoing evaluation of the use of PET images to predict and evaluate therapeutic response for personalized treatment of sarcoma [Citation2,Citation3]. However, the lack of standardization of research studies limits available cases and the role of 18FDG PET in diagnosis and staging of sarcomas is still unclear [Citation4].
Conventional, static 18FDG PET gives a single snapshot image typically acquired one hour after injection. This PET image mostly reflects metabolism. However, the 18FDG concentration in tissue depends on the vascular supply, and residual, free (non-metabolized) 18FDG in the blood and tissue is also of importance. Dynamic PET (D-PET) can be used to compensate for these confounding effects by analyzing a complete sequence of images acquired from the time of 18FDG injection. Furthermore, surrogate maps of tissue vascularization may potentially be derived from D-PET [Citation5,Citation6]. Traditionally, images of tissue vascularization have been obtained with dynamic contrast-enhanced (DCE) imaging, either by computed tomography (CT) or magnetic resonance imaging (MRI). As solid tumors require neovascularization to maintain growth, such images may complement the metabolic information obtained from conventional 18FDG PET.
In tracer kinetic analysis of D-PET image sequences, the time-concentration characteristics are analyzed in terms of a physiological model. The model parameters may represent biological features of the tissue in question, and are thus attractive in cancer phenotyping. D-PET, together with tracer kinetic analysis, has been used to estimate tissue vascularization as well as metabolism to improve the predictions of cancer therapy response [Citation7]. It has further been proposed that altered blood flow and hypoxia may indicate regions selecting for more aggressive tumor strands and radiation resistance [Citation8]. Hence, the additional vascular information obtained may be relevant for biological image-guided radiation therapy [Citation9,Citation10]. Furthermore, in the event that both a PET scan and a DCE scan is requested, D-PET represents an alternative single examination producing both vascular and metabolic information. D-PET may thus save the patient from one examination and the injection of contrast agent, reducing the risk of contrast-induced nephropathy.
In the present study, image parameters from 18FDG D-PET scans of 11 patients with high grade soft tissue sarcoma were evaluated. A two-compartment model was utilized to calculate pharmacokinetic parameters as measures of vasculature and tumor cell metabolism [Citation11–13]. Parameter maps were calculated, uptake dynamics were described, and correlations between PET derived parameters and clinical characteristics were investigated.
Material and methods
Patients
The study comprised 11 patients with high grade (III or IV) soft tissue sarcomas (). Five patients had tumors in the torso, four had tumors in the legs and two had tumors in the hip region. The women had a median age of 76 years (range 42–81 years) and median weight 80 kg (range 62–124 kg). The men had a median age of 53 years (range 37–66 years) and a median weight of 84 kg (range 65–95 kg). Seven patients underwent surgery with post operative radiation therapy and four of the patients received definitive radiotherapy with a total dose of 60 Gy in 30 fractions. The PET imaging (see below) was performed prior to treatment and did not change the clinical management. Written informed consent was obtained from all patients and the study was approved by the regional committee for research ethics.
Table I. Patient cohort.
PET/CT protocol
All examinations were performed after a minimum of six hours of fasting, using a Siemens Biograph 16 PET/CT-scanner (Biograph 16, Siemens, Erlangen, Germany). The PET image acquisition was initiated directly after intravenous injection of 18FDG with a mean activity of 395 MBq (354–433 MBq). The D-PET series had a sampling time of 15 seconds the first three minutes, 30 seconds during the following eight minutes and two minutes for the remaining 34 minutes. The total scan time was 45 minutes. Images were reconstructed by OSEM iterative technique, with four iterations, eight subsets and a Gaussian smoothing filter with FWHM of 5.5 mm. The resulting PET matrix had dimensions 128 × 128. The slice thicknesses were 2–4 mm. The corresponding CT image had 1.37 mm in-plane resolution stored as a 512 × 512 matrix and 5 mm slice thickness. The glucose levels of the patients were in the range 5.1–6.8 mmol/L, which was deemed acceptable according to a 7 mmol/L exclusion criteria [Citation14].
Pharmacokinetic analysis
The D-PET series were analyzed using custom made software in IDL 6.2 (ITT Visual Information Solutions, Boulder, USA). The temporal 18FDG uptake patterns in all voxels were fitted to a two-compartment model and pharmacokinetic parameters were calculated. Compartmental models use interconnected pools of tracer to describe kinetics of an underlying process. The pools are mathematical constructs representing a particular form of the tracer with equivalent kinetics. The methodology is used in several settings and has been thoroughly described in the literature [Citation15].
The particular model used in the current work makes some fundamental assumptions to reduce the complexity and enables us to capture the basic kinetics. 18FDG is assumed to be evenly distributed in the blood with negligible concentration changes in the arterial – venous direction. 18FDG binding to red blood cells and other proteins are assumed to be fast. Blood vessel size/permeability is assumed to be large, making 18FDG transport into the tissue dependent on blood flow only. Cellular membrane transport is assumed fast and no distinction between interstitial and intracellular free (non-metabolized) 18FDG is made.
Following Røe et al. [Citation13], 18FDG is assumed to be circulated by the blood until trapped within the cells during metabolism or filtered by the kidneys. The 18FDG concentration in the blood, which reflects the availability of 18FDG in the body, serves as the input into the model. This arterial input function (AIF, see below) was approximated from the whole blood 18FDG concentration given in the D-PET images. Furthermore, 18FDG is assumed to be transported from the blood into the tissue at a linear transfer rate K1 relative to the blood flow. This makes K1 a measure of capillary permeability and perfusion. Once in the tissue the non-metabolized 18FDG is either metabolized at a linear relative rate k3, or transported back into the bloodstream at a linear relative rate k2. The metabolized compartment consists of intracellular 18FDG irreversibly trapped after phosphorylation by hexokinase during glycolysis.
The sum of non-metabolized (free), metabolized (bound), and intravascular compartments was fitted by least squares optimization (Levenberg–Marquardt) to the time activity sequence in each voxel, producing estimates of the pharmacokinetic transfer rates. In addition, it was assumed that a certain fraction νp of each voxel contained blood vessels, which was estimated in the least squares optimization as a fraction of the AIF. In the least squares procedure a low pass filter, averaging the closest six neighboring voxels, was applied to the input data to reduce noise. Bootstrapping was used to estimate uncertainties in parameter estimates.
Arterial input function
The time development of the 18FDG concentration in the blood plasma, used as input in the pharmacokinetic model, is called the arterial input function (AIF). It has been shown that the time-activity plasma functions can be obtained non-invasively from images with regions of interest (ROI) defined over large vascular structures like the aorta or left ventricle [Citation16]. Although the best results are obtained from the thoracic aorta, sampling of femoral arteries may give adequate results [Citation17]. In the present work an averaged signal from a ROI defined over the aorta or femoral arteries was fitted to a tri-exponential function. A population AIF from seven patients with well-defined AIFs was used for all patients. This was done to avoid effects of the limited spatial resolution on the smaller fibular arteries in the scans of the tumors in the calves.
Output parameters
The D-PET images were normalized to injected dose and patient weight, giving a standardized uptake value (SUV) [Citation18]:
Two time points in the dynamic series were given special attention. SUVL refers to the image sampled in the interval 41–45 minutes after injection and SUVE refers to the image sampled 1.5–2.5 minutes after injection. SUVE has been shown to be an estimate for perfusion, and represents an alternative to the pharmacokinetic model parameters [Citation6]. SUVL basically reflects the image obtained from conventional, static PET.
MRFDG describes the amount of metabolized 18FDG relative to the 18FDG level in the blood, and is calculated according to [Citation12]:
Peak values were extracted for all PET images and parametric images. The peak value was obtained by identifying the most intense voxel of the tumor, and calculating the mean intensity in a 1 cm3 volume around this voxel [Citation19].
Statistics
Correlations (denoted r) between different image parameters were calculated by Pearson's correlation coefficient. The quality of the tracer kinetic curve fit was quantified with the squared Pearson's correlation coefficient between the original data and the fitted curve (r2). Clinical factors included were tumor size, grade and clinical status. Correlations between image parameters and clinical factors were calculated by Spearman's correlation coefficient.
Results
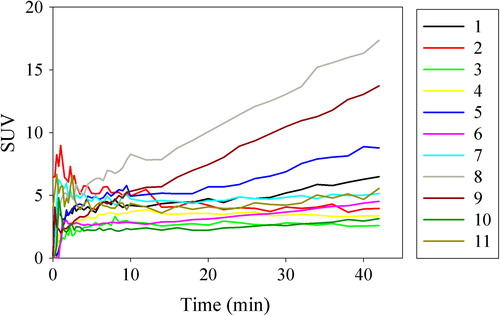
From visual inspections, the 18FDG PET images obtained from the initial acquisition phase exhibited traits different from the final 18FDG PET images in organs such as, e.g. the heart and lungs. This is clearly seen in the dynamic sequence for patient 11 (). Here, during the first 0–2 min p.i., high 18FDG uptake is primarily seen in the lung, heart and major arteries. During the next 2–10 minutes p.i. the activity in these regions decreases. In the time period 10–45 min p.i. the activity in the blood and normal tissue continues to decrease, while metabolically active regions such as the parts of the tumor show increased uptake. This development is also seen in the time-uptake curves in the tumors, where SUVpeak changes rapidly during the early acquisition phase (). Thereafter, slower uptake is found, except for patients 5, 8 and 9, where the uptake curves show no sign of saturation during the acquisition time. Interestingly, four of the tumors (patients 2, 7, 10 and 11) show higher peak 18FDG concentrations in the early acquisition phase compared to the late phase.
Figure 1. Dynamic 18FDG-PET sequence for patient 11 post injection showing the temporal evolution of the FDG activity. The tumor border is marked with a green line.
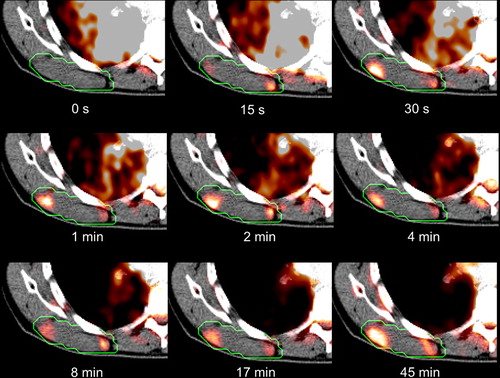
Figure 2. Time activity curves for patients 1-11 post injection showing the temporal development of the SUV peak value.
shows uptake curves in individual voxels for patient 1. Large intervoxel variations in the uptake curves are generally seen, and some intravoxel noise is also present. The tracer kinetic curve fitting gave r2 values (averaged over each tumor) ranging from 0.31–0.96. The variations in temporal uptake patterns are reflected in variations in the free/bound curve components and resulting tracer kinetic parameters. From the curve fitting, mean parameter estimates (over all patients and voxels) with mean errors were K1 = 0.20 ± 0.062, k2 = 0.44 ± 0.11, k3 = 0.028 ± 0.007, νp = 0.048 ± 0.011, and MRFDG = 0.0015 ± 0.0003.
Figure 3. Two selected voxel elements for patient 10 post injection. Data points are averaged over the voxel in question and its six closest voxels. “Free” is non-metabolized 18FDG, “bound” is metabolized 18FDG, and “vascular” is the fraction of the plasma function included in the voxel element. Estimated pharmacokinetic parameters are given.
The kinetic parameters show a systematic spatial pattern for most patients, with elevated intensity in the tumor compared to the surrounding normal tissues, as can be seen in patient 11 (). The resulting parametric maps share many of the attributes of the static images. SUVE is related to the vascular parameters such as K1 and νp while SUVL is related to the metabolic parameters such as k3 and MRFDG. Combining all patients, a cohort-based histogram of the parameter values was obtained (). Most histograms appear to have a normal to log-normal distribution. Variations are seen, however, both in the center and in the width of the distributions.
Figure 4. Parameter maps for patient 11 derived from the pharmacokinetic analysis. In addition, two static snapshot PET images obtained 2 and 45 min p.i. are shown. The tumor border is marked with a green line.
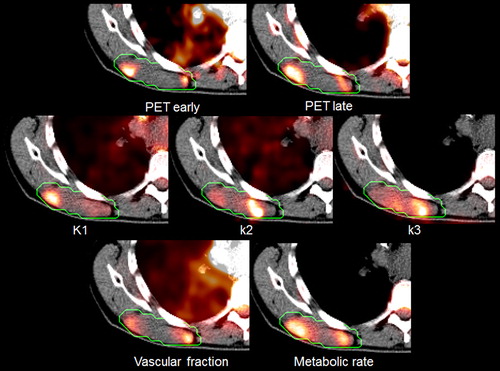
Figure 5. Patient-averaged histograms over the relevant PET-derived parameters. The dashed lines indicate one standard deviation.
Comparing the peak values of the image parameters reveal quite large variations between patients (). Significant (p < 0.05) correlations were found between the peak values of SUVL and MRFDG (r = 0.99), SUVE and νp (r = 0.90), SUVE and K1 (r = 0.79), K1 and νp (r = 0.80) and K1 and k2 (r = 0.74). SUVE and SUVL were not correlated (r = 0.06). No significant correlations were found between the PET values and clinical factors, although νp was close to being significantly correlated with clinical status (r = 0.60, p = 0.052).
Table II. Summary of PET-derived values.
Discussion
In the current work dynamic 18FDG-PET and pharmacokinetic analysis in a selection of patients with soft tissue sarcomas has been described. It appears that complementary information may be obtained both from the early and the late uptake phase as the corresponding parameters (SUVE and SUVL) were not correlated. The early phase is interesting for two reasons. First, it has the ability to describe aspects of the vasculature of the tissue. Second, the early phase has implications for the subsequent late phase which is used to describe metabolism.
Immediately after injection, 18FDG is a concentrated bolus and the initial 18FDG D-PET images thus visualize the major arteries, the heart and the lungs. In the first minutes after the bolus reaches the tumor the 18FDG diffuses from the blood vessels into the interstitial space. In this period the tissue uptake is primarily determined by blood perfusion and vascular permeability. In the subsequent metabolic phase 18FDG is gradually accumulated in metabolically active cells. The blood concentration decreases as the 18FDG is bound in the cells and filtered from the blood in the kidneys. The amount of 18FDG that is metabolized in a given region of tissue is a function of available 18FDG, the density of cells, the expression of GLUT transporters, the glycolytic enzyme hexokinase, and in normal cells; the presence of oxygen [Citation20]. The metabolic potential of the cells is also defined by their genetics. Nutrient availability can change rapidly due to blood flow changes, caused by vascular occlusion, and due to altered nutrient diffusion depths caused by tissue deformation during treatment.
Since the AIF is the basis of the pharmacokinetic analysis, errors in the function may have considerable impact on the result. This has previously been shown for pharmacokinetic analysis of DCE data [Citation21]. Furthermore, red blood cells only process glucose for energy and the whole blood will inevitably include some metabolically bound FDG. The effect however is subtle, systemic, repeatable, and aside from differences in the hematocrit should be similar in all patients. Another source of error is internal and external patient motion, resulting in displaced plasma sample points in the D-PET images. This is particularly the case for sample points taken from arteries of comparable diameter as the sampling voxels. Furthermore, the actual plasma peak in the dynamic sequences is seldom seen as more than a point, probably due to the coarse sampling time of 15 seconds.
Studies have reported the ability of static 18FDG PET to predict treatment outcome and progression of soft tissue sarcomas [Citation2,Citation3,Citation22]. Other studies have shown similar abilities for DCE- MRI [Citation23], and studies combining vascular and metabolic information have found improved predictions of patient survival [Citation24,Citation25]. However; to our knowledge no conclusive standardization of parameter selection has been established. Very few studies of relevance to the current work have addressed pharmacokinetic curve analysis from 18FDG D-PET of solid tumors. In a study comprising 31 soft tissue sarcoma patients, K1, k3 and νp were about and 0.5 min−1, 0.05 min−1 and 0.1, respectively (cohort-based median values) [Citation7]. These estimates are quite in line with those found in the current work. Furthermore, a study on 75 patients with breast cancer gave K1 and MRFDG values of about 0.13 min−1 and 0.025 min−1, respectively, also comparable to the values found in the current work [Citation26].
In this paper, three parameters were assumed to describe glucose metabolism: SUVL, MRFDG, and k3. SUVL is by far the most frequently used surrogate measure for hypermetabolism, as it represent the SUV obtained from static, conventional PET. SUVL closely resembles MRFDG, though the latter is less dependent on the vasculature. The pharmacokinetic parameter k3 describes the cellular expression of the glycolytic enzyme hexokinase and represents the metabolic potential of the cells. The time-SUV curves () reveal heterogeneity in temporal glucose distribution among the tumors. They also show that a distinct vascular phase does not necessarily imply a strong metabolic phase. A single static value acquired 45 min p.i. (SUVL), as obtained from conventional PET, is therefore not descriptive for the vascular phase of 18FDG distribution. Valuable information of tumor physiology may thus be lost in conventional, static PET.
The vascular parameter maps K1, k2, νp and SUVE describe different properties of the blood supply. Still, the peak parameter values in the tumors correlate significantly with each other, and a simple static value some minutes after injection (SUVE) may be considered an alternative to a complete pharmacokinetic analysis. A short static image acquisition at the time of injection, providing SUVE, and letting the patient rest for 45 minutes prior to the next static acquisition (giving SUVL) could reduce the burden to the patient. However, this would necessitate an additional co-registration between the images obtained during the early and late acquisition. Furthermore, the peak values of the metabolic parameters SUVL and MRFDG showed significant correlations with each other. Yet, they displayed different intensities in regions dominated by vasculature (). The k3 parameter, on the other hand, produces values that highlight not only metabolically active regions but also regions combining some degree of metabolism with poor vascularity.
One disadvantage of using quantification parameters like max, peak or median, are the loss of voxel value distribution (). For the metabolic parameters, high values represent pathology, while for the vascular parameters, the relation is not evident. Regions with high vascular parameter values may represent angiogenesis and tumor progression while regions with low values may represent hypoxia and cellular stress. Thus it may be necessary to examine the full histogram rather than focus on single values [Citation27].
In conclusion, D-PET represents a method to obtain both vascular and metabolic information in a single examination. In the present study, no predictive parameters for patient survival could be detected. However, sarcomas are a heterogeneous class of tumors and further clinical studies are required in order to get more insight into the role of dynamic PET scanning for management of these diseases.
Acknowledgements
Dr. Trond Velde Bogsrud is gratefully acknowledged for contributing to the initiation of the project.
Declaration of interest: The authors report no conflicts of interest. The authors alone are responsible for the content and writing of the paper.
References
- Jebsen NL, Bruland OS, Eriksson M, Engellau J, Turesson I, Folin A, et al. Five-year results from a Scandinavian sarcoma group study (SSG XIII) of adjuvant chemotherapy combined with accelerated radiotherapy in high-risk soft tissue sarcoma of extremities and trunk wall. Int J Radiat Oncol Biol Phys 2011;81:1359–66.
- Benz MR, Czernin J, Allen-Auerbach MS, Tap WD, Dry SM, Elashoff D, et al. FDG-PET/CT imaging predicts histopathologic treatment responses after the initial cycle of neoadjuvant chemotherapy in high-grade soft-tissue sarcomas. Clin Cancer Res 2009;15:2856–63.
- Kasper B, Dietrich S, Dimitrakopoulou-Strauss A, Strauss LG, Haberkorn U, Ho AD, et al. Early prediction of therapy outcome in patients with high-risk soft tissue sarcoma using positron emission tomography. Onkologie 2008;31:107–12.
- Fletcher JW, Djulbegovic B, Soares HP, Siegel BA, Lowe VJ, Lyman GH, et al. Recommendations on the use of 18F-FDG PET in oncology. J Nucl Med 2008;49:480–508.
- Malinen E, Rodal J, Knudtsen IS, Sovik A, Skogmo HK. Spatiotemporal analysis of tumor uptake patterns in dynamic (18)FDG-PET and dynamic contrast enhanced CT. Acta Oncol 2011;50:873–82.
- Mullani NA, Herbst RS, O’Neil RG, Gould KL, Barron BJ, Abbruzzese JL. Tumor blood flow measured by PET dynamic imaging of first-pass 18F-FDG uptake: A comparison with 15O-labeled water-measured blood flow. J Nucl Med 2008;49:517–23.
- Dimitrakopoulou-Strauss A, Strauss LG, Egerer G, Vasamiliette J, Schmitt T, Haberkorn U, et al. Prediction of chemotherapy outcome in patients with metastatic soft tissue sarcomas based on dynamic FDG PET (dPET) and a multiparameter analysis. Eur J Nucl Med Mol Imaging 2010;37:1481–9.
- Raghunand N, Gatenby RA, Gillies RJ. Microenvironmental and cellular consequences of altered blood flow in tumours. Br J Radiol 2003;76:S11–22.
- Aristophanous M, Yap JT, Killoran JH, Chen AB, Berbeco RI. Four-dimensional positron emission tomography: Implications for dose painting of high-uptake regions. Int J Radiat Oncol Biol Phys 2011;80:900–8.
- Sovik A, Malinen E, Olsen DR. Strategies for biologic image-guided dose escalation: A review. Int J Radiat Oncol Biol Phys 2009;73:650–8.
- Dimitrakopoulou-Strauss A, Strauss LG, Schwarzbach M, Burger C, Heichel T, Willeke F, et al. Dynamic PET 18F-FDG studies in patients with primary and recurrent soft-tissue sarcomas: Impact on diagnosis and correlation with grading. J Nucl Med 2001;42:713–20.
- Phelps ME, Huang SC, Hoffman EJ, Selin C, Sokoloff L, Kuhl DE. Tomographic measurement of local cerebral glucose metabolic rate in humans with (F-18)2-fluoro-2-deoxy- D-glucose: Validation of method. Ann Neurol 1979;6:371–88.
- Roe K, Aleksandersen TB, Kristian A, Nilsen LB, Seierstad T, Qu H, et al. Preclinical dynamic 18F-FDG PET – tumor characterization and radiotherapy response assessment by kinetic compartment analysis. Acta Oncol 2010;49:914–21.
- Boellaard R, O’Doherty MJ, Weber WA, Mottaghy FM, Lonsdale MN, Stroobants SG, et al. FDG PET and PET/CT: EANM procedure guidelines for tumour PET imaging: Version 1.0. Eur J Nucl Med Mol Imaging 2010;37:181–200.
- Phelps ME. PET: Molecular imaging and its biological applications. New York, NY: Springer-Verlag; 2004.
- de Geus-Oei LF, Visser EP, Krabbe PF, van Hoorn BA, Koenders EB, Willemsen AT, et al. Comparison of image-derived and arterial input functions for estimating the rate of glucose metabolism in therapy-monitoring 18F-FDG PET studies. J Nucl Med 2006;47:945–9.
- Puri T, Blake GM, Frost ML, Moore AE, Siddique M, Cook GJ, et al. Validation of image-derived arterial input functions at the femoral artery using 18F-fluoride positron emission tomography. Nucl Med Commun 2011;32:808–17.
- Zasadny KR, Wahl RL. Standardized uptake values of normal tissues at PET with 2-[fluorine-18]-fluoro-2-deoxy-D-glucose: Variations with body weight and a method for correction. Radiology 1993;189:847–50.
- Wahl RL, Jacene H, Kasamon Y, Lodge MA. From RECIST to PERCIST: Evolving considerations for PET response criteria in solid tumors. J Nucl Med 2009;50:122S–50S.
- Bos R, van Der Hoeven JJ, van Der Wall E, van Der Groep P, van Diest PJ, Comans EF, et al. Biologic correlates of (18)fluorodeoxyglucose uptake in human breast cancer measured by positron emission tomography. J Clin Oncol 2002;20:379–87.
- Port RE, Knopp MV, Brix G. Dynamic contrast-enhanced MRI using Gd-DTPA: Interindividual variability of the arterial input function and consequences for the assessment of kinetics in tumors. Magn Reson Med 2001;45:1030–8.
- Charest M, Hickeson M, Lisbona R, Novales-Diaz JA, Derbekyan V, Turcotte RE. FDG PET/CT imaging in primary osseous and soft tissue sarcomas: A retrospective review of 212 cases. Eur J Nucl Med Mol Imaging 2009;36:1944–51.
- Alic L, van Vliet M, van Dijke CF, Eggermont AM, Veenland JF, Niessen WJ. Heterogeneity in DCE-MRI parametric maps: A biomarker for treatment response?Phys Med Biol 2011;56:1601–16.
- Tseng J, Dunnwald LK, Schubert EK, Link JM, Minoshima S, Muzi M, et al. 18F-FDG kinetics in locally advanced breast cancer: Correlation with tumor blood flow and changes in response to neoadjuvant chemotherapy. J Nucl Med 2004;45:1829–37.
- Dimitrakopoulou-Strauss A, Strauss LG, Egerer G, Vasamiliette J, Mechtersheimer G, Schmitt T, et al. Impact of dynamic (18)F-FDG PET on the early prediction of therapy outcome in patients with high-risk soft-tissue sarcomas after neoadjuvant chemotherapy: A feasibility study. J Nucl Med 2010;51:551–8.
- Dunnwald LK, Doot RK, Specht JM, Gralow JR, Ellis GK, Livingston RB, et al. PET tumor metabolism in locally advanced breast cancer patients undergoing neoadjuvant chemotherapy: Value of static versus kinetic measures of fluorodeoxyglucose uptake. Clin Cancer Res 2011;17:2400–9.
- Andersen EK, Hole KH, Lund KV, Sundfor K, Kristensen GB, Lyng H, et al. Dynamic contrast-enhanced MRI of cervical cancers: Temporal percentile screening of contrast enhancement identifies parameters for prediction of chemoradioresistance. Int J Radiat Oncol Biol Phys 2012;82:e485–92.