Abstract
The intra-fractional movement of the prostate constitutes a hindrance for the reduction of the planning target volume margin for prostate cancer patients. Monitoring the movement of the prostate during treatment is a promising but in most centres not feasible solution. However, the projection images of the pre-treatment cone-beam computed tomography (CBCT) provide information about the motion of the target immediately preceding the treatment. This motion information can be extracted from any standard CBCT scan which is available in many institutions. In this study we measure the motion of the prostate during the pre-treatment CBCT and investigate whether this motion is correlated with the intra-fractional movement of the prostate. Material and methods. Pre- and post-treatment CBCT scans were made during a number of the fractions (average 11 range 8–12) for 13 prostate cancer patients during the radiation treatment course. The displacement of the post-treatment CBCT scans relative to the pre-treatment position was used to assess the intra-fractional motion. Automated image analysis was used to track the 2D position of radiopaque markers in the projection images of the scans. The most probable 3D trajectory of the markers during the CBCT scan was estimated based on a probability density function which was established for each individual scan. Results. The accuracy of the tracking algorithm was found satisfactory and the motion of the markers during the CBCT scans was successfully extracted from the projection images. This motion was generally small and uncorrelated with the subsequent intra-fractional movement of the prostate. The correlation coefficients were 20.05, 0.07, and 20.05 in the LR, AP, and CC direction, respectively. Conclusion. It is tempting to exploit the pre-treatment CBCT to predict the intra-fractional movement of the prostate but, unfortunately, we have found no correlation between the intra-fractional movement and the motion of the prostate immediately prior to treatment.
Escalating the dose delivered to the prostate has been shown to improve the clinical outcome of external beam radiotherapy for prostate cancer patients [Citation1]. However, in order to spare the organs at risk the planning target volume (PTV) margin must be accordingly reduced [Citation2]. Implanting fiducial markers in the prostate and using daily image guided radiotherapy is a crucial step in meeting this requirement [Citation3,Citation4]. This setup allows for the correction of inter-fractional motion of the prostate relative to the bony anatomy. Several studies suggest that the motion during treatment is not negligible [Citation5,Citation6] and further margin reduction is not possible unless the issue of intra-fractional prostate motion is addressed. Live tracking of the position of the prostate would allow intervention during treatment when the target moves out of range. Interventions could include beam interruption followed by couch correction [Citation7] or dynamic multileaf collimator tracking [Citation8,Citation9].
Methodologies which allow tracking of the prostate movement during radiation delivery include monitoring of implanted electromagnetic transponders [Citation5] and stereoscopic x-ray imaging of fiducial markers [Citation10]. However, neither of these techniques is commonly found in the clinic. Alternatively, the 3D position of the markers could be estimated using the single kV x-ray imager most modern linacs are equipped with [Citation11]. Poulsen et al. have developed a method to estimate the trajectory of the prostate during arc treatment using cone-beam computed tomography (CBCT) projection images [Citation12–14]. In brief, the procedure of the method is to estimate a 3D Gaussian probability density function (PDF) for the target position based on knowledge of the 2D position in a number of pre-treatment projection images. Subsequent 3D positions of the prostate may be estimated using the PDF as well as the 2D position on the projection images obtained during treatment [Citation14].
A fundamental prerequisite for implementing the method is the possibility of generating and reading projection images during treatment. This feature is not available at many centres, including ours. However, the projection images of pre-treatment CBCTs provide information about the motion of the target immediately preceding the treatment. This motion information can be extracted from any standard CBCT scan using the method developed by Poulsen et al. and is thus potentially available in many institutions. If the magnitude of the motion immediately prior to treatment is a predictor for the magnitude of the intra-fractional motion, such information would have clinical importance.
In the present study, we have determined the intra-fractional motion of the prostate for a number of patients by making post- as well as pre-treatment CBCTs. Furthermore, we have estimated the motion of the prostate during the pre-treatment CBCT and investigated whether this motion correlates with the intra-fractional movement of the prostate.
Material and methods
Patients
In the period between March and August 2009, 39 patients with prostate cancer were studied to quantify the inter- and intra-fractional motion of the prostate in our clinic. Of these patients, 17 were randomly selected for analysis in the present study. The image analysis algorithm described below was unable to correctly track the gold markers in every pre- and post-treatment CBCT for four of these patients (see discussion for further explanation) and the results presented below refer to the remaining 13 patients.
All patients were intermediate- or high-risk patients with Gleason scores ≥ 7 and/or PSA ≥ 10 and vesicular involvement. The patients had three markers implanted (one patient had two) in the prostate two weeks prior to commencement of radiotherapy. The markers were cylindrical gold markers, 1 mm in diameter and 3 mm long. As reference points for setup of the longitudinal position and coronal rotation, the patients were tattooed on the hips (greater trochanter). A mark on a semipermanent band-aid on the lower abdomen served as external marker for the lateral position. The treatment couch height was fixed for the individual patient. The patients were positioned in a vacuum fixation cushion that extended from the knees to the feet. One week after inserting the gold markers a 3 mm slice thickness treatment planning CT scan was made.
CBCT acquisition
Radiotherapy was delivered on Elekta Synergy® linacs equipped with an X-ray Volume Imaging (XVI 4.2) system. Pre- and post-treatment CBCT scans were planned on the first to third fraction, and again on fraction numbers 10–12, 20–23 and 30–33. On average 11 (range 8–12) of the planned 12 post-treatment CBCT scans were realised. The total number of post-treatment CBCT scans for the 13 patients was 141. The patients were positioned head-first supine on the couch. In the XVI coordinate system depicted in positive x, y, and z coordinates corresponds to left, cranial, and anterior directions, respectively. The scans were acquired in a half-arc with a clockwise rotation of the gantry, either with the gantry angle θ running from −90° to 90° or with θ running from 0° to 180° using a fast gantry speed [Citation15]. With a frame-rate of 5.5 Hz the average number of projection images acquired was 171 and the average acquisition time was 31 seconds. The pre-treatment CBCT was registered to the planning CT using a manual seed match to the delineation of the gold seeds and the couch was adjusted online to obtain a correct pre-treatment position. The post-treatment CBCT was likewise registered to the planning CT and the positional displacement of the markers relative to the pre-treatment position was used to assess the intra-fractional movement of the prostate dintra.
Figure 1. XVI coordinate system where positive x and z coordinates correspond to left and anterior directions, respectively. The y coordinate corresponds to the cranial direction and points into the paper. CBCT scans were acquired with clockwise rotation with the gantry angle θ either from 2 90° to 90° or from 0° to 180°. r is the mean seed position and μ is the estimated location of the seed along the line connecting the focus point of the imaging system f and the location of the seed on the imager p. The figure is adapted from Poulsen et al. [Citation14].
![Figure 1. XVI coordinate system where positive x and z coordinates correspond to left and anterior directions, respectively. The y coordinate corresponds to the cranial direction and points into the paper. CBCT scans were acquired with clockwise rotation with the gantry angle θ either from 2 90° to 90° or from 0° to 180°. r is the mean seed position and μ is the estimated location of the seed along the line connecting the focus point of the imaging system f and the location of the seed on the imager p. The figure is adapted from Poulsen et al. [Citation14].](/cms/asset/5f6f77ba-f324-450b-978f-b49c76ae4c1e/ionc_a_747698_f0001_b.gif)
Seed trajectory
The 2D marker trajectories in the projection images were tracked using an automated image analysis algorithm written in MATLAB. In brief, the procedure involves the following steps: 1) The average 3D positions of the seeds were located in the reconstructed volumetric CBCT images; 2) These 3D positions were projected onto the projection images as locations to search for seeds; and 3) The actual 2D positions of the seeds in the projection image were located. The difference between the actual and average seed position is a measure of the seed motion during the scan. In the appendix these steps are more thoroughly described (Supplementary Appendix to be found online at http://informahealthcare.com/doi/abs/10.3109/0284186X.2012.747698.
Information about the position in the projection image readily gives two of the three components of the seed position in the patient. Only the location along the line connecting the position of the seed in the projection image and the focus point of the system, f, needs to be estimated (see ). The third component was estimated by a method based on probability density reported by Poulsen et al. [Citation12–14]. Simplistically, the method selects the most probable position for the third component based on a PDF which is created by the use of all the projection images of the scan.
Prostate motion
In projection image i the 3D deviation from the mean position of seed j is named ri,j = (xi,j yi,j zi,j). The relative position of the prostate in projection image i is the average of the individual seed specific ri,j and is named ri = (xi yi zi). To quantify the motion of the prostate during the CBCT scans the standard deviation of the relative position of the prostate in the LR, CC, and AP direction during a scan was calculated, e.g. the standard deviation of the position of the prostate in the LR direction, σLR is given by
where m is the number of projection images in the scan.
Tracking error
The location of the prostate in the pelvis impedes tracking of the seeds because of attenuation in bony structures. This may give rise to error in the estimate of the position of the seeds in the projection images. The error was quantified by calculating the root mean square (RMS) error of the relative position in each of the principle axes, e.g. the RMS error in the LR direction, δLR,i, in frame i is given by
where n is the number of seeds in the patient. Any rotational and twist motion will add to the RMS error, but these contributions are considered to be minor compared to the tracking errors.
Results
Based on the estimated trajectory of the seeds, the time dependent position of the prostate was calculated for all 282 CBCT scans. shows a typical result of the analysis of the motion of the prostate during a scan. In the CC direction, respiratory motion with a peak to peak distance of around 0.5 mm and repetition time of approximately 4 seconds is observed. The respiratory signal is noisy in the region around θ = 0 (~15 seconds). At this angle, noise is also observed in the AP direction. The noise is related to tracking errors as described below. Motion in the LR direction is mainly observed in the imaging direction for which this component is directly observed as discussed below. shows the result of the analysis with the largest prostate motion observed in this study. Four selected projection images from this scan are also shown in the figure.
Figure 2. Panel (a) shows a typical result of the analysis of the motion of the prostate during a scan. The result of the analysis with the largest prostate motion observed is shown in panel (b). Also seen in the figure are four selected projection images from this scan. The stationary 3D positions of the seeds found in the reconstructed CBCT data are projected onto the images as circles, while the position of the seeds in the projection images as estimated by the image analysis algorithm are shown as crosses.
The movement of the prostate during the scans was generally very small. The standard deviation of the position of the prostate in each direction during a scan was calculated according to Equation 1 for each individual scan. The results are shown in . Median values of the standard deviation of the position of the prostate as well as the range of values are given in . It is seen in the figure and the table values that motion during the CBCT scan is quite limited and typically below 0.4 mm, somewhat depending on motion direction. Median values of the intra-fractional movement, dintra, are also given in the table. As described earlier, dintra is measured by the positional displacement of the markers relative to the pre-treatment position as determined by the post-treatment CBCT.
Figure 3. Distribution of standard deviations of the position of the prostate during pre- and post-treatment CBCT scans.
Table I. Prostate movement and tracking error.
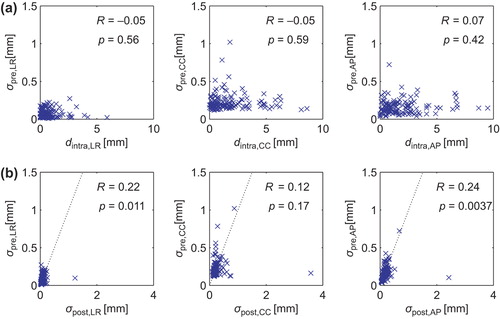
The standard deviation of the position of the prostate during the pre-treatment CBCT scan, σpre, was compared to the intra-fractional movement of the prostate in each direction. The results are shown in . Values of Pearson's correlation coefficient were calculated for each of the principle directions and are shown in the figure. As they are all close to zero, it was established that there is no correlation between intra-fractional motion and movement during a CBCT scan immediately prior to treatment. The standard deviation of the position of the prostate in the post-treatment CBCT scan was calculated similarly to σpre. In σpre is plotted as function of σpost in each direction. Pearson's correlation coefficient was calculated similar to above and shown in the figure. It is seen in the figure that the motion correlation between pre- and post-treatment scans is higher than the correlation between the motion measured in the pre-treatment scan and the intra-fractional motion.
Figure 4. Panel (a) show plots of the standard deviation of the position of the prostate σpre during the pre-treatment CBCT scan as function of the intra-fractional movement dintra. Also shown in the panel are values of the correlation coefficient R in each direction as well as the corresponding p-values. In panel (b) σpre is plotted against the standard deviation of the position of the prostate during the post-treatment CBCT scan, σpost. Unity slope is indicated by the dashed lines.
To estimate the accuracy of the analysis algorithm the RMS error of the relative position of the seeds in each of the principle axes was calculated as a function of gantry angle for all individual scans using Equation 2. The result is shown in . In the plots it is observed that the median RMS error in the CC direction peaks at 0° and 180°. This corresponds to imaging angles where tracking of the seeds is impeded by bony structure. The same trend is found in the AP direction. In the LR direction the median RMS error falls to zero at angles close to 0° and 180°. These are imaging angles where LR motion is not directly resolvable, and the position therefore relies solely on internal motion coupling between the LR position and the two directly observable directions (CC and AP). Median values of δ as well as the ranges are given in .
Figure 5. Median RMS error of the relative position of the seeds for all scans as function of gantry angle.
Discussion
A requirement for the estimation of the seed trajectory using kV imaging is a valid tracking algorithm [Citation16]. In the present study we have developed a procedure that tracks seeds in the pelvic region where the bony structures impedes image analysis. The impediments may lead to a reduction in the accuracy of the tracking. As noted in , the median RMS error in the CC direction is 0.09 mm. As this component is resolved at all angles the median RMS error in this direction gives the best indication about error in the tracking procedure in general. The accuracy of the tracking algorithm may be compared to the inherent accuracy of the probability density method. Poulsen et al. [Citation13] reports that the 3D mean RMS error of the prostate trajectories estimated by the probability density method is 0.18 mm.
In it is seen that the median RMS error falls to zero at angles close to 0° and 180°. In the method used to estimate the 3D position of prostate [Citation13], it is assumed that the LR motion is uncorrelated with motion in the AP and CC direction. Therefore, the analysis algorithm assumes that the markers reside at the mean position in the LR direction when no direct information is available about their location. Similar, in the AP direction dips in the median RMS error are observed at angles close to −90° and 90° where AP motion is not directly resolvable. However, the AP values do not fall to zero since this motion component may be correlated to motion in the CC direction.
As the pre-treatment CBCT data is uncorrelated with the intra-fractional motion data, we likewise expect no correlation between the pre- and post-treatment data. However, as observed in a slightly higher correlation is found. This is most likely a result of correlations in the tracking error. For patients where the anatomical features gives rise to tracking errors in the pre-treatment scan, similar tracking errors will also be observed in the post-treatment scan.
The algorithm has successfully tracked the seeds of 13 of the 17 analysed patients, while analysis of the remaining four patients was abandoned. One of these patients had an artificial hip with dense material which made tracking impossible. Two of the patients had seeds separated by less than 15 mm. For these two cases the algorithm occasionally tracked the wrong seed. For the last patient two of the seeds were positioned in the same transverse plane. Such a constellation did not cause any problem in other patients but occasionally for this patient the wrong seed was tracked. If the tracking algorithm was to be clinically implemented a fail rate of 24% would not be satisfactory. However, in a clinical setting only the seeds lying in different transverse planes should be selected for tracking. We have not chosen this course in order to adopt consistency in the analysis procedure.
In general we have observed very little motion of the prostate during the 282 scans analysed. Using the Calypso System, Kupelian et al. [Citation7] analysed the motion of implanted electromagnetic transponders in the prostate during radiotherapy fractions. They have found a number of different motion behaviours for the prostate including continuous drift, transient excursion, persistent excursion, high-frequency excursion, and erratic behaviour. The authors did not quantify the occurrence of these types of movement. In our setup the average time-span from pre- to post-treatment CBCT was 9 minutes, while the mean scan time was 31 seconds. The average vectorial intra- fractional movement was 2.9 mm. If the main motion behaviour of the prostate is continuous drift, it would move approximately 0.2 mm during a single scan on average. Such a small movement is on the border of the resolution of the technique and will probably not be picked up. If transient or persistent excursions are the main contributors, the movement will only be picked up by the analysis if the motion is taking place during the scan. This means that if the frequency is low, this type of movement will only contribute occasionally to σ. However, high-frequency excursions should contribute and give rise to increasing σ, and likewise would erratic behaviour of the prostate motion contribute if position changes are frequent enough. As seen in we have not observed any correlation between motion during the pre-treatment CBCT and the intra-fractional movement of the prostate. This is expected if the prostate exhibits low-frequency excursions or continuous drift. Increasing the scan time might give rise to increasing correlation, however, as patients presently are scanned on a daily basis, increasing the scan time would be an issue in a busy clinic.
The tracking algorithm developed during this study allows an implementation of the method developed by Poulsen et al. [Citation12–14] on clinical CBCT data. The method was used to estimate the trajectory of the prostate during pre-treatment CBCT acquisition. We have shown that information about the movement immediately prior to treatment cannot predict the actual intra-fractional motion of the prostate. Future PTV margin reduction will therefore likely involve monitoring of the seed positions during treatment.
Supplementary Appendix.
Download PDF (433.5 KB)Acknowledgements
This work is supported by The Lundbeck Foundation Center for Interventional Research in Radiation Oncology (CIRRO) and The Danish Council for Strategic Research. UB acknowledges funding from Elekta.
Declaration of interest: The authors report no conflicts of interest. The authors alone are responsible for the content and writing of the paper.
References
- Kupelian PA, Potters L, Khuntia D, Ciezki JP, Reddy CA, Reuther AM, et al. Radical prostatectomy, external beam radiotherapy < 72 Gy, external beam radiotherapy > or = 72 Gy, permanent seed implantation, or combined seeds/external beam radiotherapy for stage T1-T2 prostate cancer. Int J Radiat Oncol Biol Phys 2004;58:25–33.
- Kuban D, Pollack A, Huang E, Levy L, Dong L, Starkschall G, et al. Hazards of dose escalation in prostate cancer radiotherapy. Int J Radiat Oncol Biol Phys 2003;57:1260–8.
- Kupelian PA, Lee C, Langen KM, Zeidan OA, Mãnon RR, Willoughby TR, et al. Evaluation of image-guidance strategies in the treatment of localized prostate cancer. Int J Radiat Oncol Biol Phys 2008;70:1151–7.
- Beltran C, Herman MG, Davis BJ. Planning target margin calculations for prostate radiotherapy based on intrafraction and interfraction motion using four localization methods. Int J Radiat Oncol Biol Phys 2008;70:289–95.
- Willoughby TR, Kupelian PA, Pouliot J, Shinohara K, Aubin M, Roach M, et al. Target localization and real-time tracking using the Calypso 4D localization system in patients with localized prostate cancer. Int J Radiat Oncol Biol Phys 2006;65:528–34.
- Kotte ANTJ, Hofman P, Lagendijk JJW, van Vulpen M, van der Heide UA. Intrafraction motion of the prostate during external-beam radiation therapy: Analysis of 427 patients with implanted fiducial markers. Int J Radiat Oncol Biol Phys 2007;69:419–25.
- Kupelian P, Willoughby T, Mahadevan A, Djemil T, Weinstein G, Jani S, et al. Multi-institutional clinical experience with the Calypso System in localization and continuous, real-time monitoring of the prostate gland during external radiotherapy. Int J Radiat Oncol Biol Phys 2007;67:1088–98.
- Keall PJ, Kini VR, Vedam SS, Mohan R. Motion adaptive x-ray therapy: A feasibility study. Phys Med Biol 2001; 46:1–10.
- Keall PJ, Sawant A, Cho B, Ruan D, Wu J, Poulsen P, et al. Electromagnetic-guided dynamic multileaf collimator tracking enables motion management for intensity-modulated arc therapy. Int J Radiat Oncol Biol Phys 2011;79:312–20.
- Kitamura K, Shirato H, Seppenwoolde Y, Onimaru R, Oda M, Fujita K, et al. Three-dimensional intrafractional movement of prostate measured during real-time tumor-tracking radiotherapy in supine and prone treatment positions. Int J Radiat Oncol Biol Phys 2002;53:1117–23.
- Adamson J, Wu Q. Prostate intrafraction motion evaluation using kV fluoroscopy during treatment delivery: A feasibility and accuracy study. Med Phys 2008;35:1793–806.
- Poulsen PR, Cho B, Langen K, Kupelian P, Keall PJ. Three-dimensional prostate position estimation with a single x-ray imager utilizing the spatial probability density. Phys Med Biol 2008;53:4331–53.
- Poulsen PR, Cho B, Keall PJ. A method to estimate mean position, motion magnitude, motion correlation, and trajectory of a tumor from cone-beam CT projections for image-guided radiotherapy. Int J Radiat Oncol Biol Phys 2008;72:1587–96.
- Poulsen PR, Cho B, Keall PJ. Real-time prostate trajectory estimation with a single imager in arc radiotherapy: A simulation study. Phys Med Biol 2009;54:4019–35.
- Westberg J, Jensen HR, Bertelsen A, Brink C. Reduction of Cone-Beam CT scan time without compromising the accuracy of the image registration in IGRT. Acta Oncol 2010; 49:225–9.
- Fledelius W, Worm E, Elvstrøm UV, Petersen JB, Grau C, Høyer M, et al. Robust automated segmentation of multiple implanted cylindrical gold fiducial markers in cone-beam CT projections. Med Phys 2011;38:6351–61.