Abstract
Background. Maximum, mean and peak SUV of primary tumor at baseline FDG-PET scans, have often been found predictive for overall survival in non-small cell lung cancer (NSCLC) patients. In this study we further investigated the prognostic power of advanced metabolic metrics derived from intensity volume histograms (IVH) extracted from PET imaging. Methods. A cohort of 220 NSCLC patients (mean age, 66.6 years; 149 men, 71 women), stages I–IIIB, treated with radiotherapy with curative intent were included (NCT00522639). Each patient underwent standardized pre-treatment CT-PET imaging. Primary GTV was delineated by an experienced radiation oncologist on CT-PET images. Common PET descriptors such as maximum, mean and peak SUV, and metabolic tumor volume (MTV) were quantified. Advanced descriptors of metabolic activity were quantified by IVH. These comprised five groups of features: absolute and relative volume above relative intensity threshold (AVRI and RVRI), absolute and relative volume above absolute intensity threshold (AVAI and RVAI), and absolute intensity above relative volume threshold (AIRV). MTV was derived from the IVH curves for volumes with SUV above 2.5, 3 and 4, and of 40% and 50% maximum SUV. Univariable analysis using Cox Proportional Hazard Regression was performed for overall survival assessment. Results. Relative volume above higher SUV (80%) was an independent predictor of OS (p = 0.05). None of the possible surrogates for MTV based on volumes above SUV of 3, 40% and 50% of maximum SUV showed significant associations with OS [p (AVAI3) = 0.10, p (AVAI4) = 0.22, p (AVRI40%) = 0.15, p (AVRI50%) = 0.17]. Maximum and peak SUV (r = 0.99) revealed no prognostic value for OS [p (maximum SUV) = 0.20, p (peak SUV) = 0.22]. Conclusions. New methods using more advanced imaging features extracted from PET were analyzed. Best prognostic value for OS of NSCLC patients was found for relative portions of the tumor above higher uptakes (80% SUV).
Lung cancer is the most common cancer type worldwide, accounting for more than 1.1 million deaths annually. Of the total number of cases, 85% are of the non-small cell lung cancer (NSCLC) type. The five-year survival for stages I–II and III is disappointingly low at 50% and 20%, respectively, mainly due to a high rate of loco-regional and distant progression [Citation1].
Nowadays, much research largely focuses on prediction of treatment outcome based on patient and tumor characteristics prior to treatment. This would allow treatment to be individualized and therapeutic approaches to be enhanced [Citation2]. Here, imaging can play a crucial role as it allows for a non-invasive identification of the tumor [Citation3]. Indeed, functional information gathered by positron emission tomography (PET) has already been shown to be an effective tool in detecting early tumor alterations before any anatomical change is noticeable and detectable [Citation4]. However, the possibility to predict response to treatment or overall survival based solely on pre-treatment scans is still under investigation and so far only a few metrics based on PET imaging have been explored to this end.
Currently, 18F-fluoro-2-deoxy-D-glucose (FDG) is the most commonly used PET tracer in oncology. The investigation of prediction of tumor response based on PET features is mainly limited to simple measurements of standard uptake value (SUV) such as maximum, mean and peak (defined within the neighborhood of maximum SUV) [Citation5]. There is still limited confirmation whether these different SUV descriptors in pre-treatment scans are predictive [Citation6].
Previous research also describes metabolic tumor volume (MTV) and the total lesion glycolysis (TLG) calculated for tumor volumes derived from semi-automatic segmentation methods based on PET imaging. MTV is defined for absolute SUV thresholds of lower value or relative uptakes in regard to the maximum SUV [Citation7]. TLG is then expressed as the product of MTV by its mean SUV [Citation7–9].
We investigated the prognostic value of metrics based on the metabolic information of PET imaging. These metrics are based on intensity volume histograms (IVH), which summarize in a single curve the relation of tumor volume and SUV intensity. We hypothesized that the metabolic information described by these IVH curves could be used to predict treatment outcome of NSCLC patients.
The aim of this study was to assess the prognostic value of these IVH metrics for NSCLC patients treated with (chemo)radiotherapy and compare the results against the performance of the commonly used metrics based on SUV descriptors.
Material and methods
Demographic and clinical data
A total of 220 NSCLC (stage I–IIIB) patients referred to our institute between February 2005 and April 2011 were included. The study was approved by the appropriate Institutional Review Board and registered at clinicaltrials.gov (NCT00522639). Patients were treated with high dose radiotherapy (RT), had no surgery and no previous cancer within five years prior to diagnosis. Clinical follow-up was performed according to national guidelines.
Radiotherapy
All patients were treated at our institute with CT-based RT. The XiO/Focal system (Computerized Medical Systems, St. Louis, MO, USA), based on a convolution-superposition algorithm with inhomogeneity corrections and according to ICRU 50 guidelines was used for the RT planning [Citation10].
Patients were treated according to three different regimens:
Forty-four patients were treated with the standard protocol for sequential chemo- radiation, as defined in August 2005 [Citation11]. An individualized radiation dose escalation protocol (range 45–79.2 Gy) was delivered in two daily fractions of 1.8 Gy. Dose escalation was limited by the mean lung dose or the spinal cord dose constraint. Between fractions, an eight hour interval was respected.
One hundred and forty-eight patients received concurrent chemo-radiation. Following two cycles of carboplatin-gemcitabine, a radiation dose of 45 Gy, in fractions of 1.5 Gy delivered twice a day for the first course, directly followed by an individualized dose ranging from 6 to 24 Gy and delivered in 2.0 Gy fractions once a day.
Twenty-eight patients received no chemotherapy treatment. The RT applied was analogous to the sequential protocol (range 54–79.2 Gy).
Imaging data acquisition
All patients underwent a CT-PET scan before RT for treatment planning purposes (median: 7 days; range: 2–48). Patients fasted for at least six hours before scanning. Up to December 2010, a total dose of (bodyweight × 4 + 20) MBq of FDG was injected intravenously. After January 2011, the NEDPAS protocol was used and the administered dose was (2.5 × bodyweight) [Citation12]. CT-PET images were acquired 60 minutes post injection.
Data acquired up to December 2006 were gathered on Siemens Biograph 16 CT-PET scanner. After January 2007 data were acquired on a Siemens Truepoint 40 CT-PET (Siemens AG, Munich, Germany). An Ordered Subset Expectation Maximization 2D four iterations eight subsets (OSEM2D 4i8s) algorithm was used for PET image reconstruction. All PET scans were corrected for attenuation using the mid-ventilation phase of the 4D-CT or a 3D-CT thorax in case the 4D-CT was not of sufficient image quality due to irregular breathing of the patient. Model-based methods were applied for scatter correction. All exams were corrected for random events and decay.
Tumor segmentation
CT-PET images were imported into research treatment planning system Xio/Focal using the DICOM protocol. The primary gross tumor volume (GTV) was delineated by experienced radiation oncologists on the fused CT-PET images and used as the region of interest (ROI) for further analysis.
Image processing and feature extraction
SUV descriptors (maximum, mean and peak SUV), GTV and a set of metabolic features were extracted from the PET images and analyzed. Although it is commonly regarded as a clinical feature, we computed GTV as an imaging feature and compared it against the ones in the same category and possible surrogates. Peak SUV was computed by means of a 3D kernel, representing a 1 cm3 sphere made on the same grid as the scan and centered on the maximum SUV voxel, as defined on the guidelines of PET Response Criteria in Solid Tumors (PERCIST), version 1.0 [Citation13]. The uptake within this kernel was then averaged.
Metabolic features were based on the IVH, which are analogous to the dose-volume histograms [Citation14] and summarize in a curve the relation of tumor volume and SUV intensity. Five different curves can be defined: absolute and relative volume above relative intensity threshold (AVRI and RVRI), absolute and relative volume above absolute intensity threshold (AVAI and RVAI), and absolute intensity above relative volume threshold (AIRV). AVAI and RVAI are built in steps of 0.5 (SUV) up to the maximum uptake. Curves regarding relative quantities are built in steps of 10%. Graphical representations of these types of curves for two patients are displayed in . A total of 47 features were retrieved for the metabolic features: nine for each set of curves based on relative thresholds (AVRI, RVRI and AIRV) and 10 for absolute thresholds (AVAI and RVAI), corresponding to a maximum absolute threshold of five. This threshold was chosen so as 85% of patients under analysis would have a valid feature.
Figure 1. Transverse view of CT-PET scan of NSCLC patients. Examples of intensity volume histograms for the two patients are shown on the right. Maximum SUV for patients A and B (top and bottom left) are, respectively, 10.1 and 6.3. From the RVRI curves, it can be inferred that the minimum SUV is around 8% (0.80) and 20% (1.25) of the maximum uptake. AVAI curves confirm that all the tumor volume is above these minimum uptake values for the corresponding patient.
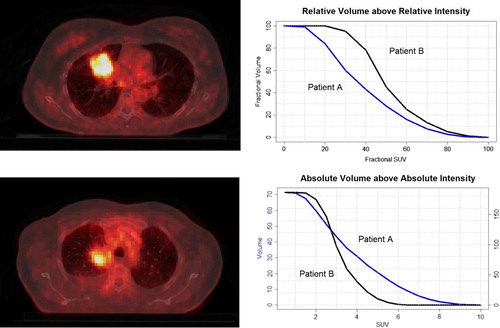
Image analysis was performed in Matlab R2012b (The Mathworks, Natick, MA, USA) using an adapted version of Computational Environment for Radiotherapy Research (CERR) [Citation15]. PET images were normalized to SUV before analysis. In-house developed image analysis software was used for feature extraction.
Survival endpoint
The primary endpoint was overall survival (OS), calculated from the start of RT until date of death or last follow-up. “Gemeentelijke Basis Administratie” (GBA), a decentralized population registration system of the Netherlands, was verified to assess survival status. A patient still alive at the end of the study was considered right-censored.
Statistical analysis
Imaging features based on PET scans were analyzed using univariable Cox Proportional Hazard Regression. The assumption of proportional hazards was assessed by the Scaled Schoenfeld residuals. Time-dependent variables were constructed by adding interactions with log(time). A statistical significance at the 5% level was used. Estimated log hazard ratios [log(HR)], hazard ratios (HR), p-value and 95% confidence intervals (95% CI) were reported. Additionally, a cluster analysis was performed to assess correlation between imaging features.
All statistical methods were implemented in R (version 2.15.0).
Results
At the time of analysis 150 patients had died (70/220 right-censored). The median survival time assessed by Kaplan-Meier method was 1.81 years (95% CI 1.54–2.19). Median follow-up time computed from start of RT until last follow-up was 1.47 years (95% CI 1.20–1.70). Clinical information of patients in analysis is displayed on Supplementary Appendix Table B1 (available online at http://www.informahealthcare.com/doi/abs/10.3109/0284186X.2013.812795).
A univariable Cox regression was performed for the two types of PET features (SUV descriptors and IVH metrics). Out of the 47 IVH metrics, nine showed statistical relevance, comprising AVAI curves from 0.5 up to 2.5, AVRI up to 20% and RVRI of 80%. None of the features from the AIRV and RVAI groups showed statistical significance. Detailed results of this analysis are displayed in .
Table I. Cox regression statistics of imaging features in univariable analysis.
In our study, maximum SUV showed no prognostic power for risk discrimination (p = 0.20). However, the portion of the tumor above 80% uptake (RVRI80) showed statistical significance (p = 0.05) and was associated with survival. The larger the relative volume above a higher uptake, the better the prognosis (HR = 0.11). This factor is correlated with the adjacent features describing fractions of tumor with uptakes above 70% and 90%, however, none of these features showed statistical significance [p(RVRI70) = 0.07, p(RVRI90) = 0.14].
Surrogates for GTV were encountered for metabolic features describing absolute volumes above lower absolute and relative uptakes (AVAI up to 2.5 and AVRI10). None of the possible surrogates for MTV based on volumes above SUV of 3, 40% and 50% of maximum SUV, showed significant associations with overall survival [p (AVAI3) = 0.10, p (AVAI4) = 0.22, p (AVRI40%) = 0.15, p (AVRI50%) = 0.17].
Detailed analysis was performed for GTV, maximum and peak SUV and RVRI80. Kaplan-Meier curves and results for the log-rank test based on a median split for these variables are displayed in Supplementary Appendix Figure A1 (available online at http://www.informahealthcare.com/doi/abs/10.3109/0284186X.2013.812795). GTV could discriminate between high- and low-risk patients (p = 0.05), while maximum (p = 0.25) and peak SUV (p = 0.08) and RVRI80 (p = 0.13) could not, based on this median split.
The unsupervised cluster analysis revealed three distinct groups of related information (Supplementary Appendix Figure A2 available online at http://www.informahealthcare.com/doi/abs/10.3109/0284186X.2013.812795). While both AVAI and AVRI grouped well with volume, AIRV was found highly correlated with maximum, mean and peak SUV and grouped in a wider cluster. Similarly to those, no statistical significance was encountered for AIRV in our dataset. RVRI and RVAI features clustered in two independent groups. For simplicity reasons, only features presented on were used for the clustering analysis.
Discussion
Until now PET has mainly been used for staging purposes. This results of its sensitivity to detect distant and loco-regional lymph node metastasis. Some authors also reported the localization of areas with higher RT resistance based on pre-treatment PET [Citation16]. Studies reported positive findings correlated with overall survival for pre-treatment PET scans [Citation17], but relied mainly on simplistic metrics [Citation18]. Also, metrics derived for tumor volume segmented by semi-automatic methods based on PET imaging, as MTV and TLG have been explored recently [Citation6–9]. In our study a set of PET features was derived, described by the metabolic information based on the relation of FDG uptake and volume, and reported by IVH curves. Preliminary results revealed that these variables derived from PET imaging provided an added value for survival prediction of NSCLC patients treated with high dose RT.
There is reported evidence for the prognostic power of maximum SUV in early stage (I and II) NSCLC. However, there is insufficient evidence to draw the same conclusion for higher stage NSCLC patients [Citation19–21]. In our cohort of patients, maximum SUV presented no statistical significant predictor of survival. This might be due to the large proportion of stage III patients in our cohort (75%). An analysis performed for only stage III patients showed concordant results (p = 0.19). In fact, the analysis using only stage III patients showed no statistical power in the univariable analysis for any of the imaging features, except for volume (p = 0.02).
The tumor response using peak SUV is highly sensitive to the definition of its corresponding region of interest [Citation22]. The non-prognostic power of peak SUV (p = 0.22) can be inferred from the fact that for such a small region of interest (1 cm3 around the maximum SUV), there is an overall high correlation with maximum SUV (r = 0.99).
Previous studies have described automatic delineation methods based on PET using either a fixed SUV or relative threshold. Cut-offs, e.g. 2.5, 3 and 4, and relative thresholds of 40% and 50% of the maximum SUV were already considered for the MTV definition [Citation7]. Assuming the maximum uptake voxel is enclosed in the delineated GTV, AVAI2.5, AVAI3, and AVAI4, AVRI40% and AVRI50% were considered to be a good approximation of MTV. However, to compute TLG automatic segmentation must be performed as the mean SUV of MTV cannot be retrieved from the IVH curves.
To our knowledge, this is the first study reporting on portions of tumor volume above a relative uptake, as described by the RVRI and RVAI curves. These metrics ensure different volumes to be more comparable in terms of partial distribution of activity. Researchers have already reported the use of IVH metrics, but they did not include the relative features [Citation23,Citation24] and their studies were based on smaller datasets and investigated other cancer sites. Two datasets of cervix and head and neck cancer treated with chemotherapy, were analyzed using this approach by el Naqa [Citation23]. Similarly, van Velden [Citation24] analyzed three lung cancer patients with dissimilar characteristics (heterogeneous, homogeneous uptake and double acquisition, before and after one course of chemotherapy).
The analysis based on the IVH metrics showed for curves describing absolute volumes above lower uptakes [p (AVAI0.5)< 0.01, p (AVAI1)< 0.01, p (AVAI1.5) = 0.01], showed a good agreement with the results obtained for tumor volume (p < 0.05). Similarly, volume defined for lower relative SUV threshold (10%) was also significant (p = 0.02). Tumor volume was contoured by experienced oncologists based on CT-PET images. However, the use of these metrics instead of delineated volume might have been useful for a better feature analysis as it is less prone to variability as contouring by humans.
In our analysis, the relative portions of the tumor defined for higher relative uptakes showed a positive correlation with survival (RVRI80, HR = 0.11, p = 0.05). Unlike maximum and peak SUV, the higher the portion above higher uptake, the better the prognosis. Graphically, the same conclusion can be drawn from the curves dividing relative risk patients displayed in Supplementary Appendix Figure A1 (available online at http://www.informahealthcare.com/doi/abs/10.3109/0284186X.2013.812795).This might be representative of a more homogeneous tumor for higher uptakes and therefore might be positively associated with better prognosis. AVRI metrics can be interpreted as RVRI multiplied by tumor volume. However, AVRI revealed an opposite effect and no statistical significance was found for the same thresholds.
We found several IVH metrics to be prognostic for overall survival. The study population consisted of stage I – IIIB NSCLC patients, with a much higher proportion of later stages. Although it would be very interesting to draw conclusions for each stage group, we have not performed such an analysis due to the limited number of patients. Therefore, we plan to increase the dataset. Furthermore, automatic tumor segmentation is planned to validate the results obtained using the IVH approach for MTV and to compute TLG.
In conclusion, new approaches based on metabolic metrics derived from baseline PET images to assess response in NSCLC patients were analyzed. Although we could not show that maximum SUV was prognostic for overall survival of the whole cohort, nor for a subgroup of stage III NSCLC patients, we were able to show that relative portions of tumor with higher SUV were positively associated with survival. This finding should be validated in new patient cohorts.
Appendix Table B1
Download PDF (1.1 MB)Declaration of interest: The authors report no conflicts of interest. The authors alone are responsible for the content and writing of the paper.
We acknowledge financial support from the QuIC–ConCePT project, which is partly funded by EFPI A companies and the Innovative Medicine Initiative Joint Undertaking (IMI JU) under Grant Agreement No. 115151. We also acknowledge financial support from the National Institute of Health (NIH–USA U01 CA 143062–01, Radiomics of NSCLC), the CTMM framework (AIRFORCE project, grant 030-103), EU 6th and 7th framework program (EUROXY, METOXIA, EURECA, ARTFORCE), euroCAT (IVA Interreg – www.eurocat.info), Kankeronderzoekfonds Limburg from the Health Foundation Limburg and the Dutch Cancer Society (KWF UM 2011–5020, KWF UM 2009–4454).
References
- Travis WD, Brambilla E, Müller-Hermelink HK, Harris CC. World Health Organization classification of tumours: Pathology and genetics of tumours of the lung, pleura, thymus and heart. Kleihues P, Sobin LH, editors. Lyon, France: IARC Press, International Agency for Research on Cancer; 2004.
- Lambin P, van Stiphout RG, Starmans MH, Rios-Velazquez E, Nalbantov G, Aerts HJ, et al. Predicting outcomes in radiation oncology – multifactorial decision support systems. Nat Rev Clin Oncol 2013;10:27–40.
- Lambin P, Rios-Velazquez E, Leijenaar R, Carvalho S, van Stiphout RG, Granton P, et al. Radiomics: Extracting more information from medical images using advanced feature analysis. Eur J Cancer 2012;48:441–6.
- Salminen E, Mac Manus M. Impact of FDG-labelled positron emission tomography imaging on the management of non-small-cell lung cancer. Ann Med 2001;33:404–9.
- Fuss M. Strategies of assessing and quantifying radiation treatment metabolic tumor response using F18 FDG Positron Emission Tomography (PET). Acta Oncol 2010; 49:948–55.
- Cook GJ, Yip C, Siddique M, Goh V, Chicklore S, Roy A, et al. Are pretreatment 18F-FDG PET tumor textural features in non-small cell lung cancer associated with response and survival after chemoradiotherapy?J Nucl Med 2013;54:19–26.
- Van de Wiele C, Kruse V, Smeets P, Sathekge M, Maes A. Predictive and prognostic value of metabolic tumour volume and total lesion glycolysis in solid tumours. Eur J Nucl Med Mol Imaging 2013;40:290–301.
- Hyun SH, Choi JY, Kim K, Kim J, Shim YM, Um SW, et al. Volume-based parameters of 18F-fluorodeoxyglucose positron emission tomography/computed tomography improve outcome prediction in early-stage non-small cell lung cancer after surgical resection. Ann Surg 2013;257: 364–70.
- Soussan M, Chouahnia K, Maisonobe JA, Boubaya M, Eder V, Morere JF, et al. Prognostic implications of volume-based measurements on FDG PET/CT in stage III non-small-cell lung cancer after induction chemotherapy. Eur J Nucl Med Mol Imaging Epub 2013 Jan 11.
- ICRU Report 50: Prescribing, Recording, and Reporting Photon Beam Therapy. Bethesda, MD: International Commission on Radiation Units and Measurements 1993.
- Oncology MR. Radiotherapy for NSCLC to a Individualized MLD (BRONC MLD). 2010 [updated 2013 April 29]; Available from: http://clinicaltrials.gov/show/NCT00573040.
- Boellaard R, Oyen WJ, Hoekstra CJ, Hoekstra OS, Visser EP, Willemsen AT, et al. The Netherlands protocol for standardisation and quantification of FDG whole body PET studies in multi-centre trials. Eur J Nucl Med Mol Imaging 2008;35:2320–33.
- Wahl RL, Jacene H, Kasamon Y, Lodge MA. From RECIST to PERCIST: Evolving considerations for PET response criteria in solid tumors. J Nucl Med 2009;50(Suppl 1): 122S–150S.
- Drzymala RE, Mohan R, Brewster L, Chu J, Goitein M, Harms W, et al. Dose-volume histograms. Int J Radiat Oncol Biol Phys 1991;21:71–8.
- Deasy JO, Blanco AI, Clark VH. CERR: A computational environment for radiotherapy research. Med Phys 2003;30: 979–85.
- Aerts HJ, van Baardwijk AA, Petit SF, Offermann C, Loon J, Houben R, et al. Identification of residual metabolic-active areas within individual NSCLC tumours using a pre-radiotherapy (18)Fluorodeoxyglucose-PET-CT scan. Radiother Oncol 2009;91:386–92.
- Kauppi JT, Oksala N, Salo JA, Helin H, Karhumaki L, Kemppainen J, et al. Locally advanced esophageal adenocarcinoma: Response to neoadjuvant chemotherapy and survival predicted by ([18F])FDG-PET/CT. Acta Oncol 2012; 51:636–44.
- Velazquez ER, Aerts HJ, Oberije C, De Ruysscher D, Lambin P. Prediction of residual metabolic activity after treatment in NSCLC patients. Acta Oncol 2010;49:1033–9.
- Abelson JA, Murphy JD, Trakul N, Bazan JG, Maxim PG, Graves EE, et al. Metabolic imaging metrics correlate with survival in early stage lung cancer treated with stereotactic ablative radiotherapy. Lung Cancer 2012;78:219–24.
- Agarwal M, Brahmanday G, Bajaj SK, Ravikrishnan KP, Wong CY. Revisiting the prognostic value of preoperative (18)F-fluoro-2-deoxyglucose ((18)F-FDG) positron emission tomography (PET) in early-stage (I & II) non-small cell lung cancers (NSCLC). Eur J Nucl Med Mol Imaging 2010;37:691–8.
- Hoang JK, Hoagland LF, Coleman RE, Coan AD, Herndon JE, 2nd, Patz EF, Jr. Prognostic value of fluorine-18 fluorodeoxyglucose positron emission tomography imaging in patients with advanced-stage non- small-cell lung carcinoma. J Clin Oncol 2008;26: 1459–64.
- Vanderhoek M, Perlman SB, Jeraj R. Impact of the definition of peak standardized uptake value on quantification of treatment response. J Nucl Med 2012;53:4–11.
- El Naqa I, Grigsby P, Apte A, Kidd E, Donnelly E, Khullar D, et al. Exploring feature-based approaches in PET images for predicting cancer treatment outcomes. Pattern Recognit 2009;42:1162–71.
- van Velden FH, Cheebsumon P, Yaqub M, Smit EF, Hoekstra OS, Lammertsma AA, et al. Evaluation of a cumulative SUV-volume histogram method for parameterizing heterogeneous intratumoural FDG uptake in non-small cell lung cancer PET studies. Eur J Nucl Med Mol Imaging 2011;38:1636–47.