Abstract
Background. Assessing hypoxia with oxygen probes provides a sparse sampling of tumor volumes only, bearing a risk of missing hypoxic regions. Full coverage is achieved with positron emission tomography (PET) using the tracer 18F-fluoromisonidazole (FMISO). In this study, the correlation between different FMISO PET imaging parameters and the median voxel PO2 (medianPO2) was analyzed. A measure of the median PO2 characterizes the microenvironment in consistency with probe measurements. Material and methods. Tissue oxygenations and FMISO diffusion-retention dynamics were simulated. Transport of FMISO and O2 molecules into and out of tissue was modeled by vessel maps derived from histology of head-and-neck squamous cell cancer xenograft tumor lines. Parameter sets were evaluated for 300 distinct 2 × 2 mm2 vessel configurations, including medianPO2 and two FMISO PET parameters: FH denotes the sub-regional signal four hours post injection (pi) and FH/P denotes the ratio between FH and the time-averaged signal 0–15 min pi. Correlations between O2 and FMISO parameters were evaluated. A receiver operating characteristics (ROC) analysis was performed, regarding the accuracy of FH and FH/P in identifying voxels with medianPO2 < 2.5 mmHg. Results. In hypoxic sub-regions, the correlation between FH and medianPO2 is low (R2 = 0.37), while the correlation between FH/P and median PO2 is high (R2 = 0.99). The ROC analysis showed that hypoxic regions can be identified using FH/P with a higher diagnostic accuracy (YI = sensitivity+ specificity-1 = 1.0), than using FH alone (YI = 0.83). Both FMISO parameters are moderately effective in identifying hypoxia on the microscopic length scale (YI = 0.63 and 0.60). Conclusions. A combination of two FMISO PET scans acquired 0–15 min and four hours pi may yield an accurate measure of the medianPO2 in a voxel (FH/P). This measure is comparable to averaged oxygen probe measurements and has the advantage of covering the entire tumor volume. Therefore, it may improve the prediction of radiotherapy outcome and facilitate individualized dose prescriptions.
Radiotherapy (RT) is less effective in hypoxic tumors. Clinical studies have shown that therapy response correlates with tumor oxygen concentrations (PO2) measured with Eppendorf electrodes [Citation1,Citation2]. Oxygen probes yield an accurate measure of the local PO2 and the measurements are confined to a very small tissue volume [Citation3]. However, they are invasive and limited to a few linear tracks across a tumor, i.e. it is impossible to assess the oxygenation in the entire tumor volume and as a consequence there is a risk of missing severely hypoxic regions. These aspects may limit the applicability of probe measurements to derive a reliable overall prognosis of RT outcome and to guide the adaption of RT dose prescriptions to the local degrees of hypoxia-associated radioresistance (hypoxia dose painting [Citation4,Citation5]).
A three-dimensional assessment of tumor hypoxia is possible with positron emission tomography (PET) imaging using hypoxia tracers such as 18F-fluoromisonidazole (FMISO). Clinical studies have shown that hypoxia PET imaging may be applicable to predict the overall RT response in different tumor entities including head-and-neck cancer [Citation6–8]. However, direct voxel-based comparisons between hypoxia PET data and PO2 measurements using optical oxygen probes in preclinical tumor models were contradictory [Citation9,Citation10]. The authors hypothesized that a possible explanation is that oxygen probes assess the PO2 in vital and necrotic tissue alike, while FMISO accumulates in vital cells only. Therefore, in severely hypoxic voxels with a large amount of necrosis, the ambiguous situation may occur that a low average PO2 coincides with a very low tracer accumulation. Similar observations were made in clinical tumors by a study comparing FMISO PET and measurements with an Eppendorf electrode in different tumor entities [Citation11].
This indicates that an assessment of the voxel-based PO2 by means of FMISO PET imaging with an accuracy comparable to that of probe measurements is intricate. It may require more comprehensive imaging protocols and dedicated tools for data analysis than an overall prognosis of RT outcome based on a single PET scan acquired several hours after tracer injection (pi).
The purpose of this study was to identify an FMISO PET imaging parameter that is an accurate measure of the median voxel PO2 as assessed by direct probe measurements. This parameter must overcome the limitations of imaging the FMISO accumulation at a single time point and may be useful to effectively guide hypoxia dose painting. In addition, its acquisition should be as simple as possible. Here, two parameters were considered that require either a single late PET scan (4 h pi) or the combination of a late scan and one immediately after tracer injection (0–15 minutes pi). The correlation between these parameters and the median of the underlying PO2 distribution was analyzed. The analysis was based on computational simulations of: 1) the tissue oxygenation; and subsequently, 2) the FMISO diffusion-accumulation dynamics for many different histology-derived microvessel arrangements [Citation12].
Material and methods
Tissue microsections and tumor microvessel maps
In order to model the flux of O2 and FMISO molecules into and out of tissue in a biologically realistic manner, vessel maps were derived from tumor tissue histology. As described earlier [Citation13], frozen tissue sections from human head-and-neck squamous cell cancer (SCCHN) xenograft tumor lines were immunohistochemically (IHC) stained for endothelial structures with 9F1 (rat monoclonal to mouse endothelium, Department of Pathology, Radboud University Nijmegen Medical Centre, Nijmegen, The Netherlands). Subsequently, the sections were scanned using a digital image analysis system, resulting in gray-scale images of the fluorescent signal. In this study, five images from different tumors with a total area of 133 mm2 were converted into vessel maps. The images were selected from a large database so that the vessel patterns varied strongly among as well as within the maps, ranging from very dense to sparse and inhomogeneous distributions. A total of 300 sub-regions with dimensions of 2 × 2 mm2 were placed in the maps at random locations. In these sub-regions, the studied O2 and FMISO parameters were calculated from the simulated data.
Modeling and simulation of O2 and FMISO
A tool to perform computer simulations of the FMISO diffusion-retention dynamics in multiple steps was used in this study. Its basic working principle is schematically shown in Supplementary Figure 1 available online at http://informahealthcare.com/doi/abs/10.3109/0284186X.2013.812796. The applied diffusion-reaction equations, simulation method and parameter values were described in detail earlier [Citation12]. Briefly, equilibrium oxygen partial pressure (PO2) distributions are calculated for a given vessel map. The applied model accounts for the supply of oxygen across capillary membranes, its distribution in tissue and its consumption by tumor cells. A Michaelis-Menten relationship describes that cells decrease their oxygen consumption in line with a decreasing amount of available oxygen [Citation14]. Subsequently, the PO2 distributions are used to calculate local FMISO binding rates. Binding rates are modeled to increase with decreasing PO2, up to a sharp drop at very low PO2. This drop accounts for cell death under extreme oxygen and glucose deprivation. In this way it is considered that FMISO is reduced in vital cells only. These assumptions agree qualitatively with Pimonidazole IHC in SCCHN xenografts [Citation15]. Finally, by applying the PO2-dependent local binding rates, FMISO supply, diffusion and retention are simulated in the same vessel map as the PO2. By integrating the simulated FMISO concentrations in a specific sub-region, pseudo-PET voxel signals can be derived at different timepoints pi. Dividing these signals by the blood tracer concentration yields tumor-to-blood (T:B) ratios.
Simulated macroscopic O2 and FMISO parameters
In each sub-region the median oxygen partial pressure (medianPO2) was calculated. Two simulated FMISO parameters were calculated in each sub-region: 1) the mean FMISO concentration four hours pi, FH = c(t = 4 h pi); and 2) the ratio between FH and the average concentration 0–15 minute pi, FH/P = c(t = 4 h pi)√c(t)0–15min. The second parameter can be interpreted as a measure of hypoxia-related tracer retention that is normalized by a simple measure of perfusion [Citation16]. In this way, severely hypoxic regions containing much necrosis, in which small amounts of FMISO are retained, may nonetheless be correctly identified as having a low medianPO2, as they are typically poorly perfused as well.
Correlations between oxygenation and FMISO PET
Scatter plots of medianPO2 against FH as well as FH/P were created. Furthermore, a correlation analysis was performed between medianPO2 and the FMISO parameters. Coefficients of determination R² were calculated in a linear sense (Pearson coefficient) and from non-linear fits.
Hypoxic sub-regions were segmented from all sub-regions by applying various thresholds to the simulated FMISO parameters. This emulates the method commonly used to identify hypoxia in FMISO PET images. In a receiver operating characteristic (ROC) analysis it was assessed how reliably sub-regions with a medianPO2 below 2.5 mmHg can be identified when this method is applied to FH and FH/P. In ROC curves, the true positive rate (tpr = sensitivity) was plotted against the false positive rate (fpr = 1-specificity). The applied FMISO thresholds decrease along the curves. The area under the curves (AUC) and the Youden index (YI = tpr-fpr) were calculated as quality measures. Their values may range from 0.5 to 1 and 0 to 1 (no predictive value to strong predictive value), respectively. In a further step, the ROC analysis was also used to evaluate how well the FMISO parameters characterize the microPO2 values on the cellular level. In this case, each parameter represents a 60 × 60 matrix of underlying PO2 values.
Results
Simulated oxygenations
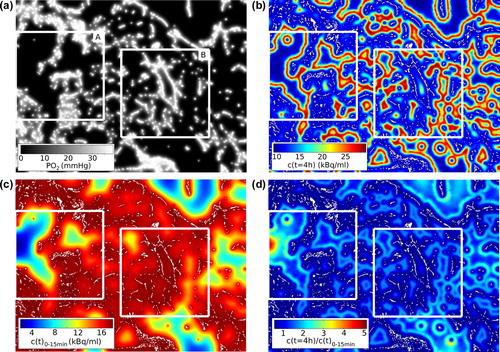
Full simulations were performed for the five vessel maps. An example for a simulated equilibrium PO2 distribution and the corresponding static FMISO micropattern four hours pi is shown in . The median microPO2 value of all maps was 10.0 mmHg and ranged from 0.0 mmHg to 40.0 mmHg. The microPO2 was calculated with a spatial resolution of 50 μm/pixel, which is comparable to Eppendorf electrodes [Citation3]. Histograms of the microPO2 within four selected sub-regions show distinct oxygenation patterns (Supplementary Figure 2 available online at http://informahealthcare.com/doi/abs/10.3109/0284186X.2013.812796). The simulated sub-regional medianPO2 ranged from 8 × 10⁻³ mmHg to 33.8 mmHg with a median of 7.0 mmHg.
Figure 1. (a) Steady state PO2 distribution for a 5.3 × 3.9 mm2 vessel map including two randomly placed 2 × 2 mm2 sub-regions (A, B). (b) Corresponding distribution of FMISO 4 h pi. Sub-regional averaging yields FH. Note the increasing retention with decreasing PO2 until it is diminished by necrosis. Vessels are white. (c) Averaged early FMISO signal. (d) Ratio between the distributions shown in (b) and (c) yields FH/P. The medianPO2 is substantially lower in sub-region A (9.4 × 10⁻³ mmHg) than in B (7.1 × 10⁻¹ mmHg). Inconsistently, FH is lower in A (15.0 kBq/ml) than in B (16.4 kBq/ml). FH/P is higher in A (1.05) than in B (1.00) and thus is consistent with medianPO2.
Correlations between oxygenation and FMISO PET
In a scatter plot of medianPO2 against FH is shown. Each point represents a data pair from a specific sub-region. A high overall linear correlation coefficient R2 of 0.95 was observed. This value reduces to 0.37 when the analysis is restricted to data pairs in the hypoxic range (i.e. medianPO2 < 10 mmHg). However, a high accuracy is especially important in this range. In it is demonstrated for two selected sub-regions that the low FMISO retention in regions with a large amount of necrosis is an important reason for the low correlation between FH and medianPO2 in hypoxic tissue.
Figure 2. Scatter plots of medianPO2 against (a) FH and (b) FH/P. Red lines are fits restricted to hypoxic sub-regions (medianPO2 < 10 mmHg). Coefficients of determination R² for the restricted fits indicate a low correlation between medianPO2 and FH and a high correlation between medianPO2 and FH/P.
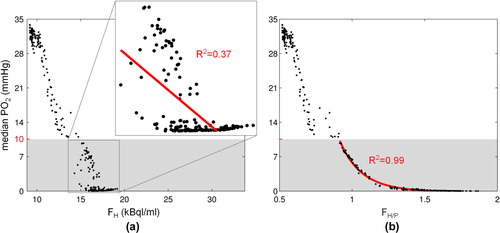
A plot of the medianPO2 against the perfusion-normalized FMISO parameter FH/P is shown in . By visual inspection a well-defined non-linear relationship was found, especially in the hypoxic range. This was corroborated by fitting the function f(x) = p1/(p2 + x)p3 + p4 to the data. The resulting fit coefficients were [p1, p2, p3, p4] = [568 mmHg, 0.575, 10.0, −0.210 mmHg]. A coefficient of determination R2 between medianPO2 and FH/P of 0.98 was found for the overall data and of 0.99 for the data in the hypoxic range. This suggests that FH/P is a more accurate measure of the medianPO2 than FH.
ROC analysis
The ROC analysis of the diagnostic accuracies of the simulated FMISO parameters to identify hypoxia is shown in . Clearly, sub-regions with a critical medianPO2 below 2.5 mmHg are discriminated extremely well by FH/P (AUC = 1.0, optimum YI = tpr-fpr = 1.0), while FH alone is less reliable (AUC = 0.97, YI = 0.83). The optimum threshold values were FH/P = 1.1 and FH = 16.1 kBq/ml (T:B = 1.8).
Figure 3. Receiver operating characteristic of FH/P (gray curves) and FH (black curves) for the identification of hypoxia. Solid lines refer to the identification of a medianPO2 < 2.5 mmHg in macroscopic sub-regions. Dashed lines refer to the identification of microPO2 < 2.5 mmHg in the 60 × 60 PO2 values underlying each FMISO parameter. Cut-off values applied to the FMISO parameters decrease along the curves from left to right. Optimum points are marked. The identification of critical medianPO2 is very sensitive and specific using FH/P (optimum YI = 1.0). Using FH is less effective (YI = 0.83). Both parameters are moderately accurate in identifying critical microPO2 values (YI = 0.63 and 0.60).
The ROC analysis with regard to the identification of microscopic hypoxia (microPO2) based on the macroscopic FMISO parameters gave a slightly different picture. It resulted in AUC (optimum YI) of 0.88 (0.63) and 0.86 (0.60) for FH/P and FH, respectively. These values are considerably lower than for the identification of sub-regions with a critical macroscopic medianPO2 based on either of the FMISO parameters. Here, the optimum threshold values were FH/P = 1.0 and FH = 15.5 kBq/ml (T:B = 1.7).
Discussion
The results of this study outline how the fundamental limitations of FMISO PET imaging affect its value as a measure of the PO2 in a voxel. The first limitation is that a macroscopic imaging modality is used to image hypoxia, which is a microscopic phenomenon. Therefore, the measured signal is an average over a very heterogeneous distribution of hypoxia levels on the microscopic length scale. Another important aspect is the ambiguous binding behavior of the FMISO molecule: it shows a low accumulation in severely hypoxic regions containing a large amount of necrosis. As a consequence, these regions cannot be distinguished from well-oxygenated regions in FMISO PET images acquired during the tracer uptake phase. These limitations have also been observed in preclinical tumor models using 18F-Fluoroazomycin Arabinoside (FAZA) autoradiography and Pimonidazole IHC [Citation17].
Here, a method was proposed to compensate the deficient tracer accumulation due to necrosis by incorporating supplementary information. For this purpose, the simulated PET signal during the FMISO wash-in phase (0–15 minute pi) was used, as it characterizes the vessel network in a voxel and therefore identifies poorly perfused voxels independently of the FMISO accumulation (cf. ). The results show, that the proposed combined parameter FH/P is a much more accurate measure of the medianPO2 than the uptake parameter FH alone. This indicates that FH/P characterizes the tissue microenvironment in a similar manner as measurements with oxygen probes. However, FMISO PET imaging overcomes the limitation of oxygen probes of sampling the PO2 in small parts of a tumor only. These results corroborate a preclinical study correlating optical oxygen probe measurements with FMISO PET imaging, in which severely hypoxic voxels with low PO2 readings presented low FMISO intensities two hours pi [Citation9].
The large range of oxygenation levels that are averaged in a PET voxel signal cannot be recovered. This is demonstrated by the relatively low diagnostic accuracy of FH as well as FH/P with respect to the identification of microPO2 values below 2.5 mmHg. The accuracies simulated in this work are comparable to results from a preclinical study analyzing FMISO PET signals and oxygen probe readings on a voxel-by-voxel basis [Citation10]. A moderate accuracy was reported for the identification of microPO2 values below 2.5 mmHg using the two hour pi equivalent to FH acquired with a sub-millimeter resolution. As fully dynamic FMISO PET was performed in this study, the method offers a potential to validate the theoretical results of the present work.
Quantitative aspects of the results must be interpreted with great care. In a clinical setting, the correlations and diagnostic accuracies presumably are substantially lower than estimated here. There are a number of reasons for this. For instance, the achievable resolution in clinical PET imaging is lower than the edge length of 2 mm of the simulated sub-regions. Inter-patient variations of the tracer pharmacokinetics, such as tracer clearance and metabolite forming, also have an influence. Furthermore, image noise was not included in the analysis and simulations were performed in 2D. Though, as these factors influence FH and FH/P alike, the general conclusion holds that the perfusion-normalized uptake parameter FH/P is a more accurate measure of the medianPO2 than the uptake parameter FH alone.
The early acquisition interval of 0–15 minutes has not been varied in this study. It is well possible that a shorter scan provides identical information. The length and position of the interval can be optimized in a preclinical validation study combining spatially co-registered dynamical FMISO PET and oxygen probe measurements, which is technologically feasible [Citation10]. A validation of the presented results is moreover needed, because not every biological effect can be accounted for by the simulation model. For example, the proposed parameter FH/P may be less accurate when tissue perfusion and hypoxia levels are uncoupled. This situation may arise in tissue regions that are dominated by hemoglobin deficient plasma flow. Such regions can be very hypoxic (high FMISO retention) and at the same time well perfused (high wash-in signal).
Incorporating the wash-in phase FMISO PET signal does not only allow to compensate the low tracer accumulation in severely hypoxic voxels, it may also yield a prediction of the development of the hypoxic microenvironment during RT, e.g. the reoxygenation potential of a tissue region [Citation18]. This could explain why clinical results indicate that optimum timepoints for isolated uptake imaging might lie weeks into the course of therapy [Citation6,Citation19]. In contrast, a full kinetic analysis of dynamic FMISO PET data allows the estimation of treatment outcome prior to the initiation of RT [Citation16]. The parameter FH/P proposed here was designed to capture the essential information of dynamic FMISO PET imaging, i.e. the independent information from the tracer wash-in as well as the uptake phase, yet avoiding the complex acquisition and analysis of fully dynamic data. However, potential issues arising from patient repositioning between the two PET scans and subsequent image co-registration remain. Should this compromise the usefulness of the proposed method, moving the patient off the table between scans may be avoided by obtaining a perfusion measure from a 15O-Water PET scan or a suitable MRI or DCE CT protocol in a combined scanner.
Conclusions
In this study, tissue oxygenations and FMISO diffusion-retention dynamics were computationally simulated. The correlation between simulated partial oxygen pressures and different FMISO PET parameters was analyzed. The results show that the medianPO2 in a PET voxel can be assessed with high accuracy by combining independent information from early (0–15 minutes pi) and late (four hours pi) FMISO PET scans. Using a late scan only is less accurate. Both methods recover the oxygenation on the cellular level with moderate accuracy.
Supplementary Figures 1–2
Download PDF (1.9 MB)Declaration of interest: The authors report no conflicts of interest. The authors alone are responsible for the content and writing of the paper.
This project was financially supported by the German Research Foundation (DFG), grant no. TH 1528/1-1 and by the European Social Fund and the Ministry of Science, Research and the Arts Baden-Württemberg.
References
- Höckel M, Schienger K, Aral B, Milze M, Schäffer U, Vaupel P. Association between tumor hypoxia and malignant progression in advanced cancer of the uterine cervix. Cancer Res 1996;56:4509–15.
- Nordsmark M, Bentzen SM, Rudat V, Brizel D, Lartigau E, Stadler P, et al. Prognostic value of tumor oxygenation in 397 head and neck tumors after primary radiation therapy. An international multi-center study. Radiother Oncol 2005;77:18–24.
- Griffiths JR, Robinson SP. The OxyLite: A fibre-optic oxygen sensor. Br J Radiol 1999;72:627–30.
- Thorwarth D, Eschmann SM, Paulsen F, Alber M. Hypoxia dose painting by numbers: A planning study. Int J Radiat Oncol Biol Phys 2007;68:291–300.
- Toma-Daşu I, Uhrdin J, Antonovic L, Daşu A, Nuyts S, Dirix P, et al. Dose prescription and treatment planning based on FMISO-PET hypoxia. Acta Oncol 2012;51:222–30.
- Zips D, Zöphel K, Abolmaali N, Perrin R, Abramyuk A, Haase R, et al. Exploratory prospective trial of hypoxia- specific PET imaging during radiochemotherapy in patients with locally advanced head-and-neck cancer. Radiother Oncol 2012;105:21–8.
- Mortensen LS, Johansen J, Kallehauge J, Primdahl H, Busk M, Lassen P, et al. FAZA PET/CT hypoxia imaging in patients with squamous cell carcinoma of the head and neck treated with radiotherapy: Results from the DAHANCA 24 trial. Radiother Oncol 2012;105:14–20.
- Horsman MR, Mortensen LS, Petersen JB, Busk M, Overgaard J. Imaging hypoxia to improve radiotherapy outcome. Nat Rev Clin Oncol 2012;9:674–87.
- Chang J, Wen B, Kazanzides P, Zanzonico P, Finn RD, Fichtinger G, et al. A robotic system for [18F]-FMISO PET-guided intratumoral pO2 measurements. Med Phys 2009;36:5301–9.
- Bartlett RM, Beattie BJ, Naryanan M, Georgi J-C, Chen Q, Carlin SD, et al. Image-guided Po2 probe measurements correlated with parametric images derived from 18F- fluoromisonidazole small-animal PET data in rats. J Nucl Med 2012;53:1608–15.
- Mortensen LS, Buus S, Nordsmark M, Bentzen L, Munk OL, Keiding S, et al. Identifying hypoxia in human tumors: A correlation study between 18F-FMISO PET and the Eppendorf oxygen-sensitive electrode. Acta Oncol 2010;49:934–40.
- Mönnich D, Troost EGC, Kaanders JHAM, Oyen WJG, Alber M, Thorwarth D. Modelling and simulation of [18F]fluoromisonidazole dynamics based on histology-derived microvessel maps. Phys Med Biol 2011;56:2045–57.
- Bussink J, Kaanders JHAM, Rijken PFJW, Raleigh JA, Van der Kogel AJ. Changes in blood perfusion and hypoxia after irradiation of a human squamous cell carcinoma xenograft tumor line. Radiat Res 2000;153:398–404.
- Casciari JJ, Sotirchos SV, Sutherland RM. Variations in tumor cell growth rates and metabolism with oxygen concentration, glucose concentration, and extracellular pH. J Cell Physiol 1992;151:386–94.
- Ljungkvist ASE, Bussink J, Kaanders JHAM, Rijken PFJW, Begg AC, Raleigh JA, et al. Hypoxic cell turnover in different solid tumor lines. Int J Radiat Oncol Biol Phys 2005;62: 1157–68.
- Thorwarth D, Eschmann S-M, Scheiderbauer J, Paulsen F, Alber M. Kinetic analysis of dynamic 18F-fluoromisonidazole PET correlates with radiation treatment outcome in head-and-neck cancer. BMC Cancer 2005;5:152.
- Busk M, Horsman MR, Overgaard J. Resolution in PET hypoxia imaging: Voxel size matters. Acta Oncol 2008;47:1201–10.
- Thorwarth D, Eschmann S-M, Paulsen F, Alber M. A model of reoxygenation dynamics of head-and-neck tumors based on serial 18F-fluoromisonidazole positron emission tomography investigations. Int J Radiat Oncol Biol Phys 2007;68:515–21.
- Eschmann SM, Paulsen F, Bedeshem C, Machulla H-J, Hehr T, Bamberg M, et al. Hypoxia-imaging with 18F-Misonidazole and PET: Changes of kinetics during radiotherapy of head-and-neck cancer. Radiother Oncol 2007;83:406–10.