Abstract
Introduction. Therapy-induced injury to normal brain tissue is a concern in the treatment of all types of brain tumours. The purpose of this study was to investigate if magnetic resonance diffusion tensor imaging (DTI) could serve as a potential biomarker for the assessment of radiation-induced long-term white matter injury. Material and methods. DTI- and T1-weighted images of the brain were obtained in 19 former radiotherapy patients [nine men and 10 women diagnosed with astrocytoma (4), pituitary adenoma (6), meningioma (8) and craniopharyngioma (1), average age 57.8 (range 35–71) years]. Average time from radiotherapy to DTI scan was 4.6 (range 2.0–7.1) years. NordicICE software (NIC) was used to calculate apparent diffusion coefficient maps (ADC-maps). The co-registration between T1 images and ADC-maps were done using the auto function in NIC. The co-registration between the T1 images and the patient dose plans were done using the auto function in the treatment planning system Eclipse from Varian. Regions of interest were drawn on the T1-weighted images in NIC based on isocurves from Eclipse. Data was analysed by t-test. Estimates are given with 95% CI. Results. A mean ADC difference of 4.6(0.3;8.9)× 10−5 mm2/s, p = 0.03 was found between paired white matter structures with a mean dose difference of 31.4 Gy. Comparing the ADC-values of the areas with highest dose from the paired data (dose > 33 Gy) with normal white matter (dose < 5 Gy) resulted in a mean dose difference of 44.1 Gy and a mean ADC difference of 7.87(3.15;12.60)× 10−5 mm2/s, p = 0.003. Following results were obtained when looking at differences between white matter mean ADC in average dose levels from 5 to 55 Gy in steps of 10 Gy with normal white matter mean ADC: 5 Gy; 1.91(−1.76;5.58)× 10−5 mm2/s, p = 0.29; 15 Gy; 5.81(1.53;10.11)× 10−5 mm2/s, p = 0.01; 25 Gy; 5.80(2.43;9.18)× 10−5 mm2/s, p = 0.002; 35 Gy; 5.93(2.89;8.97)× 10−5 mm2/s, p = 0.0007; 45 Gy; 4.32(−0.24;8.89)× 10−5 mm2/s, p = 0.06; 55 Gy; −4.04(−14.96;6.89)× 10−5 mm2/s, p = 0.39. Conclusion. The results indicate that the structural integrity of white matter, assessed by ADC-values based on DTI, undergoes changes after radiation therapy starting as early as total dose levels between 5 and 15 Gy.
Radiation therapy (RT) is an important treatment modality for both benign and malignant tumours of the central nervous system. The goal of treatment is to deliver a maximum radiation effect to a tumour with minimal effect on normal tissue. Late delayed radiation injury is irreversible but the understanding of its development and the possibility to quantify the amount of injury is still limited [Citation1–3]. Although not fully understood, the mechanisms of the late effects is believed to include vascular damage, white matter injury and coagulation necrosis [Citation3,Citation4]. The use of magnetic resonance imaging (MRI) to characterise late radiation changes is relatively new. Radiation-induced MRI changes, such as T2 signal abnormality, are non-specific and can be seen in a variety of processes including oedema, demyelination and necrosis. Furthermore, central nervous system injury after RT may be present despite a normal appearing MRI [Citation1]. Diffusion-weighted imaging is a promising MRI modality when it comes to describing response to RT [Citation5–8] and damage to normal tissue [Citation9–11]. In diffusion-weighted MRI the MR signal reflect changes in mobility of water molecules in tissue. This mobility, classically called Brownian motion, is due to thermal agitation and is highly influenced by the cellular environment of water [Citation7,Citation12,Citation13]. The structure of the tissue greatly influences whether the diffusion can be characterised as isotropic (hindrance or restriction is the same in all directions) or anisotropic (hindrance or restriction is not the same in all directions) [Citation14]. White matter in the brain is organised in large fibre bundles consisting of parallel myelinated fibres which make the tissue anisotropic. Diffusion tensor imaging (DTI) represents a further development of diffusion-weighted imaging measuring both direction and magnitude of water diffusion [Citation15]. DTI is regarded the most sensitive diffusion imaging technique to identify white matter abnormalities and it can detect abnormalities well before structural changes are visible with any other imaging method [Citation9,Citation10].
The purpose of this study was to investigate if DTI could serve as a potential biomarker for the assessment of radiation-induced long-term white matter injury. We hypothesised that in brain tumour patients treated with RT, radiation causes dose dependent progressive loss of structural integrity in white matter.
Material and methods
Patients
Forty-six former patients who had undergone radiotherapy towards the brain in the period 2004–2010 were invited to participate. The study was approved by the local Ethics Committee and the Danish Data Protection Agency. Each patient provided informed written consent prior to inclusion.
MR imaging
MRI data acquisition was performed using a 3T MR scanner (Signa HDx R14M5, GE Healthcare, Milwaukee, WI, USA). The MRI protocol included a T1-weighted axial 3D BRAVO fast spoiled gradient echo (FSPGR) sequence (TR = 10.864 ms, TE = 4.58 ms, FOV = 240 × 240 mm2, matrix 352 × 224, slice thickness = 1.2 mm, scantime 4:30 minutes) and a diffusion-weighted spin echo echo-planar imaging (SE-EPI) sequence axial 2D DTI (TR = 9000 ms, TE = 105 ms, isotropic voxel size of 2.4 × 2.4 × 2.4 mm3, scantime 5:42 minutes) with 32 gradients and two b-values (0 and 1300 s/mm2).
This MRI protocol is comparable to the protocol used by Catani et al. when creating their atlas of tractography [Citation16], and was already implemented at our Department of Neurosurgery.
Post processing
Apparent diffusion coefficient maps (ADC-maps) were generated based on the eigen values of the tensor in each voxel using NordicICE (version 2.3.11, NordicImagingLab, Bergen Norway).
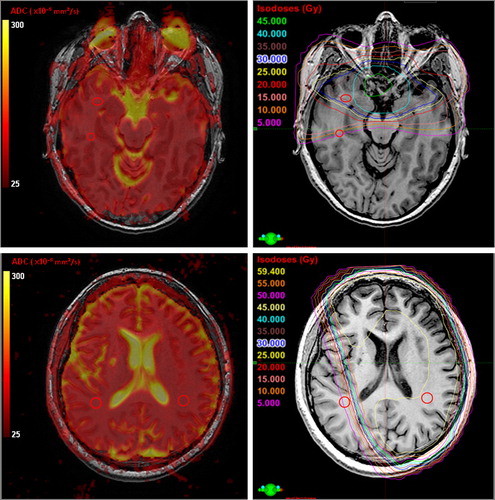
The ADC-maps were co-registered to the morphological 3D BRAVO images using the automatic co-registration in NordicICE. The co-registration was visually inspected before approval. The BRAVO sequences were then co-registered to the patients’ dose plans using the auto function in the dose-planning system (Eclipse Registration module, Varian). Again all co-registrations were visually inspected before approval. Three sets of regions of interest (ROIs) were defined on the BRAVO-images in NordicICE based on the isocurves projected on the BRAVO-images in the dose-planning system: 1) Normal appearing white matter in an area with less than 5 Gy; 2) High (dose > 33 Gy) and low (dose < 33 Gy) dose ROIs in paired or parallel white matter structures (); 3) ROIs in normal appearing white matter at dose levels 0–10(5), 10–20(15), 20–30(25), 30–40(35), 40–50(45) and 50–60(55) Gy. The ROI size is based on a standard ROI of 66 mm2 circle which equals 11 voxels. The standard ROI is then reduced in each case to the largest circular/oblong ROI that fit the white matter area between the relevant dose lines. The standard ROI is placed with centre on the relevant dose level, e.g. 15 Gy and then reduced to fit between the lower (10 Gy) and the upper (20 Gy) dose line limits. In order to get as close to the standard ROI area of 66 mm2 as possible the ROIs were positioned in white matter areas on the BRAVO-images where the distance between the dose lines were as big as possible. ROIs were positioned with consideration of avoiding areas with susceptibility artefacts and distortions (e.g. areas near air cavities and compact bone) within the ADC-maps.
Figure 1. Top row: patient with pituitary adenoma, example of ROI placement in parallel white matter areas. The ROI size is based on a 66 mm2 circle, reduced in each case to the largest circular/oblong ROI that fit the white matter area between the relevant dose lines. Bottom row: patient with astrocytoma grade III, example of ROI placement in paired white matter areas. Left column: ADC-map placed as an unsmoothed overlay on T1 weighted images. Right column: Dose plan with absolute dose in steps of 5 Gy placed as an overlay on the T1 weighted images.
Finally the ADC-maps were placed as an overlay on the BRAVO images including the applied ROIs and the ADC data within each ROI were obtained.
Data analysis
Although a quantitative parameter the ADC value should be used with consideration. The ADC value varies among other parameters with the choice of b-values [Citation13,Citation17], scanner vendor [Citation18] and patient age [Citation19–21]. By using the same scanner throughout the study and looking at ADC-differences among the patients instead of absolute values these confounding factors are minimised. ADC also varies in the different white matter areas of the brain [Citation22]. This was accounted for by an analysis of paired/parallel white matter areas exposed to high and low dose of radiation.
Data was analysed by t-test. Estimates are given with 95% confidence intervals and 2-sided p-values.
Results
Nineteen patients agreed to participate [nine men and 10 women, average age 57.8 (range 35–71) years]. Five different diagnoses were represented (). Average time from radiation to DTI MRI scan was 4.6 (range 2.0–7.1) years.
Table I. Diagnosis and treatment overview of the included patients.
A mean ADC difference of 4.6(0.3;8.9)× 10−5 mm2/s, p = 0.03 was found between paired white matter structures with a mean dose difference of 31.4 Gy (). Although not significant the same trend where seen when looking at the maximum and the minimum ADC values (p = 0.06 and p = 0.17, respectively). A mean ADC difference of 7.5(2.6;12.4)× 10−5 mm2/s, p = 0.005 was found when comparing the mean ADC values of the areas with highest dose from the paired data with mean ADC values of the areas with normal white matter. The mean dose difference was 44.4 Gy. The same trend, although not significant, was observed when comparing the mean ADC values of the areas of lowest dose from the paired data with the mean ADC values of the areas with normal white matter p = 0.21.
Table II. ADC and dose differences between paired white matter structures at unequal total radiation dose levels.
shows the differences between mean ADC values in normal white matter compared to white matter at different isodose levels. The number of patients is not the same at each isodose level, because of the heterogeneity of the patient group At dose level 35 Gy the patient group is reduced with one meningioma patient and at dose level 45 Gy the patient group is reduced with additional; one astrocytoma, two pituitary adenoma and one craniopharyngiom patient. At dose level 55 Gy the patient group only consists of three astrocytoma and three meningioma patients. According to this the mean ADC in normal white matter differs between the patient groups present at the different dose levels (71.92–73.30 × 10⁻⁵ mm2/s).
Table III. Comparison of mean ADC-values in normal white matter and normal appearing white matter at different total radiation dose levels to the brain.
The boxplots in shows the relationship between the mean ADC values. There is a significant difference () between normal white matter mean ADC and normal appearing white matter mean ADC at dose level 15, 25 and 35 Gy of about 8%. Although not statistically significant the trend is the same at dose level 45 Gy. The same pattern is seen when looking at minimum ADC and maximum ADC within the ROIs (data not illustrated).
Figure 2. Boxplot of mean ADC (× 10−5 mm2/s) for normal white matter (radiation total dose 0 Gy) and the irradiated normal appearing white matter (radiation total dose 5–55 Gy).
At dose level 55 Gy the mean ADC seems to drop below mean ADC of normal white tissue (not statistically significant). There is only six patients left in this group; three meningioma patients with mean ADC of 72.78 × 10⁻⁵ mm2/s (range 66.68–80. 10 × 10−5 mm2/s) with an increase of 2.83 (−4.69; 10.35)× 10−5 mm2/s in mean ADC when comparing with normal ADC for these three patients and three astrocytoma patients with mean ADC of 65.74 × 10⁻⁵ mm2/s (range 62.43–69.3 × 10⁻⁵ mm2/s) with a decrease of −11.0(−38.1;16.3)× 10−5 mm2/s in mean ADC when comparing with normal ADC for these three patients. Again the same pattern is seen when looking at minimum ADC and maximum ADC within the ROIs (data not illustrated).
It was not possible to find comparable paired regions in the white matter structures when looking at the wide span of dose levels from 5 to 55 Gy. However the differences between mean ADC in the paired analysis () is within the range of the differences in mean ADC found in the dataset of continuous dose levels ().
Discussion
This study shows that ADC values calculated on the basis of DTI are able to detect diffusion differences in normal appearing white tissue as a late effect to radiation therapy.
Although not directly comparable as described in the data analysis section the absolute mean ADC values in this study is within range of values reported by others [Citation20–22]. A mean ADC increase of 8% compared to normal white matter tissue was detectable from total radiation dose levels of 15–45 Gy. This increase in mean ADC corresponds well with previously reported histopathologic findings of post-irradiation diffuse white matter injury such as reactive astrocytosis, oedema or demyelination [Citation4,Citation23]. The mean increase in ADC-value seemed rather constant in the interval of 15–45 Gy which could indicate a threshold dose for the observed changes.
At 55 Gy the mean ADC seemed to decrease indicating restricted diffusion. Only data from six patients were obtained at this dose level – three patients with astrocytoma and three patients with meningioma. It seemed that it was the astrocytoma patients who solely contributed to the decrease in ADC. At the dose level of 55 Gy, data was obtained within the volume defined as target in the radiation dose plan. Although the ROIs were placed in normal appearing white matter, there is relatively high risk of infiltrative tumour growth in astrocytoma patients. Such hypercellularity would explain the observed decrease in mean ADC [Citation5,Citation7,Citation24]. One of the astrocytoma patients had a mean ADC in normal appearing white matter in an area with less than 5 Gy (normal tissue) of 88.5 × 10⁻⁵ mm2/s and a mean ADC of 65.5 × 10⁻⁵ mm2/s in normal appearing white matter at dose 55 Gy (a ADC reduction of 26%). The patient experienced clinical relapse three months after the DTI scan. The relapse was considered to be a further progression of the tumour from astrocytoma grade III to glioblastoma multiforme and was diagnosed 7.5 years after RT. Another of the patients had a mean ADC in normal tissue of 70.5 × 10⁻⁵ mm2/s and a mean ADC of 62.4 × 10⁻⁵ mm2/s in normal appearing white matter at dose 55 Gy (a ADC reduction of 11%). The patient experienced clinical relapse 1.5 years after the DTI scan. This was believed to be a further development of the astrocytoma grade III and was diagnosed six years after RT. The last astrocytoma patient was diagnosed and received RT two years prior to the DTI scan. This patient had a mean ADC in normal tissue of 71.0 × 10⁻⁵ mm2/s and a mean ADC of 69.3 × 10⁻⁵ mm2/s in normal appearing white matter at dose 55 Gy (a ADC reduction of 2). This indicates that DTI could have the potential as an early predictor for tumour recurrence. This should be explored further in future studies.
In the study by Nagesh et al. [Citation9] a nine gradient DTI with b-values (0 and 1000 s/mm2) at 1.5T was used to determine acute and sub-acute radiation-induced changes in normal appearing white matter fibres (genu and splenium of the corpus callosum) in patients with cerebral tumours. This study demonstrated that the mean ADC increased linearly and significantly with time to a point of 18% 45 weeks after start of RT which was the end of follow-up. In the present study the late effects to white matter mean ADC were in the range of 8–10% with an average time from radiation to the DTI scan of 4.6 years. This indicates that the radioresponse of white matter tissue in the brain is a dynamic process which is in good accordance with other studies [Citation25].
The changes of 8–10% in ADC found in this study are relatively small. This makes the results rather sensitive to noise. Although the SS-EPI technique has a high signal to noise ratio (SNR) per unit of scanning time, the use of high b-values in diffusion-weighted imaging makes the technique more SNR-limited than conventional MR imaging such T2-weighted imaging. To boost the SNR it is common practice to repeat acquisition of the same DWIs (increasing NEX) or as in the current study apply more gradients to the DTI. It has been shown that applying 32 gradient directions at 1.5 T makes a robust estimation of mean ADC which is reproducible within 2.6% [Citation26].
Another thing to consider is the precision at which the different image sequences were co-registered. For each patient the DTI and the BRAVO sequences were obtained in the same scan session. This reduces the risk of co-registration inaccuracy considerably. No mismatch was registered at the visual inspection prior to co-registration approval. The BRAVO sequence was also co-registered to the CT-based dose plan. The mismatch was visually assessed to be in the range of 1–2 mm. To reduce the influence of such mismatch the ROIs were attempted placed in areas with low dose gradients.
The use of DTI is a promising technique to assess radiation-induced white matter injury. Besides ADC-maps at a higher resolution than common DWI, DTI provides a wide range of diffusion-related parameters such as fractional anisotropy (FA-maps) which provides information about the main diffusion direction of each voxel [Citation7,Citation11,Citation15] and tensor eigen values (λ-maps) which can help differentiate between white matter axonal injury or demyelination [Citation9]. In order to interpret these parameters a Pre-RT DTI scan is needed, as the interstructural white matter variation in the parameters is relatively high [Citation22].
In conclusion ADC-values based on DTI seem to have the potential to serve as a biomarker for the assessment of radiation-induced long-term white matter injury. Further studies are needed to evaluate the clinical value of the method.
Declaration of interest: Supported by CIRRO – The Lundbeck Foundation Center for Interventional Research in Radiation Oncology and The Danish Council for Strategic Research. The authors report no conflicts of interest. The authors alone are responsible for the content and writing of the paper.
References
- Kelsey CR, Mukundan S Jr, Wang Z, Hahn CA, Soher BJ, Kirkpatrick JP. Assessing neurotoxicity from the low-dose radiation component of radiosurgery using magnetic resonance spectroscopy. Neuro Oncol 2010;12:145–52.
- New P. Radiation injury to the nervous system. Curr Opin Neurol 2001;14:725–34.
- Shih HA, Loeffler JS, Tarbell NJ. Late effects of CNS radiation therapy. Cancer Treat Res 2009;150:23–41.
- Schultheiss TE, Kun LE, Ang KK, Stephens LC. Radiation response of the central nervous system. Int J Radiat Oncol Biol Phys 1995;31:1093–112.
- Ellingson BM, Malkin MG, Rand SD, Connelly JM, Quinsey C, LaViolette PS, et al. Validation of functional diffusion maps (fDMs) as a biomarker for human glioma cellularity. J Magn Reson Imaging 2010;31:538–48.
- Hamstra DA, Rehemtulla A, Ross BD. Diffusion magnetic resonance imaging: A biomarker for treatment response in oncology. J Clin Oncol 2007;25:4104–9.
- Padhani AR, Liu G, Koh DM, Chenevert TL, Thoeny HC, Takahara T, et al. Diffusion-weighted magnetic resonance imaging as a cancer biomarker: Consensus and recommendations. Neoplasia 2009;11:102–25.
- Thoeny HC, Ross BD. Predicting and monitoring cancer treatment response with diffusion-weighted MRI. J Magn Reson Imaging 2010;32:2–16.
- Nagesh V, Tsien CI, Chenevert TL, Ross BD, Lawrence TS, Junick L, et al. Radiation-induced changes in normal- appearing white matter in patients with cerebral tumors: A diffusion tensor imaging study. Int J Radiat Oncol Biol Phys 2008;70:1002–10.
- Nazem-Zadeh MR, Chapman CH, Lawrence TL, Tsien CI, Cao Y. Radiation therapy effects on white matter fiber tracts of the limbic circuit. Med Phys 2012;39:5603–13.
- Uh J, Merchant TE, Li Y, Feng T, Gajjar A, Ogg RJ, et al. Differences in brainstem fiber tract response to radiation: A longitudinal diffusion tensor imaging study. Int J Radiat Oncol Biol Phys 2013;86:292–7.
- Haack S, Pedersen EM, Jespersen SN, Kallehauge JF, Lindegaard JC, Tanderup K. Apparent diffusion coefficients in GEC ESTRO target volumes for image guided adaptive brachytherapy of locally advanced cervical cancer. Acta Oncol 2010;49:978–83.
- Kallehauge JF, Tanderup K, Haack S, Nielsen T, Muren LP, Fokdal L, et al. Apparent diffusion coefficient (ADC) as a quantitative parameter in diffusion weighted MR imaging in gynecologic cancer: Dependence on b-values used. Acta Oncol 2010;49:1017–22.
- Le BD. Molecular diffusion nuclear magnetic resonance imaging. Magn Reson Q 1991;7:1–30.
- Debnam JM, Schellingerhout D. Diffusion MR imaging of the brain in patients with cancer. Int J Mol Imaging 2011;2011:714021.
- Catani M, Thiebaut de SM. A diffusion tensor imaging tractography atlas for virtual in vivo dissections. Cortex 2008;44:1105–32.
- Le Bihan D. Molecular diffusion nuclear magnetic resonance imaging. Magn Reson Q 1991;7:1–30.
- Sasaki M, Yamada K, Watanabe Y, Matsui M, Ida M, Fujiwara S, et al. Variability in absolute apparent diffusion coefficient values across different platforms may be substantial: A multivendor, multi-institutional comparison study. Radiology 2008;249:624–30.
- Nusbaum AO, Tang CY, Buchsbaum MS, Wei TC, Atlas SW. Regional and global changes in cerebral diffusion with normal aging. AJNR Am J Neuroradiol 2001;22:136–42.
- Helenius J, Soinne L, Perkio J, Salonen O, Kangasmaki A, Kaste M, et al. Diffusion-weighted MR imaging in normal human brains in various age groups. AJNR Am J Neuroradiol 2002;23:194–9.
- Engelter ST, Provenzale JM, Petrella JR, DeLong DM, MacFall JR. The effect of aging on the apparent diffusion coefficient of normal-appearing white matter. AJR Am J Roentgenol 2000;175:425–30.
- Brander A, Kataja A, Saastamoinen A, Ryymin P, Huhtala H, Ohman J, et al. Diffusion tensor imaging of the brain in a healthy adult population: Normative values and measurement reproducibility at 3 T and 1.5 T. Acta Radiol 2010;51:800–7.
- Wang YX, King AD, Zhou H, Leung SF, Abrigo J, Chan YL, et al. Evolution of radiation-induced brain injury: MR imaging-based study. Radiology 2010;254:210–8.
- Bobek-Billewicz B, Stasik-Pres G, Majchrzak H, Zarudzki L. Differentiation between brain tumor recurrence and radiation injury using perfusion, diffusion-weighted imaging and MR spectroscopy. Folia Neuropathol 2010; 48:81–92.
- Tofilon PJ, Fike JR. The radioresponse of the central nervous system: A dynamic process. Radiat Res 2000;153:357–70.
- Mukherjee P, Chung SW, Berman JI, Hess CP, Henry RG. Diffusion tensor MR imaging and fiber tractography: Technical considerations. AJNR Am J Neuroradiol 2008;29:843–52.