Abstract
Purpose. The outcome of biologic image-guided radiotherapy depends on the definition of the biologic target. The purpose of the current work was to extract hyperperfused and hypermetabolic regions from dynamic positron emission tomography (D-PET) images, to dose escalate either region and to discuss implications of such image guided strategies. Methods. Eleven patients with soft tissue sarcomas were investigated with D-PET. The images were analyzed using a two-compartment model producing parametric maps of perfusion and metabolic rate. The two image series were segmented and exported to a treatment planning system, and biological target volumes BTVper and BTVmet (perfusion and metabolism, respectively) were generated. Dice's similarity coefficient was used to compare the two biologic targets. Intensity-modulated radiation therapy (IMRT) plans were generated for a dose painting by contours regime, where planning target volume (PTV) was planned to 60 Gy and BTV to 70 Gy. Thus, two separate plans were created for each patient with dose escalation of either BTVper or BTVmet. Results. BTVper was somewhat smaller than BTVmet (209 ± 170 cm3 against 243 ± 143 cm3, respectively; population-based mean and s.d.). Dice's coefficient depended on the applied margin, and was 0.72 ± 0.10 for a margin of 10 mm. Boosting BTVper resulted in mean dose of 69 ± 1.0 Gy to this region, while BTVmet received 67 ± 3.2 Gy. Boosting BTVmet gave smaller dose differences between the respective non-boost DVHs (such as D98). Conclusions. Dose escalation of one of the BTVs results in a partial dose escalation of the other BTV as well. If tumor aggressiveness is equally pronounced in hyperperfused and hypermetabolic regions, this should be taken into account in the treatment planning.
Positron emission tomography (PET), using the glucose analogue 18F-fluorodeoxyglucose (18F-FDG) as a tracer, can be used for detection of metastasis and prediction of therapy outcome for certain cancers such as in the head and neck using the standard uptake value; SUV [Citation1–3]. PET has been proposed as basis for dose escalation through dose painting by numbers or contours, for both non-small cell lung cancer [Citation4,Citation5] and head and neck cancer [Citation6,Citation7]. Local recurrence for these cancers frequently occurs in PET active regions, but to cover all tumor extensions multi-modality imaging is required [Citation8].
Dynamic contrast enhanced (DCE) imaging utilizes the image contrast formed by an intravenously administered contrast agent, which either is paramagnetic, often gadolinium-based [in the case of magnetic resonance imaging (MRI)] or radiopaque, iodine-based [in the case of computed tomography (CT)]. DCE imaging may be used to assess vascular features such as tumor perfusion [Citation9], which has shown a predictive role, e.g. cervical cancer [Citation10]. However, dynamic 18F-FDG-PET, where tissue accumulation of 18F-FDG is followed in space and time, has been shown to provide both estimates of perfusion and metabolism [Citation11,Citation12]. Thus, dynamic 18F-FDG-PET is a multiparametric imaging modality. As tumors may be a heterogeneous mass with respect to perfusion and metabolism, volumetric information on such tissue properties may have implications for the optimal dose distribution during radiation therapy [Citation13,Citation14].
There are ongoing radiotherapy trials where advanced medical imaging is used as basis for focal dose escalation in order to improved treatment outcome. These trials either employ conventional 18F-FDG-PET (non-small cell lung cancer) [Citation4] or functional MRI (prostate cancer) [Citation15], in particular, DCE-MRI. For the former, the hypermetabolic part of the tumor is boosted, while in the latter the hyperperfused part is boosted. In these single-modality imaging studies, the rationale for defining the boost regions was based on significant correlations between FDG-PET or DCE-MRI and pathology (for lung and prostate cancer, respectively), as pathology may be reflected in both elevated metabolism and perfusion. However, studies correlating multiparametric images with pathology are, to the best of our knowledge, lacking, and vital pathology may thus be missed if only a single imaging parameter is considered. Therefore, if both hypermetabolic and hyperperfused regions can be depicted in the same tumor, the question rises whether these regions overlap. Furthermore, if the regions do not overlap, what are the consequences with respect to dosage of the region that is not considered as a biologic target in the treatment planning? These issues are addressed in the present work.
In the current work, patients with soft tissue sarcoma have been examined with dynamic18F-FDG-PET prior to therapy. In an earlier work, we found distinct differences between derived images reflecting metabolism and perfusion for these patients [Citation16]. In the current work, we have used pharmacokinetic analysis to produce surrogate maps of metabolism and perfusion, where the maps were used as targets in biological image-guided dose escalation. The resulting maps were compared, and the dose distributions in the respective targets were evaluated.
Materials and methods
Patients and FDG-PET
This study comprised 11 patients with soft tissue sarcoma, and was approved by regional committee for research ethics. Written informed consent was obtained from all patients. The patients were examined at a Biograph 16 PET/CT-scanner (Siemens AG, Erlangen, Germany). The patient cohort and PET examinations have been comprehensively described in a previous study [Citation16]. Briefly, all patients were scanned in dynamic PET mode (duration 45 min) after intravenous injection of 18F-FDG. The dynamic FDG-PET (D-PET) images were used to derive pharmacokinetic maps, most notably of K1 (Perfusion), vp (Vascular fraction), k3 (Metabolic potential), and MRFDG (metabolic rate), using a standard two compartment model and custom made software in IDL (Exelis Visual Information Solutions, Boulder, USA).
Directly after the bolus injection the FDG is concentrated in the blood and the activity will display the vasculature [Citation17–20], largely depicted by K1. At late time points, the images will largely reflect metabolism, as depicted by MRFDG though the precise limiting factor is still unclear [Citation21–23].
Treatment planning
The K1 and MRFDG maps were segmented using Otsu's method, where islands smaller than six voxels were eliminated. The resulting binary masks were exported to the Oncentra treatment planning system (Nucletron – an Elekta Company, the Netherlands) together with corresponding PET/CT images. The gross tumor volume (GTV) was manually delineated in the PET/CT images. A clinical target volume (CTV) was generated from the GTV by adding a 5 mm isotropic margin. Finally, the PTV was generated from the CTV by adding a 1 cm isotropic margin. Hyperperfused and hypermetabolic biological target volumes (BTVs), BTVper and BTVmet, were generated based on the thresholded K1 and MRFDG maps, respectively. An isotropic margin of 1 cm (tentatively accounting for internal motion and setup) was used.
A seven-field IMRT plan was set up for a dose painting by contours regime, where PTV, excluding BTV, was prescribed to a mean dose of 60 Gy and either BTVper or BTVmet to a mean dose of 70 Gy. Thus, two separate plans were created for each patient with dose escalation of either BTVper or BTVmet. Organs at risk did not impose any restrictions on the resulting dose distributions. Dose volume histograms (DVHs) for PTV, BTVper and BTVmet were exported and further analyzed.
Analysis
All analysis was performed using IDL (Exelis Visual Information Solutions, Boulder, USA). Dice's similarity index was used as a measure of the overlap of two segmented maps X and Y: 2 × X ∩ Y/|X| × |Y| Mann-Whitney tests were used to assess differences in dose volume parameters. A significance level of 0.05 was chosen.
Results
The pharmacokinetic analysis of the D-PET images, resulting K1 and MRFDG maps in a representative axial plane of a tumor is shown together with the workflow for generating the two BTVs in . The derived BTVper and BTVmet (including a 10 mm margin) are also indicated. As seen, the tumor is not homogeneous with respect to the two pharmacokinetic parameters. Furthermore, the derived BTVper and BTVmet are not spatially co-localized. shows the dependence of Dice's similarity index (DSI) for BTVper and BTVmet on the clinical margin. As seen, patient-averaged DSI increases from 0.51 to 0.72 for an increase in margin from 0 to 10 mm. The latter margin gave mean volumes of 209 ± 170 cm3 and 243 ± 143 cm3 for BTVper and BTVmet, respectively (Supplementary Table I, to be found online at http://informahealthcare.com/ doi/abs/10.3109/0284186X.2013.813071). A margin of 10 mm is used in the following.
Figure 1. Target definition workflow: parametric images (top) produce respective threshold regions (middle), and clinical margins are applied (bottom). Perfusion is in green, metabolic rate in blue, and overlap in red.
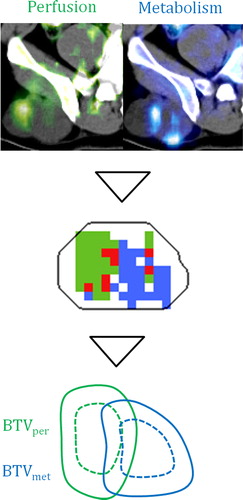
Figure 2. The Dice's similarity coefficient (DSI) between BTVper and BTVmet as a function of the clinical margin for each region.
Table I. Results from the dose planning given as median and range. The p-values results from of a Mann-Whitney test of the dose metrics in BTVper and BTVmet.
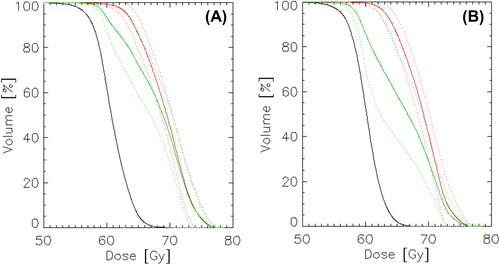
IMRT planning resulted in appropriate dose distributions in the target volumes for all patients and PTV-BTV combinations. shows two plans based on either boosting of BTVper or BTVmet for the patient showing the smallest DSI for these volumes. The boost dose region conforms to the respective BTV, making the dose to the non-boosted BTV rather low. Cohort-based mean DVHs were generated for PTV, BTVper and BTVmet based on the two boost plans (). The mean DVHs for the boosted and non-boosted volumes appear rather similar, in particular for the plan where BTVmet was boosted. Key dose parameters are reported in . For the plan where BTVper is dose escalated, significant differences were found between DVHs of BTVper and BTVmet. For instance, D98 was significantly lower in BTVmet. The corresponding cohort-based mean doses in BTVper and BTVmet was 69.0 ± 1.0 Gy and 67 ± 3.2 Gy, respectively. For the plan where BTVmet is dose escalated, there were smaller differences between the DVHs and the median doses were not statistical significant. The cohort-based mean doses in BTVmet and BTVper were in this case 69.0 ± 1.0 Gy and 68 ± 1.7 Gy, respectively.
Figure 3. The dose distribution in patient 3. BTVper in dark green, BTVmet in purple, and PTV in blue. The 70 Gy isoshade is in red, and the 60 Gy isoshade is in green. Panel A shows an axial image where BTVper is boosted, while BTVmet is boosted in the panel B.
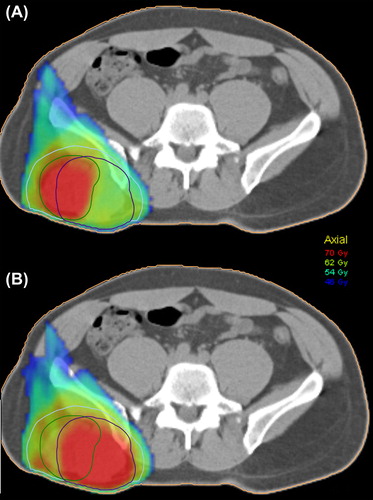
Figure 4. Cohort-based mean dose volume histograms from the two boost regimes, either were BTVmet (A) or BTVper (B) is boosted. PTV in black, BTV used for boosting in red, and corresponding non-boost BTV in green. The dotted lines indicate one standard deviation.
Discussion
Solid tumors are heterogeneous entities, functionally and genetically [Citation24], and both magnitude and spatial heterogeneity of metabolism and vascularity seem to be relevant for describing tumor progression. However, it is not immediately clear which parameters are the most relevant for the various tumor types, though vascular and metabolic information appears to be complementary [Citation25]. During tumor development perfusion and metabolic activity is linked, as continuous tumor growth require an increased vascular density. However, the development of necrosis, vascular occlusion and/or hypoxia can result in a decoupling of the vascular state from the metabolic state, and may lead to a tumor environment with evolutionary selection of aggressive tumor cells through genetic instability and a selective microenvironment [Citation26–28].
In the current work, K1 and MRFDG were used to assess perfusion and metabolism, respectively. Other surrogates could also have been chosen, such as the SUV at early and late time points, respectively, during dynamic PET acquisition [Citation16]. However, we chose to use the pharmacokinetic parameters as these most likely provide the best separation between hyperperfused and hypermetabolic regions.
In the current work, we used Otsu's method to segment the images, and extract biologic targets of high intensity, by maximizing the intra-class variance while minimizing inter-class variance, resulting in regions of comparable size. As there was no direct measure available of neither metabolism nor vasculature, the actual discrepancy could not be measured, though the data indicate that there is partial overlap between different imaging phenotypes.
Some studies have investigated the overlap/correlation between biologic targets defined from multimodal or multiparametric imaging. In a study of DCEMRI and DWI of prostate cancer, using receiver operating characteristics (ROC) analysis for assessing overlap [Citation29], it was found that the consistency between the derived parameter maps varied greatly between patients. Another study used FDG-PET, F-18-fluorothymidine (FLT; proliferation marker) PET, and Cu-61-diacetyl-bis(N4-methylthiosemicarbazone) (Cu-ATSM; hypoxia marker) PET to study biological heterogeneity in oropharyngeal tumors [Citation30]. The FDG and FLT maps showed voxel-by-voxel correlations of typically 0.76, while Cu-ATSM showed slightly lower correlations with FDG and FLT. In our study, the cohort-based mean voxel-by-voxel correlation between K1 and MRFDG was 0.42 (data not shown), indicating that the heterogeneity in the currently used PET-derived maps were greater than for the multi-tracer PET study. Therefore, it is expected that smaller differences will be present in dose distributions for biologic targets defined from the multi-tracer PET analysis used in the referenced study.
The observed differences in target volume dose distributions were shown to depend on the degree of overlap between the regions and the clinical margins used. In general, boosting BTVmet produced an overall better coverage than boosting BTVper, both in volume and dose differences. However, this was partly due to that BTVmet on average was larger than BTVper, thus covering a larger part of the PTV. However, this is not necessarily positive with respect to treatment-related side effects, as a larger boost volume implies larger doses to organs at risk.
In the current work, 6 MV photons where used in the treatment planning. As the dose deposition kernels from such photons (and accompanying secondary charged particles) are rather wide, the resulting dose gradients in the tumor are relaxed. Thus, a region in close vicinity to the boost volume will also be partly boosted, as is the case in our work. The situation is different for proton therapy, where protons may show better conformity to small target volumes than photons [Citation31]. However, if pathology (not visible in the functional images) is found outside the proton boost region, it may be preferable to use photons.
In conclusion, our work on multiparametric imaging and dose painting by contours revealed quite large interpatient variations in biologic targets and resulting dose distributions. For many of the patients, boosting one region will also cover the other region. However, for a subgroup of patients where the biological features are not overlapping, other approaches than single region boosting may be required. However, more knowledge from large patient cohorts is certainly needed before the clinical value is appraised and possible applications of multiparametric imaging may be considered.
Supplementary Table I
Download PDF (1.6 MB)Declaration of interest: The authors report no conflicts of interest. The authors alone are responsible for the content and writing of the paper.
References
- Hoshikawa H, Kishino T, Nishiyama Y, Yamamoto Y, Yonezaki M, Mori N. Early prediction of local control in head and neck cancer after chemoradiotherapy by FDG-PET. Nucl Med Commun 2011;32:684–9.
- Machtay M, Natwa M, Andrel J, Hyslop T, Anne PR, Lavarino J, et al. Pretreatment FDG-PET standardized uptake value as a prognostic factor for outcome in head and neck cancer. Head Neck 2009;31:195–201.
- Bertagna F, Giubbini R. F18-FDG-PET/CT standardised uptake value threshold in discriminating benign vs. malignant lesions. Doubts and certainties in the era of evidence-based medicine. Acta Oncol 2012;51:122–44.
- van Elmpt W, De Ruysscher D, van der Salm A, Lakeman A, van der Stoep J, Emans D, et al. The PET-boost randomised phase II dose-escalation trial in non-small cell lung cancer. Radiother Oncol 2012;104:67–71.
- van Loon J, van Baardwijk A, Boersma L, Ollers M, Lambin P, De Ruysscher D. Therapeutic implications of molecular imaging with PET in the combined modality treatment of lung cancer. Cancer Treat Rev 2011;37:331–43.
- Ashamalla H, Guirgius A, Bieniek E, Rafla S, Evola A, Goswami G, et al. The impact of positron emission tomography/computed tomography in edge delineation of gross tumor volume for head and neck cancers. Int J Radiat Oncol Biol Phys 2007;68:388–95.
- Duprez F, Bonte K, De Neve W, Boterberg T, De Gersem W, Madani I. Regional relapse after intensity-modulated radiotherapy for head-and-neck cancer. Int J Radiat Oncol Biol Phys 2011;79:450–8.
- Dirix P, Vandecaveye V, De Keyzer F, Stroobants S, Hermans R, Nuyts S. Dose painting in radiotherapy for head and neck squamous cell carcinoma: Value of repeated functional imaging with (18)F-FDG PET, (18)F-fluoromisonidazole PET, diffusion-weighted MRI, and dynamic contrast-enhanced MRI. J Nucl Med 2009;50:1020–7.
- Ashton E, Riek J. Advanced MR techniques in multicenter clinical trials. J Magn Reson Imaging 2013;37:761–9.
- Zahra MA, Hollingsworth KG, Sala E, Lomas DJ, Tan LT. Dynamic contrast-enhanced MRI as a predictor of tumour response to radiotherapy. Lancet Oncol 2007;8:63–74.
- Dimitrakopoulou-Strauss A, Strauss LG, Egerer G, Vasamiliette J, Schmitt T, Haberkorn U, et al. Prediction of chemotherapy outcome in patients with metastatic soft tissue sarcomas based on dynamic FDG PET (dPET) and a multiparameter analysis. Eur J Nucl Med Mol Imaging 2010;37:1481–9.
- Revheim ME, Kristian A, Malinen E, Bruland OS, Berner JM, Holm R, et al. Intermittent and continuous imatinib in a human GIST xenograft model carrying KIT exon 17 resistance mutation D816H. Acta Oncol 2013;52:776–82.
- Bussink J, Kaanders JH, van der Graaf WT, Oyen WJ. PET-CT for radiotherapy treatment planning and response monitoring in solid tumors. Nat Rev Clin Oncol 2011;8: 233–42.
- Histed SN, Lindenberg ML, Mena E, Turkbey B, Choyke PL, Kurdziel KA. Review of functional/anatomical imaging in oncology. Nucl Med Commun 2012;33:349–61.
- Lips IM, van der Heide UA, Haustermans K, van Lin EN, Pos F, Franken SP, et al. Single blind randomized phase III trial to investigate the benefit of a focal lesion ablative microboost in prostate cancer (FLAME-trial): Study protocol for a randomized controlled trial. Trials 2011;12:255.
- Rusten E, Rodal J, Revheim ME, Skretting A, Bruland OS, Malinen E. Quantitative dynamic (18)FDG-PET and tracer kinetic analysis of soft tissue sarcomas. Acta Oncol Epub 2012 Dec 3.
- Cochet A, Pigeonnat S, Khoury B, Vrigneaud JM, Touzery C, Berriolo-Riedinger A, et al. Evaluation of breast tumor blood flow with dynamic first-pass 18F-FDG PET/CT: Comparison with angiogenesis markers and prognostic factors. J Nucl Med 2012;53:512–20.
- Malinen E, Rodal J, Knudtsen IS, Sovik A, Skogmo HK. Spatiotemporal analysis of tumor uptake patterns in dynamic (18)FDG-PET and dynamic contrast enhanced CT. Acta Oncol 2011;50:873–82.
- Mullani NA, Herbst RS, O’Neil RG, Gould KL, Barron BJ, Abbruzzese JL. Tumor blood flow measured by PET dynamic imaging of first-pass 18F-FDG uptake: A comparison with 15O-labeled water-measured blood flow. J Nucl Med 2008;49:517–23.
- Roe K, Aleksandersen TB, Kristian A, Nilsen LB, Seierstad T, Qu H, et al. Preclinical dynamic 18F-FDG PET – tumor characterization and radiotherapy response assessment by kinetic compartment analysis. Acta Oncol 2010;49:914–21.
- Chung JK, Lee YJ, Kim SK, Jeong JM, Lee DS, Lee MC. Comparison of [18F]fluorodeoxyglucose uptake with glucose transporter-1 expression and proliferation rate in human glioma and non-small-cell lung cancer. Nucl Med Commun 2004;25:11–7.
- Park SG, Lee JH, Lee WA, Han KM. Biologic correlation between glucose transporters, hexokinase-II, Ki-67 and FDG uptake in malignant melanoma. Nucl Med Biol 2012;39:1167–72.
- Tohma T, Okazumi S, Makino H, Cho A, Mochiduki R, Shuto K, et al. Relationship between glucose transporter, hexokinase and FDG-PET in esophageal cancer. Hepatogastroenterology 2005;52:486–90.
- Marusyk A, Almendro V, Polyak K. Intra-tumour heterogeneity: A looking glass for cancer?. Nat Rev Cancer 2012;12: 323–34.
- Jansen JF, Schoder H, Lee NY, Stambuk HE, Wang Y, Fury MG, et al. Tumor metabolism and perfusion in head and neck squamous cell carcinoma: Pretreatment multimodality imaging with 1H magnetic resonance spectroscopy, dynamic contrast-enhanced MRI, and [18F]FDG-PET. Int J Radiat Oncol Biol Phys 2012;82:299–307.
- Chiche J, Brahimi-Horn MC, Pouyssegur J. Tumour hypoxia induces a metabolic shift causing acidosis: A common feature in cancer. J Cell Mol Med 2010;14:771–94.
- Gatenby RA, Gillies RJ. Glycolysis in cancer: A potential target for therapy. Int J Biochem Cell Biol 2007;39:1358–66.
- Gillies RJ, Verduzco D, Gatenby RA. Evolutionary dynamics of carcinogenesis and why targeted therapy does not work. Nat Rev Cancer 2012;12:487–93.
- Groenendaal G, van den Berg CA, Korporaal JG, Philippens ME, Luijten PR, van Vulpen M, et al. Simultaneous MRI diffusion and perfusion imaging for tumor delineation in prostate cancer patients. Radiother Oncol 2010; 95:185–90.
- Nyflot MJ, Harari PM, Yip S, Perlman SB, Jeraj R. Correlation of PET images of metabolism, proliferation and hypoxia to characterize tumor phenotype in patients with cancer of the oropharynx. Radiother Oncol 2012;105:36–40.
- Flynn RT, Barbee DL, Mackie TR, Jeraj R. Comparison of intensity modulated x-ray therapy and intensity modulated proton therapy for selective subvolume boosting: A phantom study. Phys Med Biol 2007;52:6073–91.