Abstract
Introduction. Dynamic 18F-FDG PET allows the study of glucose distribution in tissues as a function of time and space. Using pharmacokinetics, the temporal uptake pattern of 18F-FDG may be separated into components reflecting perfusion and metabolism. Bevacizumab is an angiogenesis inhibitor which prevents the growth of new blood vessels, and may potentially lead to normalization of the blood circulation in the tumor. The purpose of the study was to explore the use of dynamic PET as a tool for monitoring treatment effect, reflected by changes in perfusion and metabolism. Materials and Methods. Twelve athymic nude mice, bearing the bilateral triple-negative human breast cancer xenograft MAS98.12 were treated with bevacizumab (5 mg/kg i.p.). Dynamic PET data was acquired prior to and 24 and 72 hours after treatment for 1 hour after injection of 10 MBq 18F-FDG and fitted with a FDG two-tissue compartment model. The changes in the rate constants k1, k3, MRFDG and the vascular fraction νB were assessed. To evaluate the effect of treatment regimes, 30 mice, randomized in 5 groups, received either vehicle (0.9% NaCl), bevacizumab (5 mg/kg i.p.), doxorubicin (8 mg/kg i.v.) or bevacizumab and doxorubicin either together, or doxorubicin 24 hours after bevacizumab treatment. Tumor volume was measured twice a week. Results. The perfusion-related rate parameter k1 and the metabolic rate constant k3 decreased significantly 24 hours after treatment. This decrease was followed by an increase, albeit non-significant, at 72 hours post treatment. Doxorubicin given 24 hours after bevacizumab showed less antitumor effect compared to concomitant treatment. Conclusions. Dynamic PET can detect changes in tumor perfusion and metabolism following anti-angiogenic therapy in mouse xenograft models. Longitudinal dynamic PET, used to assess the efficacy of anti-angiogenic treatment, can identify the time frame of potential tumor vasculature re-normalization and allow optimal timing of supplementary therapy (radiation or chemotherapy).
Formation of new blood vessels (angiogenesis) is a prerequisite for the progression of solid tumors [Citation1] and is controlled by a number of pro- and anti-angiogenic factors. In the majority of solid cancers the balance is shifted towards pro-angiogenic conditions due to expression of the vascular endothelial growth factor (VEGF). VEGF is one of the main molecules stimulating proliferation and migration of endothelial cells. This promotes tumor capillary growth and increases permeability of existing blood vessels, resulting in structurally and physiologically abnormal and spatially heterogeneous tumor vasculature [Citation2]. Increased resistance to bfood flow and impaired blood supply restrict delivery of oxygen and nutrients to the tumor leading to radiotherapy resistance, as well as resistance towards conventional cytotoxic drugs and molecular- targeted therapies [Citation3].
The use of angiogenesis inhibitors has become an established practice in cancer management. The majority of available strategies targets VEGF, either by direct binding to the molecule, by blocking the VEGF receptors or by blocking downstream signaling pathways [Citation4]. Several drugs are under approved or are used in ongoing clinical trials for many types of cancer [Citation5]. Bevacizumab (Avastin, Genentech, La Roche, Basel, Switzerland) was one of the first clinically available angiogenesis inhibitors. Bevacizumab is a recombinant humanized monoclonal antibody that binds to VEGF, promotes VEGF degradation and thereby prevents receptor activation [Citation6]. Despite a fair risk profile in most cancer type, the drug should be used with caution, as adverse effects are not uncommon [Citation7].
Along with the inhibition of vessel formation, bevacizumab alters the existing vasculature [Citation6], leading to a degradation of existing capillaries and a transient normalization of blood vessels, often referred to as “the window of opportunity” [Citation3]. Furthermore, it was proposed by Jain [Citation3] that this normalization will increase tumor blood flow, decrease interstitial fluid pressure and increase oxygen tension and as a result increase the delivery of other drugs.
Selection of the optimal dosage for anti- angiogenic treatment, unlike application of the maximum tolerated dose for cytotoxic drugs, is challenging. Due to patient heterogeneity, accurate dose selection and treatment response monitoring are important [Citation3]. Several imaging modalities can be used to image angiogenesis and the effect of anti-angiogenic therapy, including magnetic resonance imaging (MRI), x-ray computed tomography (CT), positron emission tomography (PET), single photon emission tomography (SPECT), and ultrasound (US) [Citation8,Citation9].
The most common PET tracer in cancer imaging is 2-deoxy-2-[18F]fluoro-D-glucose (18F-FDG), which accumulates in cells with high glucose demand [Citation10]. In contrast to conventional 18F-FDG PET, where a PET scan is performed typically one hour post-injection, dynamic 18F-FDG PET depicts the distribution of 18F-FDG in space and time from the time of injection. Thus, dynamic 18F-FDG-PET reflects both the early vascular distribution phase and the later metabolic phase [Citation11]. Furthermore, pharmacokinetic modeling of the tracer uptake can provide information more directly related to blood flow and tumor metabolism [Citation12,Citation13].
In the current work, investigate the effect of anti-angiogenic therapy in human breast cancer xenografts using dynamic 18F-FDG-PET. A longitudinal protocol was followed, with assessment of changes in vasculature and metabolism, with the aims of exploring the potential for such treatment monitoring, and discuss the clinical value of such an approach. Tumor regrowth following administration of bevacizumab, with doxorubicin given either concomitantly or 24 hours after bevacizumab, was performed to evaluate treatment and the impact of timing between anti-angiogenic and cytotoxic therapy.
Material and methods
Animals, xenografts and anesthesia
Previously described, patient-derived basal-like breast carcinoma xenografts (MAS98.12) were used in this study [Citation14]. Tumor tissue fragments of approximately 1 mm3, obtained from a previous passage, were implanted bilaterally in the mammary fat pads of female athymic nude mice (Athymic Nude- Foxn1nu; weight 23–25 g; age 7–8 weeks). All experimental protocols were approved by The National Animal Research Authority and the experiment was conducted according to the regulations of the Federation of European Laboratory Animal Science Association (FELASA). Mice were kept under pathogen-free conditions, at constant temperature (21.5 ± 0.5°C) and humidity (55 ± 5%), 20 air changes/ hour and a 12 hour light/dark cycle. Distilled tap water was given ad libitum, supplemented with 17-β-estradiol at a concentration of 4 mg/l.
Prior to implantation of xenografts and dynamic 18F-FDG PET, mice were anesthetized with subcutaneous (s.c.) injections of a mixture of 2.4 mg/ml tiletamine and 2.4 mg/ml zolazepam (Zoletil vet, Virbac Laboratories, Carros, France), 3.8 mg/ml xylazine (Narcoxyl vet, Roche, Basel, Switzerland), and 0.1 mg/ml butorphanol (Torbugesic, Fort Dodge Laboratories, Fort Dodge, IA, USA), diluted 1:5 in sterile water, at a dosage of 75 μl/10 g of body weight.
Treatment of xenografts with bevacizumab and doxorubicin
Experiments started when the longest tumor diameter was between 8 and 10 mm, typically 4–5 weeks after implantation. Twelve mice were subjected to dynamic 18F-FDG PET imaging before treatment and 24 and 72 hours after treatment with bevacizumab (5 mg/kg i.p., Avastin, Genentech, La Roche, Basel, Switzerland). To evaluate the effect of different treatment regimens, 30 mice were randomized in five groups (Supplementary Figure 1, available online at http://informahealthcare.com/doi/abs/10.3109/ 0284186X.2013.813634). Mice received either vehicle (0.9% NaCl), bevacizumab (5 mg/kg i.p.), doxorubicin alone (8 mg/kg i.v., Adriamycin, Pfizer, New York, NY, USA) or bevacizumab and doxorubicin either together, or doxorubicin 24 hours after bevacizumab treatment. Tumor size was measured twice a week and tumor volume (TV) was calculated as TV = π/6*length*width2 with length and width being the two orthogonal tumor diameters When the longest tumor diameters for at least two tumors in a group had reached 15 mm, the entire group was sacrificed.
Dynamic PET measurements
Dynamic 18F-FDG PET was performed using a Siemens microPET Focus 120 (Erlangen, Germany) animal scanner. Following overnight fasting, the animals were anesthetized and a catheter flushed with heparinized saline was inserted in the tail vein. Groups of two to three mice were placed on the examination table, centered within the scanner gantry. Prior to PET scanning, the mice cage was placed on a heating pad. During preparation, when the mice were under anesthesia, they were kept warm by the heating pad. For the PET scan, mice were wrapped in insulating material. Furthermore, a heating lamp was used and a rectal temperature probe was placed in one of the mice. The temperature was maintained at about 35°C.
A 60 minute PET acquisition in list-mode was started prior to i.v. administration of 10 MBq 18F-FDG (GE Healthcare AS, Oslo, Norway) diluted in saline. Three-dimensional (3D) dynamic emission data were reconstructed using OSEM3D-MAP (two OSEM iterations, 18 MAP iterations, β = 0.5, matrix size = 128 × 128 × 95) [Citation15], producing images with voxel size 0.87 × 0.87 × 0.87 mm3. The sampling time ranged from 10 s (early time points) to 600 s (late time points). All images were stored in microPET format and analyzed using PMOD software package (PMOD Technologies, Zurich, Switzerland).
Quantitative evaluation and kinetic modeling of dynamic 18F-FDG PET
Pharmacokinetic analysis was performed using a two-compartment FDG kinetic model, using individual arterial input functions (AIFs). The AIF was obtained by linear interpolation between the measured values of the 18F-FDG time activity curve (TAC) from the left ventricle. Tumor tissue was manually delineated in the axial PET images and TACs for individual tumors were obtained. TACs were normalized to the AIF, thus accounting for differences in injected 18F-FDG activity between animals, as previously described [Citation16].
The median 18F-FDG TAC for the whole volume of interest (VOI) was subjected to kinetic modeling using a two-compartment model, described in detail elsewhere [Citation16]. Briefly, the model assumes that the tracer concentration in the tissue, CT , can be separated in a free (non-metabolized) and a bound (metabolized) compartment, with tracer concentrations CF and CB, respectively. The four rate constants in the model, k1, k2, k3, and k4, describes the exchange of 18F-FDG between the two compartments. The kinetic parameters are estimated by non-linear fitting of the model to the TAC. k4 was assumed to be zero. The lumped constant (LC), a conversion coefficient correcting for the difference in 18F-FDG and true glucose uptake, was set to 0.89. Plasma glucose concentration (CGLU) was set to 5 mmol/l for all analysis The metabolic rate of 18F-FDG, MRFDG, was calculated as (k1∙k3)/(k2 + k3). The goodness of fit between the measured TACs and the model fits was evaluated by Pearson's correlation coefficient squared (r2) in each tumor voxel.
Normalized late phase 18F-FDG uptake (one hour post-injection) was used to analysis intra- and inter-tumor heterogeneity. For assessment of intra-tumor heterogeneity, the voxel-by-voxel standard deviation in a given tumor, normalized to the AIF was used.
Statistics
For comparison of pharmacokinetic parameters and uptake values in kinetic curves an ANOVA on Ranks test for repeated measurements with Tukey pairwise comparison test as a post-hoc test was performed using Sigma Plot 11.2.0. For comparison of normalized standard deviation (intra-tumor variation), ANOVA one-way test and a paired t-test as a post-hoc test was used. The statistical significance level chosen was 0.05.
Results
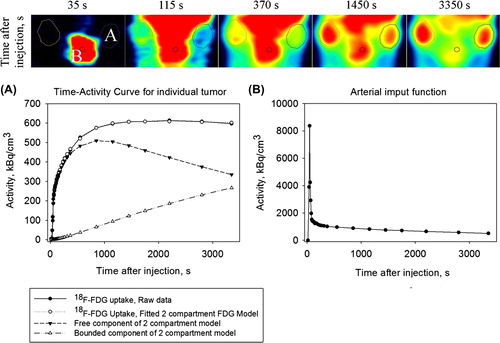
Dynamic 18F-FDG PET images of a representative animal are shown in , together with the uptake curves in the tumor and the heart. The latter curve constitutes the AIF.
Figure 1. A dynamic 18F-FDG-PET image series in the coronal plane showing the heart and the implanted bilateral human breast cancer xenografts MAS98.12 xenografts. The corresponding uptake kinetics are shown in graphs A and B, respectively, where the latter constitutes the arterial input function (AIF). Also, the results from the pharmacokinetic model fit are shown.
Cohort-based normalized TACs and acquired pretreatment, and 24 and 72 hours post-treatment are shown in . Post-hoc analysis showed lower early 18F-FDG uptake (1–7 minutes post- injection) 24 hours after treatment compared to pretreatment levels (p < 0.05). A trend towards a recovery in the early phase of the 18F-FDG uptake was observed 72 hours after treatment, but the increase did not reach statistical significance. Normalized late phase 18F-FDG uptake (one hour post-injection) was reduced by 18% 24 hours after treatment (p < 0.05) compared to levels both before and 72 hours after treatment. There was no significant difference between the latter two.
Figure 2. Cohort-based median time-activity curves, normalized to the AIF, for tumors at baseline and 24 and 72 hours after administration of bevacizumab.
We observed changes in the intra-tumor heterogeneity of late-phase FDG uptake following anti-angiogenic therapy. A significant decrease in the standard deviation of late-phase FDG uptake 24 hours after treatment compared to pre-treatment levels was found (Supplementary Figure 2, available online at http://informahealthcare.com/doi/abs/10. 3109/0284186X.2013.813634). A partial redistribution of the voxel values was observed 72 hours after treatment, but this change was not significant.
The effect of bevacizumab treatment on the pharmacokinetic parameters is summarized in . Compared to the baseline values a decrease in all pharmacokinetic parameters was observed 24 hours after treatment. However, only the decrease in perfusion parameters (k1 and k2) was significant (p < 0.05). This decrease was followed by an increase, albeit non-significant, in k1 and k2 at 72 hours compared to 24 hours after treatment. The rate constant k3 showed non-significant decrease 24 hours post-treatment, thereafter increasing significantly towards the pre-treatment level 72 hours after treatment. No significant changes in vB or MRFDG were observed.
Figure 3. Box plot of the pharmacokinetic parameters at different time points. Groups significantly differed from pre-treatment group marked with *(p < 0.05).
Growth curves showing the effect of treatment with bevacizumab and/or doxorubicin are presented in . Tumor growth was significantly delayed in the group with simultaneous administration of bevacizumab and doxorubicin compared to the group with a delayed administration of doxorubicin. Doxorubicin had a significant additional effect on tumor growth delay for both groups compared to the group, treated with bevacizumab alone.
Figure 4. Tumor growth curves showing delayed tumor growth in the group with simultaneous administration of bevacizumab and doxorubicin compared to the group with a delayed administration of doxorubicin.
Discussion
In this study, we have demonstrated the use of dynamic 18F-FDG PET for monitoring response to anti-angiogenic treatment in breast cancer xenografts. The MAS98.12 xenograft that was used is derived by implanting human tumor material in the mammary fat pads, and has retained the morphology and gene expression pattern found in the original patient tumor [Citation14]. This orthotopic model provide a more relevant microenvironment compared to subcutaneous models, and is therefore more attractive for studying anti-angiogenic therapy. MAS98.12 have previously been shown to express VEGF, to be highly vascularized and to respond to bevacizumab treatment [Citation17]. In this study, we found that for some tumors the free component of 18F-FDG is higher than the bound component one hour after bolus injection (). This is expected for highly vascularized or low metabolic regions or tumors. We made similar observations in our previous study on gastro-intestinal xenograft [Citation13].
We found significant changes in 18F-FDG- uptake, both in the early and the late PET acquisition phases following administration of bevacizumab (). As the early phase largely reflects tumor vasculature/perfusion and the late phase reflects tumor metabolism, we were able to show the effects of bevacizumab on both these endpoints (). Bevacizumab reduced the tumor perfusion (k1, k2 and vB) and metabolism (k3 and MRFDG) 24 hours after treatment, but the effect was transient as the PET parameters largely returned to baseline levels thereafter. Transient changes could also be detected in the intra-tumor heterogeneity in 18F-FDG uptake. These tumor alterations were also detected by the pharmacokinetic analysis, where the perfusion- related parameters (k1 and k2) were significantly reduced 24 hours after drug administration. The pattern for the metabolic parameters (k3 and MRFDG) was less clear, although some significant changes could be detected here as well.
The dynamic PET data in the current work indicates a reduction in tumor perfusion 24 hours after administration of bevacizumab ( and ). Reduced perfusion is in turn expected to reduce the delivery of cytotoxic drugs to the tumor tissue, leading to a suboptimal treatment effect. This effect was indeed demonstrated in the current study, as giving doxorubicin 24 hours after administering bevacizumab showed less effect on tumor growth compared to concomitant treatment (). A recently published small clinical study, involving 10 patients with non-small cell lung cancer showed rapid decrease in delivery of docetaxel chemotherapy to the tumor following administration of bevacizumab [Citation18]. However, there are several studies utilizing mouse xenograft models and either invasive or non-invasive evaluation of vasculature response to anti-angiogenic treatment showing increase in delivery of chemotherapy [Citation19] or sensitization tumor for radiation therapy [Citation20]. This indicates that a careful evaluation of drug administration's timing during treatment planning and evaluation of early treatment response is necessary.
There is no consensus regarding the optimal imaging modality for monitoring the response to anti-angiogenic therapy. Different modalities yield different imaging-derived hemodynamic parameters. Both in-tumor, between patients and inter-laboratory variability makes it difficult to set common standards, especially in multicenter clinical trials. However, several imaging modalities have been proposed for non-invasive assessment of tumor vascularity and evaluating response to angiogenic treatment [Citation8,Citation9]. Dynamic contrast-enhanced MRI is probably the most frequently used modality utilizing paramagnetic contrast agents and showing promising result in several studies [Citation21–23]. Yet, DCE-MRI has limitations, e.g. in the quantification of the amount of contrast agent as well as pronounced image artifacts. There are several specific PET tracers used in the assessment of blood flow and overall vascular status. H215O serves as a gold standard, but the short half-life time of 15O limits the application areas and protocols. Several specific tracers that bind to the developing vasculature, like labeled VEGF antibodies or molecules binding to ανβ3 integrins, may also be used. However, these tracers are largely unavailable or are difficult to work with due to short half-life of the isotopes (see [Citation8,Citation9,Citation24] and references therein). Dynamic 18F-FDG-PET, which has shown to provide similar information on vascular status as H215O-PET, DCEMRI and DCE-CT [Citation25–28], may thus be a more straightforward method.
Previously, we have described changes in 18F-FDG-PET-derived pharmacokinetic parameters following radiotherapy in prostate cancer xenografts [Citation16]. In that work, we found that tumor perfusion and tumor metabolism increased 24 hours after irradiation, which was attributed to increased vessel permeability and possibly alterations in tumor hypoxia. In the current work, administration of bevacizumab resulted in the opposite effect: a reduction in both perfusion and metabolism 24 hours after administration. These studies illustrate the potential usefulness of dynamic 18F-FDG-PET for general assessment of vasculature and physiology after cancer therapy, regardless of whether radiation or tailored drugs are used. In future studies, we aim at using dynamic 18F-FDG-PET for investigating the treatment effect following combined therapy, including radiotherapy and different cytotoxic and anti-angiogenic drugs.
Notice of correction
The version of this article published online ahead of print on 29 Aug 2013 contained an error on page 1. The heading of the article should have read “Original article”, not Letter to the Editor. The abstract was also missing. The error has been corrected for this version.
Supplementary Figures 1–2
Download PDF (1.2 MB)Declaration of interest: The authors report no conflicts of interest. The authors alone are responsible for the content and writing of the paper.
Financial support received from the K.G. Jebsen center for Breast Cancer research, Oslo, Norway is gratefully acknowledged.
References
- Jain RK. Molecular regulation of vessel maturation. Nat Med 2003;9:685–93.
- Ferrara N. VEGF and the quest for tumour angiogenesis factors. Nat Rev Cancer 2002;2:795–803.
- Jain RK. Normalizing tumor vasculature with anti-angiogenic therapy: A new paradigm for combination therapy. Nat Med 2001;7:987–9.
- Harper J, Moses M. Molecular regulation of tumor angiogenesis: Mechanisms and therapeutic implications. In: Bignold LP, editor. Cancer: Cell structures, carcinogens and genomic instability. Experientia Supplementum. Berlin: Birkhaauser Basel; 2006.
- Schneider BP, Sledge GW. Drug insight: VEGF as a therapeutic target for breast cancer. Nat Clin Pract Oncol 2007;4:181–9.
- Ferrara N, Hillan KJ, Gerber HP, Novotny W. Discovery and development of bevacizumab, an anti VEGF antibody for treating cancer. Nat Rev Drug Disc 2004;3:391–8.
- Cao C, Wang J, Bunjhoo H, Xu Y, Fang H. Risk profile of bevacizumab in patients with non-small cell lung cancer: A meta-analysis of randomized controlled trials. Acta Oncol 2012;51:151–6.
- Miller JC, Pien HH, Sahani D, Sorensen AG, Thrall JH. Imaging angiogenesis: Applications and potential for drug development. J Natl Cancer Inst 2005;97:172–87.
- Drevs J, Schneider V. The use of vascular biomarkers and imaging studies in the early clinical development of anti-tumour agents targeting angiogenesis. J Intern Med 2006;260:517–29.
- Warburg O. On the origin of cancer cells. Science 1956; 123:309–14.
- Watabe H, Ikoma Y, Kimura Y, Naganawa M, Shidahara M. PET kinetic analysis—compartmental model. Ann Nucl Med 2006;20:583–8.
- Dunnwald LK Doot RK, Specht JM, Gralow JR, Ellis GK, Livingston RB, et al. PET tumor metabolism in locally advanced breast cancer patients undergoing neoadjuvant chemotherapy: Value of static versus kinetic measures of fluorodeoxyglucose uptake. Clin Cancer Res 2011;17: 2400–9.
- Revheim ME, Kristian A, Malinen E, Bruland ØS, Berner JM, Holm R, et al. Intermittent and continuous imatinib in a human GIST xenograft model carrying KIT exon 17 resistance mutation D816H. Acta Oncol 2013; 52:776–82.
- Bergamaschi A, Hjortland GO, Triulzi T, Sørlie T, Johnsen H, Ree AH, et al. Molecular profiling and characterization of luminal-like and basal-like in vivo breast cancer xenograft models. Mol Oncol 2009;3:469–82.
- Qi J, Leahy RM. Resolution and noise properties of MAP reconstruction for fully 3-D PET. IEEE Trans Med Imaging 2000;19:493–506.
- Røe K, Aleksandersen TB, Kristian A, Nilsen LB, Seierstad T, Qu H, et al. Preclinical dynamic 18F-FDG PET – tumor characterization and radiotherapy response assessment by kinetic compartment analysis. Acta Oncol 2010;49:914–21.
- Lindholm EM, Kristian A, Nalwoga H, Krüger K, Nygård S, Akslen LA, et al. Effect of antiangiogenic therapy on tumor growth, vasculature and kinase activity in basal- and luminal-like breast cancer xenografts. Mol Oncol 2012;6:418–27.
- Van der Veldt AA, Lubberink M, Bahce I, Walraven M, de Boer MP, Greuter HN, et al. Rapid decrease in delivery of chemotherapy to tumors after anti-VEGF therapy: Implications for scheduling of anti-angiogenic drugs. Cancer Cell 2012;21:82–91.
- Dickson PV, Hamner JB, Sims TL, Fraga CH, Ng CY, Rajasekeran S, et al. Bevacizumab-induced transient remodeling of the vasculature in neuroblastoma xenografts results in improved delivery and efficacy of systemically administered chemotherapy. Clin Cancer Res 2007;13: 3942–50.
- Dings RP, Loren M, Heun H, McNiel E, Griffioen AW, Mayo KH, et al. Scheduling of radiation with angiogenesis inhibitors anginex and Avastin improves therapeutic outcome via vessel normalization. Clin Cancer Res 2007;13: 3395–402.
- Bhujwalla ZM, Artemov D, Natarajan K, Solaiyappan M, Kollars P, Kristjansen PE. Reduction of vascular and permeable regions in solid tumors detected by macromolecular contrast magnetic resonance imaging after treatment with antiangiogenic agent TNP-470. Clin Cancer Res 2003;9: 355–62.
- Delille JP, Slanetz PJ, Yeh ED, Halpern EF, Kopans DB, Garrido L. Invasive ductal breast carcinoma response to neoadjuvant chemotherapy: Noninvasive monitoring with functional MR imaging pilot study. Radiology 2003;228:63–9.
- Li SP, Makris A, Beresford MJ, Taylor NJ, Ah-See ML, Stirling JJ, et al. Use of dynamic contrast-enhanced MR imaging to predict survival in patients with primary breast cancer undergoing neoadjuvant chemotherapy. Radiology 2011;260:68–78.
- Lederle W, Palmowski M, Kiessling F. Imaging in the age of molecular medicine: Monitoring of anti-angiogenic treatments. Curr Pharm Biotechnol 2012;13:595–608.
- Rusten E, Rødal J, Revheim ME, Skretting A, Bruland OS, Malinen E. Quantitative dynamic (18)FDG-PET and tracer kinetic analysis of soft tissue sarcomas. Acta Oncol Epub 2012 Dec 3.
- Malinen, E, Rødal J, Knudtsen IS, Søvik Å, Skogmo HK. Spatiotemporal analysis of tumor uptake patterns in dynamic (18)FDG-PET and dynamic contrast enhanced CT. Acta Oncol 2011;50:873–82.
- Mullani NA, Herbst RS, O’Neil RG, Gould KL, Barron BJ, Abbruzzese JL. Tumor blood flow measured by PET dynamic imaging of first-pass 18F-FDG uptake: A comparison with 15O-labeled water-measured blood flow. J Nucl Med 2008;49:517–23.
- Eby PR, Partridge SC, White SW, Doot RK, Dunnwald LK, Schubert EK, et al. Metabolic and vascular features of dynamic contrast-enhanced breast magnetic resonance imaging and (15)O-water positron emission tomography blood flow in breast cancer. Acad Radiol 2008;15:1246–54.