Abstract
Purpose. To investigate the stability of target motion amplitude and motion directionality throughout full stereotactic body radiotherapy (SBRT) treatments of tumors in the liver. Material and methods. Ten patients with gold markers implanted in the liver received 11 courses of 3-fraction SBRT on a conventional linear accelerator. A four-dimensional computed tomography (4DCT) scan was obtained for treatment planning. The time-resolved marker motion was determined throughout full treatment field delivery using the kV and MV imagers of the accelerator. The motion amplitude and motion directionality of all individual respiratory cycles were determined using principal component analysis (PCA). The variations in motion amplitude and directionality within the treatment courses and the difference from the motion in the 4DCT scan were determined. Results. The patient mean (± 1 standard deviation) peak-to-peak 3D motion amplitude of individual respiratory cycles during a treatment course was 7.9 ± 4.1 mm and its difference from the 4DCT scan was −0.8 ± 2.5 mm (max, 6.6 mm). The mean standard deviation of 3D respiratory cycle amplitude within a treatment course was 2.0 ± 1.6 mm. The motion directionality of individual respiratory cycles on average deviated 4.6 ± 1.6° from the treatment course mean directionality. The treatment course mean motion directionality on average deviated 7.6 ± 6.5° from the directionality in the 4DCT scan. A single patient-specific oblique direction in space explained 97.7 ± 1.7% and 88.3 ± 10.1% of all positional variance (motion) throughout the treatment courses, excluding and including baseline shifts between treatment fields, respectively. Conclusion. Due to variable breathing amplitudes a single 4DCT scan was not always representative of the mean motion amplitude during treatment. However, the motion was highly directional with a fairly stable direction throughout treatment, indicating a potential for more optimal individualized motion margins aligned to the preferred direction of motion.
In stereotactic body radiotherapy (SBRT) for tumors in the liver, high radiation doses are delivered in a few treatment fractions to small focal intra- hepatic tumors [Citation1–3]. While high accuracy is crucial for successful treatments [Citation4], it is challenged by respiratory-induced tumor motion during treatment delivery [Citation5–7].
Typically, a respiratory correlated four-dimensional CT (4DCT) scan is obtained for treatment planning and used to estimate motion encompassing treatment margins to ensure proper dose coverage of the target. The 4DCT scan provides information of motion during a single respiratory cycle, which is normally assumed to be representative for target motion during treatment [Citation8]. However, some evidence of highly variable motion amplitude during liver treatments has been reported [Citation6,Citation7,Citation9–11]. In addition, current statistical-based margin approaches usually prescribe the motion margins along the antero-posterior (AP), cranio-caudal (CC), and left-right (LR) directions without considering the correlation of motion along these directions, i.e. the overall directionality of the target motion [Citation12,Citation13]. This might lead to sub-optimal margins with excess healthy tissue irradiation and reduced target coverage probability. If the directionality of motion is stable during treatment, more optimal margins aligned to the dominating motion direction could be designed. However, there is presently insufficient knowledge about the stability of liver motion magnitude and directionality to address this question.
The present study is based on the motion data from a newly constructed database of highly detailed time-resolved internal 3D motion throughout entire liver SBRT treatments at a conventional linear accelerator [Citation6]. The study investigates the variation of the respiratory peak-to-peak motion amplitude and directionality of individual respiratory cycles from planning 4DCT scanning and throughout the full treatment courses.
Material and methods
Patients and motion data
This study is based on motion data from 11 treatment courses (10 patients, one re-treatment) delivered in 33 fractions between October 2009 and January 2012, following our standard 3-fraction treatment protocol for marker-guided liver SBRT. The patient characteristics, treatments, and image-based measurements of internal 3D marker motion during these 11 treatments have been described in detail previously [Citation6]. Parts relevant for the present study are summarized below.
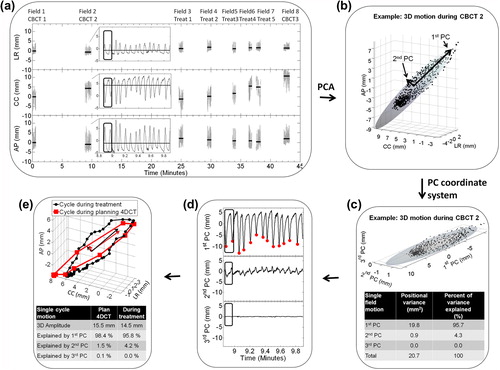
Each patient had 2–3 cylindrical gold markers (1 × 3 mm) implanted near the tumor(s). A 3-mm slice thickness, 10 phase 4DCT scan was obtained for treatment planning using the RPM system for phase sorting (Varian Medical Systems, Palo Alto, CA, USA). A stereotactic body frame was used for immobilization (SBF, Elekta, Crawley, UK) with an abdominal compression applied for the last five of the 11 treatment courses. The compression was not part of the protocol for the first six courses. A second 4DCT scan (control 4DCT) was obtained on the first treatment day. The marker motion in the 4DCT scans was estimated by manually defining the center-of-mass marker location in each of the 10 phases of the scans. As described by Beddar et al. [Citation14] the uncertainty of such marker definition is largest in the CC direction (˜ 3 mm corresponding to the slice thickness). The resolution in the LR and AP directions was 1.2 mm. The mean clinical target volume (CTV) dose of 10–22.5 Gy per fraction was delivered with 5–6 conformal or volumetric-modulated arc treatment fields at a Varian Trilogy linear accelerator. Three cone beam computed tomography (CBCT) scans were acquired at each fraction; two for setup (CBCT1 and CBCT2) and one post-treatment (CBCT3). All CBCT scans were reconstructed from ˜ 670 2D kV images acquired at 11 Hz. Throughout treatment field delivery, MV portal images (7.5–7.8 Hz) were acquired simultaneously with orthogonal kV images (5.0 Hz). As described previously these images provided the time-resolved 3D motion with sub-millimeter accuracy relative to the bony anatomy of a selected gold marker throughout all CBCT and treatment field deliveries [Citation6]. An example of the observed motion during a fraction is shown in .
Figure 1. (a) Marker motion relative to the bony anatomy during three cone beam computed tomography fields (CBCT) and five treatment fields (Treat) of a typical treatment fraction (Patient 3). Horizontal lines show the mean (i.e. baseline) position during each field. The inset is an enlargement of the CBCT2 motion. (b) 3D plot of motion during CBCT2. The semi-axes of the ellipsoid, shown to illustrate the directionality, were defined from principal component analysis (PCA). (c) The 3D motion shown in the coordinate system defined by the principal components (PC). The inset-table shows the positional variance along the PCs of the field. (d) Motion during CBCT2 in PC coordinates with detected respiratory inhale peaks along the first PC. (e) A single respiratory cycle (encapsulated by black box in ) during CBCT2 compared with the motion in the planning 4DCT scan. The arrows show the directions of the first and second PCs of these two respiratory cycles, for which the difference in directionality was 5.2°. The inset-table shows the motion explained by the PCs of the respiratory cycles.
Extraction of individual respiratory cycles by principal component analysis
As illustrated in the marker motion was recorded over many respiratory cycles during a treatment fraction. Principal component analysis (PCA) was first used to split the motion into individual respiratory cycles.
PCA of motion data generates three principal components (PCs) that define a new orthogonal co-ordinate system. In this co-ordinate system the positional variance (due to motion) along the direction of the first PC is the maximum among all possible first axes, the variance along the second PC is the maximum among possible orthogonal second axes, and the third PC describes the rest of the total variance [Citation15]. Throughout this paper we use the terminology that x percent of the motion was explained by a given axis if the statistical variance of the position of the marker along this axis was x percent of the total 3D variance in marker position. Note that the variances along the three axes of any orthogonal co-ordinate system (such as the PC co-ordinate system or the conventional LR, CC, AP co-ordinate system) always sum up to the total 3D variance, i.e. the three axes together always explain 100% of the motion.
The use of PCA is illustrated in . First PCA was performed on motion during individual fields. To exemplify, during the field shown in and , 95.7% of the motion was explained by the first PC (100% means pure linear motion), 4.3% of the motion was explained by the second PC (i.e. the motion was not completely linear), and 0.0% of the motion was explained by the third PC (i.e. the motion was confined to the plane defined by the first and second PC). Second, the MSPEAKS algorithm in the Matlab software package (The MathWorks, Natick, MA, USA) was used to locate the extreme inhale peaks along the first PC (red dots in ), which provided a division of the continuous motion trajectory into individual respiratory cycles (). After this division, PCA was performed for each individual respiratory cycle. The 3D peak-to-peak amplitude of each respiratory cycle was calculated as the maximum Euclidian distance between any two points in the respiratory cycle. This analysis was also performed for the respiratory cycle recorded in the planning and control 4DCT scans.
Inter-cycle variations of peak-to-peak motion amplitude
For each treatment course, the mean and standard deviation (SD) of the peak-to-peak motion amplitude of all individual respiratory cycles were calculated. The course mean motion amplitude, the motion amplitude in the planning 4DCT scan, and the motion amplitude in the control 4DCT scan were pairwise compared for the patient group by calculation of the mean ± SD amplitude differences and Pearson's correlation coefficient R.
Inter-cycle variations of motion directionality
In this paper, directionality was defined as the direction of the first PC. The difference between two directionalities was quantified by the angle between the directionalities, which is a sign-less absolute number that do not indicate a specific direction. The course mean directionality was defined as the mean directionality of all individual respiratory cycles. The directional variation within a course was quantified as the mean deviation between the motion directionality of single respiratory cycles and the course mean directionality. The course mean directionality, the directionality in the planning 4DCT scan, and the directionality in the control 4DCT scan were pairwise compared by calculation of the mean and SD of their directionality differences.
For the patients with smallest mean motion amplitude, PCA on individual respiratory cycles was unreliable as it was affected by the 0.5–1 mm noise level of the data. For this reason the directionality analyses only included courses with a mean 3D motion exceeding 5 mm (seven of the 11 courses, see also Results section).
Motion explained by a single direction throughout treatment
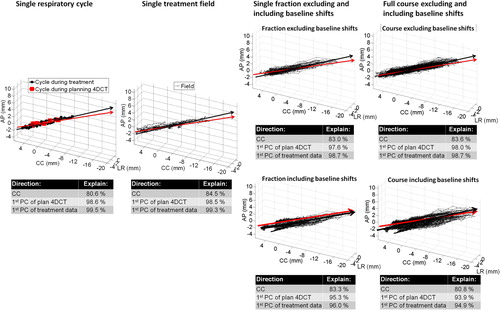
As illustrated in , in addition to the PCA analysis per respiratory cycle, PCA was also performed separately on all motion data of each treatment field, fraction, and treatment course both excluding ( top-right) and including ( bottom-right) intrafraction baseline shifts between treatment fields. The calculations excluding (or zeroing) baseline shifts were performed to assess pure intra-field respiratory motion. For each respiratory cycle, field, fraction, and course this provided the percentage of the total motion explained by a single first PC. For comparison, the percentages of respiratory cycle, field, fraction, and course motion explained by the CC direction and by the direction of the first PC of the planning 4DCT scan were also calculated (inset-tables in ).
Figure 2. All target positions during a single respiratory cycle, field, fraction, and the full course for Patient 2a shown together with the first principal component (PC) of the motion (black arrow) and the first PC of the motion in the planning 4DCT scan (red arrow). For fractions and courses, the motion data are shown both excluding (top) and including (bottom) intrafraction baseline shifts between fields. The percentage of total motion explained by the cranio-caudal (CC) direction, the first PC of the planning 4DCT scan, and the first PC of the motion itself during treatment is shown below the figures.
Results
Inter-cycle variations of peak-to-peak motion amplitude
In total 2998 respiratory cycles were observed during the 33 treatment fractions. The patient mean respiratory cycle length was 4.0 ± 0.7 seconds. The patient mean respiratory cycle peak-to-peak amplitude was 1.5 ± 0.8 mm (LR), 6.9 ± 3.5 mm (CC), 3.5 ± 2.6 mm (AP), and 7.9 ± 4.1 mm (3D). During seven of the 11 courses the mean 3D amplitude exceeded 5 mm. shows the variation of respiratory cycle amplitudes during each course together with the amplitudes observed in the 4DCT scans. No systematic amplitude differences were observed between the 4DCT scans and the treatment courses as seen by the small mean amplitude differences of less than 1 mm in . However, large differences occasionally occurred with the 6.6 mm 3D amplitude difference between the planning 4DCT and the treatment course for Patient 2b being the largest (). The control 4DCT showed better agreement than the planning 4DCT with the course mean amplitude (SD = 1.4 mm vs. 2.5 mm, ), however this difference was not significant (p = 0.09 using F-test for equal variances). The differences (SDs) between the amplitudes observed in the control and planning 4DCT scans (, bottom row) were similar to the differences between the planning 4DCT and treatment.
Figure 3. (a) Boxplot of 3D motion amplitude of all individual respiratory cycles during treatment together with motion observed in the 4DCT scans. The boxes show 25%, 50%, and 75% quartiles. Whiskers include the most extreme amplitudes. Seven treatment courses with mean 3D motion exceeding 5 mm (and selected for directionality analysis) are marked with an asterisk. Patient 2a and 2b denote the same patient (re-treated). (b) Mean 3D motion amplitude during treatment as a function of amplitude in the planning 4DCT scan. Error bars represent the standard deviation of individual respiratory cycle amplitudes during treatment. The straight line represents ideal unity correlation.
Table I. Difference (mean ± SD) between mean motion amplitude and directionality during the treatment courses and in the planning and control 4DCT as averaged over all courses.
shows the correlation between the 3D amplitudes in the treatment courses and the planning 4DCT (R = 0.85). The corresponding correlation between treatment and the control 4DCT was R = 0.94, while it was R = 0.83 between the planning 4DCT and the control 4DCT.
The SD of the 3D amplitudes within a course (error bars of ) was in mean 2.0 ± 1.6 mm. In total 77.3% and 95.5% of the amplitudes observed in the 22 planning and control 4DCTs deviated less than 1 SD (errors bar of ) and 2 SDs, respectively, from the corresponding mean course amplitude.
Inter-cycle variations of motion directionality
For each patient, shows the directionality (direction of first PC) of all individual respiratory cycles observed during treatment. The large circular contours represent 5° and 10° directionality deviations from the course mean directionality for each patient. For patients with small mean motion amplitudes (), several individual respiratory cycles were so small that the PCA was affected by the noise level of the data, which resulted in the large directionality variations shown in . Therefore, further directionality analysis was only performed for the seven courses with mean 3D motion amplitude exceeding 5 mm ().
Figure 4. Directionality of each individual respiratory cycle during treatment (small dots, yellow if 3D cycle amplitude was below 5 mm), during plan 4DCT scanning (big red dots), and during control 4DCT scanning (blue circles) shown in a spherical coordinate system as projected onto a unit sphere viewed from the south-pole. The inclination angle is the inclination relative to pure CC motion (center of sphere).The azimuthal angle describes the direction in the transversal plane, with 0° corresponding to no LR motion. Positions below the center correspond to simultaneous cranial-posterior motion. Large black circular contours represent 5° and 10° angle differences from the mean course directionality (center of the contours) for each patient. The percentage of respiratory cycles within the 10° contour is stated for each patient. (a) Patients with mean 3D motion amplitude exceeding 5 mm. (b) Patients with mean motion amplitude below 5 mm.
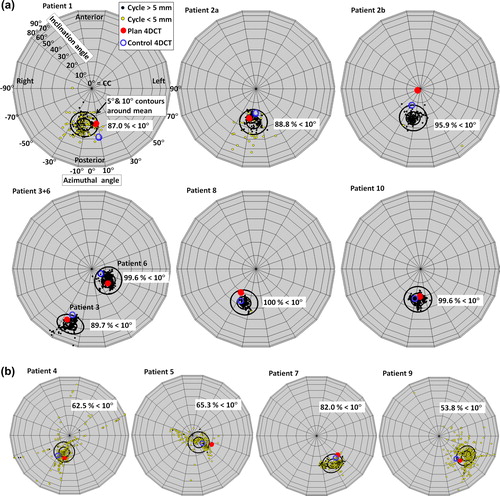
For these patients, in mean 66.0 ± 22.3% and 94.3 ± 5.7% of the individual respiratory cycles deviated less than 5° and 10°, respectively, from the course mean directionality. Deviations exceeding 10° were mainly observed for small irregular respiratory cycles with amplitude below 5 mm; see yellow dots in . For all patients, cranial motion correlated with posterior motion as seen in by the directionalities being below the center for all seven courses. The inclination of the directionality from the CC axis was between 20° and 30° for five of the seven courses. Averaged over all courses, the mean deviation between motion directionality of single respiratory cycles and the course mean directionality was 4.6°± 1.6°.
In five of 14 (35.7%) and in 11 of 14 (78.6%) planning and control 4DCT scans the directionality deviated less than 5° and 10°, respectively, from the course mean directionality (). The deviations between directionality in 4DCTs and during treatment are summarized in . The maximum directionality deviation between planning 4DCT and course mean directionality was 21.1° (Patient 2b, ).
In mean, 98.2 ± 2.2%, 1.8 ± 1.1%, and 0.1 ± 0.1% of the motion during individual respiratory cycles was explained by the first, second, and third PC, respectively. Therefore, when considerable motion was present, this motion was highly directional along the first PC with only slight non-linearity present (second PC > 0), but confined to a plane (third PC ˜0). For comparison, 3.2 ± 2.6%, 76.7 ± 15.2%, and 20.1 ± 13.9% of the motion was explained by the LR, CC, and AP directions, respectively (see also Supplementary Figure 1, available online at http://informahealthcare.com/doi/abs/10.3109/0284186X.2013.813638).
Motion explained by a single direction throughout treatment
summarizes similar PCA data as in when averaged over all patients. Excluding baseline shifts, in mean 97.7 ± 1.7% of all respiratory motion during a course was explained by the first PC. Despite the directionality deviations between the planning 4DCT scan and the treatment () the first PC of the planning 4DCT scan still explained 95.3 ± 4.2% of the respiratory motion throughout the full courses. However, intrafraction baseline shifts between fields resulted in a smaller percentage of motion being explained by a single direction (, columns 6–7).
Table II. Percentage of total motion during treatment explained by the CC direction, the direction of the first PC of the planning 4DCT scan, and the first PC of the motion itself during individual respiratory cycles, fields, fractions, and courses as averaged over all patients.
Discussion
The current paper presents the first investigation of the combined stability of motion amplitude and motion directionality throughout entire liver SBRT treatments at a conventional linear accelerator. Although the motion amplitude in the planning 4DCT scans correlated with, and showed sub-mm systematic difference from the mean amplitude during treatment, single amplitude differences of up to 6.6 mm were observed. Thus, a single planning 4DCT scan did not always accurately represent the mean motion amplitude during treatment. This conclusion for liver motion amplitudes was recently also underlined by Ge et al. [Citation7] and similar observations have been reported for lung treatments [Citation16]. The amplitude deviations (SDs) between the 4DCT scans and treatment and between the two 4DCT scans were to a large extent explained by the intra-patient breathing variations observed during treatment. The control 4DCT, which was acquired on the first treatment day, predicted motion during treatment slightly but not significantly better than the planning 4DCT and validation of motion amplitude based on a single control 4DCT can be uncertain. Potential amplitude deviations from 4DCT to treatment should be considered when designing individualized motion-including treatment margins.
The motion during individual respiratory cycles was highly directional and only slightly non-linear in agreement with Cyberknife-based observations by Suh et al. [Citation11]. The typical direction of motion (cranial-posterior during exhalation) agrees with CBCTs studies of liver motion by Park et al. [Citation10]. As an important addition, the present study showed that the directionality of individual respiratory cycles was stable throughout a treatment course and reasonably well predicted by the 4DCT scans () even though a single maximum deviation of 21.1° was observed.
It is important to note that breathing variations affect a 4DCT scan in two ways: 1) A single 4DCT only captures one respiratory cycle which may not be representative; and 2) breathing variations during 4DCT scanning are well known to cause image-artifacts in the 4DCT reconstructions [Citation8]. A thorough analysis of image artifacts is beyond the scope of the present study, but artifacts were observed in several of the scans.
Due to the combination of high and stable directionality a single direction explained almost all respiratory motion throughout the full treatment courses (). Despite the discrepancies between directionality during 4DCT scans and treatments, the first PC of the planning 4DCT scan still explained 95.3% of the respiratory motion during full treatments when baseline shifts were excluded. This indicates that more optimal (volume saving) motion encompassing margins could be created by adding margins along the PCs instead of the conventional LR, CC, and AP directions [Citation12]. However, considerable intrafraction baseline shifts were present. Including these shifts caused a less percentage of the total motion to be described by a single direction (, ). This shows that the directions of the baseline shifts were not perfectly aligned with intra-field respiratory motion, though some correlation between baseline shifts and respiratory motion has been shown [Citation6]. To fully exploit the potential of directional margins the baseline shifts should be minimized, e.g. by more frequent intrafraction target realignment or faster (high dose rate) treatment delivery [Citation17].
While a thorough quantitative analysis of directional motion margins is beyond the scope of this study a rough example of the potential clinical impact can be made as follows: For Patient 3 () the mean respiratory motion amplitude throughout treatment was 13.7 mm (first PC), 3.1 mm (second PC), and 0.5 mm (third PC) along the PCs while it was 3.8 mm (LR), 9.4 mm (CC), and 9.7 mm (AP) in the conventional patient coordinate system. Considering a typical 30 mm diameter spherical SBRT-target and prescribing conservative motion margins of half the peak-to-peak amplitude [Citation12] along the PCs and the LR, CC, and AP directions, respectively, translates into a volume sparing of 20% by prescribing the margins along the PCs instead of the LR, CC, and AP directions.
A limitation of the present study was the mixed cohort of patients with and without abdominal compression. The population was too small to quantify the effect of the compression which is expected to reduce the motion amplitude. However, compression did not guarantee small motion amplitudes as three (Patient 6, 8, and 10 in ) of seven patients with mean motion amplitude exceeding 5 mm had abdominal compression.
Besides directional margin investigations, other future plans with the motion data include simulations of realistic gating and tracking scenarios in both photon and promising proton-based liver SBRT [Citation18]. As indicated by the observed variable breathing motion, such strategies that actively adapts to the tumor motion during treatment should also be considered as possible ways to optimize the accuracy of the dose delivery [Citation19–23].
In conclusion, due to intra-patient breathing variations a single 4DCT scan did not always provide an accurate prediction of the mean tumor motion amplitude during liver SBRT treatment. However, the breathing motion was highly directional and the direction of motion was relatively stable throughout full treatment courses. This indicates that potentially margins aligned to the direction of motion could be designed in order to minimize the excess healthy tissue irradiation caused by conventional margins aligned with the LR, CC, and AP directions.
Supplementary Figure 1
Download PDF (4.8 MB)Declaration of interest: The authors report no conflicts of interest. The authors alone are responsible for the content and writing of the paper.
This work was supported by CIRRO – The Lundbeck Foundation Center for Interventional Research in Radiation Oncology, The Danish Council for Strategic Research, The Danish Cancer Society, and Varian Medical Systems.
References
- Høyer M, Muren LP. Stereotactic body radiation therapy – A discipline with Nordic origin and profile. Acta Oncol 2012; 51:564–7.
- Lock MI, Hoyer M, Bydder SA, Okunieff P, Hahn CA, Vichare A, et al. An international survey on liver metastases radiotherapy. Acta Oncol 2012;51:568–74.
- Ibarra RA, Rojas D, Snyder L, Yao M, Fabien J, Milano M, et al. Multicenter results of stereotactic body radiotherapy (SBRT) for non-resectable primary liver tumors. Acta Oncol 2012;51:575–83.
- Mendez Romero A, Zinkstok RT, Wunderink W, van Os RM, Joosten H, Seppenwoolde Y, et al. Stereotactic body radiation therapy for liver tumors: Impact of daily setup corrections and day-to-day anatomic variations on dose in target and organs at risk. Int J Radiat Oncol Biol Phys 2009;75:1201–8.
- Brock KK, Dawson LA. Adaptive management of liver cancer radiotherapy. Semin Radiat Oncol 2010;20:107–15.
- Worm ES, Høyer M, Fledelius W, Poulsen PR. Three- dimensional, time-resolved, intrafraction motion monitoring throughout stereotactic liver radiation therapy on a conventional linear accelerator. Int J Radiat Oncol Biol Phys 2013;86:190–7.
- Ge J, Santanam L, Noel C, Parikh PJ. Planning 4-dimensional computed tomography (4DCT) cannot adequately represent daily intrafractional motion of abdominal tumors. Int J Radiat Oncol Biol Phys 2013;85:999–1005.
- Korreman SS. Motion in radiotherapy: Photon therapy. Phys Med Biol 2012;57:R161–91.
- Kitamura K, Shirato H, Seppenwoolde Y, Shimizu T, Kodama Y, Endo H, et al. Tumor location, cirrhosis, and surgical history contribute to tumor movement in the liver, as measured during stereotactic irradiation using a real-time tumor-tracking radiotherapy system. Int J Radiat Oncol Biol Phys 2003;56:221–8.
- Park JC, Park SH, Kim JH, Yoon SM, Song SY, Liu Z, et al. Liver motion during cone beam computed tomography guided stereotactic body radiation therapy. Med Phys 2012; 39:6431–42.
- Suh Y, Dieterich S, Cho B, Keall PJ. An analysis of thoracic and abdominal tumour motion for stereotactic body radiotherapy patients. Phys Med Biol 2008;53:3623–40.
- van Herk M. Errors and margins in radiotherapy. Semin Radiat Oncol 2004;14:52–64.
- Worm ES, Hansen AT, Petersen JB, Muren LP, Praestegaard LH, Hoyer M. Inter- and intrafractional localisation errors in cone-beam CT guided stereotactic radiation therapy of tumours in the liver and lung. Acta Oncol 2010; 49:1177–83.
- Beddar AS, Kainz K, Briere TM, Tsunashima Y, Pan T, Prado K, et al. Correlation between internal fiducial tumor motion and external marker motion for liver tumors imaged with 4D-CT. Int J Radiat Oncol Biol Phys 2007;67:630–8.
- Jackson J. A user’s guide to principal components. New Jersey: Wiley; 2003.
- Muirhead R, van der Weide L, van Sornsen de Koste JR, Cover KS, Senan S. Use of megavoltage cine-images for studying intra-thoracic motion during radiotherapy for locally advanced lung cancer. Radiother Oncol 2011;99:155–60.
- Lang S, Shrestha B, Graydon S, Cavelaars F, Linsenmeier C, Hrbacek J, et al. Clinical application of flattening filter free beams for extracranial stereotactic radiotherapy. Radiother Oncol 2013;106:255–9.
- Petersen JBB, Lassen Y, Hansen AT, Muren LP, Grau C, Høyer M. Normal liver tissue sparing by intensity-modulated proton stereotactic body radiotherapy for solitary liver tumours. Acta Oncol 2011;50:823–8.
- Zhong R, Wang J, Jiang X, He Y, Zhang H, Chen N, et al. Hypofraction radiotherapy of liver tumor using cone beam computed tomography guidance combined with active breath control by long breath-holding. Radiother Oncol 2012;104: 379–85.
- Poulsen PR, Cho B, Sawant A, Ruan D, Keall PJ. Dynamic MLC tracking of moving targets with a single kV imager for 3D conformal and IMRT treatments. Acta Oncol 2010;49: 1092–100.
- Gabryś D, Kulik R, Trela K, Ślosarek K. Dosimetric comparison of liver tumour radiotherapy in all respiratory phases and in one phase using 4DCT. Radiother Oncol 2011;100:360–4.
- Depuydt T, Poels K, Verellen D, Engels B, Collen C, Haverbeke C, et al. Initial assessment of tumor tracking with a gimbaled linac system in clinical circumstances: A patient simulation study. Radiother Oncol 2013;106:236–40.
- Ravkilde T, Keall PJ, Hojbjerre K, Fledelius W, Worm E, Poulsen PR. Geometric accuracy of dynamic MLC tracking with an implantable wired electromagnetic transponder. Acta Oncol 2011;50:944–51.