Abstract
Atelectasis in lung cancer patients can change rapidly during a treatment course, which may displace the tumor/healthy tissues, or change tissue densities locally. This may result in differences between the planned and the actually delivered dose. With complex delivery techniques treatment verification is essential and inter-fractional adaptation may be necessary. We present the first clinical results of treatment adaptation based on an in-house developed three-dimensional (3D) portal dose measurement (PDM) system. Material and methods. A method was developed for 3D PDM combined with cone beam computed tomography (kV-CBCT) imaging. Lung cancer patients are monitored routinely with this imaging technique. During treatment, the first three fractions are analyzed with 3D PDM and weekly thereafter. The reconstructed measured dose is compared to the planned dose using dose-volume histograms and a γ evaluation. Patients having |γ|> 1 in more than 5% of the (primary tumor or organ at risk) volume were subjected to further analysis. In this study we show the PDM dose changes for five patients. Results. We detected relevant dose changes induced by changes in atelectasis in the presented cases. Two patients received two treatment adaptations after being detected with PDM confirmed by visual inspection of the kV-CBCTs, and in two other patients the radiation treatment plan was adapted once. In one case no dose delivery change was detected with PDM. Conclusion. The first clinical patients show that 3D PDM combined with kV-CBCT is a valuable quality assurance tool for detecting anatomical alterations and their dosimetric consequences during the course of radiotherapy. In our clinic, 3D PDM is fully automated for ease and speed of the procedure, and for minimization of human error. The technique is able to flag patients with suspected dose discrepancies for potential adaptation of the treatment plan.
Volumetric-modulated arc therapy (VMAT) is a complex radiation dose delivery technique capable of delivering dose highly conformal to the tumor in a short delivery time [Citation1]. For VMAT the gantry angle, rotation speed, field shape and dose rate are continuously varied during treatment delivery. Due to the highly conformal dose achieved with VMAT and the complexities of the radiation delivery, quality assurance (QA) is more difficult to perform in comparison with conformal or intensity-modulated radiotherapy (IMRT). Dose verification of such a complex delivery modality, both pre- and in-treatment, is vital to maintain accurate dose delivery throughout a treatment course. VMAT QA is predominantly achieved with films, ion chamber arrays, diode arrays or the electronic portal imaging device (EPID) [Citation2,Citation3]. Portal dose measurement (PDM) with an EPID has been demonstrated a valuable means for dose verification both pre- and in-treatment [Citation3,Citation4]. At MAASTRO clinic we recently embarked on three-dimensional (3D) EPID dosimetry for both pre- and in-treatment dose verification, and the results of the EPID dosimetry method are used to adapt treatment when necessary. During the treatment this is done in combination with a kilo Voltage (kV) cone beam computed tomography (CBCT) patient image.
Atelectasis, i.e. collapse or closure of the lung, is a condition frequently occurring in lung cancer patients and it can change rapidly during a treatment course, potentially displacing the tumor/healthy tissues or changing local tissue densities. The condition may result in differences between the planned and the actually delivered radiation dose. With VMAT, treatment verification is essential to ensure error-free treatment delivery, for inter-fractional adaptation may be necessary to account for changing patient geometry. We have introduced PDM to acquire data for the definition of an adaptive treatment protocol for lung cancer patients with atelectasis.
In this study we present clinical results for five lung cancer patients undergoing treatment adaptation based on PDM.
Material and methods
Equipment and 3D portal dose reconstruction
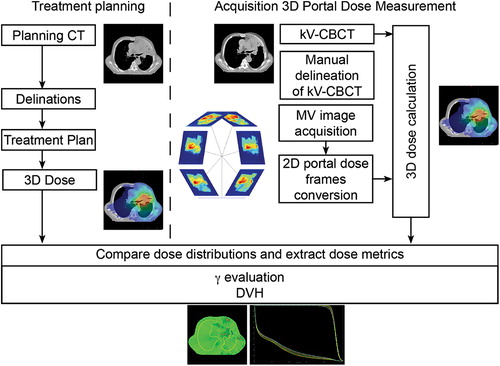
Portal images are acquired using the aSi EPID of a Varian TrueBeam linear accelerator (Varian Medical Systems, Palo Alto, CA, USA). The linac is equipped with a kV-CBCT imager and can deliver photon beams of 6 and 10 MV. Portal images for 3D dosimetry are acquired with Varian's iTools, a software package to capture all individual image frames during the VMAT delivery. This is essential since the native TrueBeam image acquisition software can only export integrated EPID images. Integrated images are insufficient to calculate a 3D portal dose distribution. shows the workflow of the PDM procedure. 2D megavoltage (MV) EPID images/frames were acquired during treatment with the image acquisition workstation. These MV EPID images were automatically converted to 2D portal dose images using an in-house developed algorithm and a dose-guided radiotherapy workflow [Citation5,Citation6]. The 2D portal dose images were subsequently automatically processed by a 3D portal dose reconstruction algorithm to calculate the true delivered 3D patient dose distribution of the day from the kV-CBCT image acquired immediately prior to treatment [Citation4]. For this study we used Varian's treatment planning system (TPS) Eclipse with dose calculation algorithm Acuros for both the calculation of the planned dose and the PDM. 3D PDM was used to quantify the dosimetric effect of the anatomical changes. The measured 3D portal dose was automatically compared to the planned dose with a γ evaluation [Citation7,Citation8]. In addition, dose-volume histograms (DVHs) were compared. The entire workflow from image acquisition to presentation of the 3D reconstructed dose distributions is a fully automated process. PDM not passing certain γ criteria are automatically flagged and subjected to further analysis. At MAASTRO clinic all patients (approx. 4000 per year) receive PDM.
Figure 1. Workflow of the PDM acquisition and extraction of dose metrics from the DVH and γ evaluations. On the left side a typical treatment planning process is depicted; the acquisition of the planning CT and the delineation of target volumes and organs at risk resulting in a treatment plan and planned or desired dose. This dose is the reference dose and is compared with the PDMs. On the right side the treatment process is depicted, the acquisition of the PDM. First kV-CBCT is acquired for the patient geometry of the day. Second the treatment beam itself is imaged with iTools. The MV image acquisition and the image frames are converted into 2D portal dose frames. Together with the kV-CBCT and the 2D portal dose frames a 3D dose calculation can be performed. This PDM is then compared with a γ evaluation and a DVH comparison to the planned or desired dose, and flagged for further investigation when the γ and/or DVH criteria fail. When it is flagged the kV-CBCT is re-delineated and compared in further detail.
Adaptive protocol and patients
At MAASTRO clinic all lung cancer patients with atelectasis apparent in the pre-treatment images are subjected to a protocol aimed at detecting anatomical changes and thus facilitating treatment adaptation. In this protocol a respiratory correlated (RC-) CT with 18F-fluorodeoxyglucose positron emission tomography (FDG-PET) is acquired for radiation planning. At several time points throughout the treatment course (first three fractions and every fifth fraction thereafter) kV-CBCT images for setup correction and visual detection of anatomical changes are acquired together with a 3D PDM. The process for treatment adaptation is as follows: First, the 3D PDM is automatically flagged for further investigation and possible treatment adaptation if the |γ|> 1 in more than 5% of the pixels in the clinical target volume (CTV; for primary tumor, CTV-1; for lymph nodes, CTV-2), using dose and distance-to-agreement criteria of 3%/3 mm. Second, the radiation oncologist visually inspects every kV-CBCT flagged by 3D PDM and treatment is adapted if the atelectasis changes by more than 7 mm in any direction. When one of the here presented patients’ plans was flagged for adaptation based on the PDM and confirmed by visual inspection, the CTV of the primary tumor was re-delineated manually on the kV-CBCT image, and the DVH and γ metrics (fail rate) were re-calculated. Other re-delineated structures were the body contour, the non-involved lung, the esophagus and the spinal cord. The main DVH metrics analyzed were the volume receiving 99% of the dose (V99%) and the dose to 5% of the volume (D5%) of the CTVs. V99% was included to investigate whether coverage of the CTV was altered due to a change in patient anatomy, and D5% was used for the detection of hot spots within the CTV volumes. Finally, the decision for re-planning was based on both quantitative dose analysis and visual inspection of the kV-CBCT.
In case of treatment adaptation, a new FDG-PET/CT is acquired and a new radiation plan is created for the remainder of the treatment, or until again replanning is deemed necessary. For this study we show the results for five lung cancer patients treated with this adaptive protocol, for which treatment plans were adapted in four patients. In one patient (Case A) a clear atelectasis was present from the beginning of treatment onwards, but this patient was neither flagged nor did considerable deformations occur during treatment. This patient was added as a negative control for comparison with the four who underwent adaptation.
Results
In four out of five cases shown the dose was adapted, based on PDM confirmed with a visual inspection of the kV-CBCT. shows the γ and DVH metrics for the analyzed cases.
Table I. γ metrics and DVH metrics for the five patient cases. For details see text.
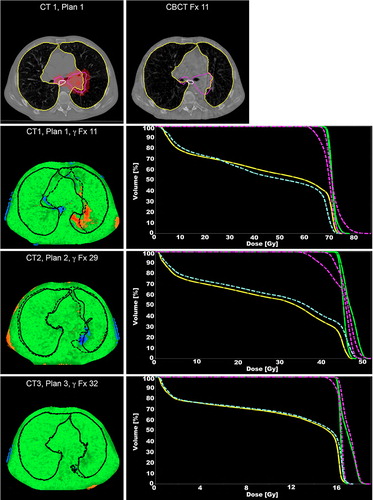
Case B showed an increase in atelectasis and large shifts of the mediastinum. These changes caused failure of the γ criteria for the clinical target volumes, with a γ fail rate of 12% and 24% for the CTV-1and CTV-2, respectively. shows the γ measurements for this patient throughout the course of treatment as well as the DVHs of the PDM. The dose analysis and DVH metrics consequently showed that the coverage of the CTVs decreased drastically (, patient B, plan I). After treatment adaptation, the atelectasis and patient geometry changed again influencing the tumor coverage with a high γ fail rate (, patient B, plan II). Subsequently, a third plan was created and thereafter the dose of the PDM and the planned dose agreed reasonably (; DVH of plan 3). Although the γ fail rate for CTV-2 exceeded the threshold of 5% slightly it was decided to not adapt treatment again because there were no clear visual differences between the third planning FDG-PET/CT and the kV-CBCT, and because the remaining treatment-time (eight fractions, four days) was too short for another full re-planned adaptation.
Figure 2. The top left panel shows the planning CT for the 1st treatment plan of case B with delineations of the lungs (yellow), esophagus (white) and CTVs (purple). The 95% isodose is also indicated (red color-wash). Next to the planning CT a re-delineated CBCT slice of fraction 11 is shown. The lower panels show the γ evaluations for fractions 11, 29 and 32, respectively. Voxels failing the (3%, 3 mm) criteria show up in blue (under dosage) and red (overdosage). The lungs are drawn in black, the dashed lines are the CBCT delineations and the solid lines are the planning CT delineations. Next to the γ plots are the different DVHs for the CTV (planned: green; measured: purple) and the esophagus (planned: yellow; measured: blue).
Case C showed a drastic decrease in atelectasis after the first three fractions flagged by the PDM with a high γ fail rate (, patient C). Visual inspection of the kV-CBCT by the radiation oncologist and a second planning FDG-PET/CT image consequentially showed a CTV shift. When taking the CTV shift into account the CTV coverage (V99%) decreased by 10%, from 93% (V99% for TPS and CBCT) to 83%. During the delivery of the second plan the atelectasis returned and the plan was flagged by the PDM. A subsequent treatment adaptation was conducted because a large atelectasis had formed close to the tumor. Even though this third plan still showed a high γ fail rate of 17% caused by a change in patient anatomy of 3 mm no significant differences in DVHs were found. This can be explained by a change in patient anatomy (3 mm) compared with the applied γ criteria (3%, 3 mm). No treatment adaptation was conducted because the shift of 3 mm was within the 7 mm threshold and due to the limited number of remaining fractions compared to the delay introduced by re-planning.
Initially, case D had a relatively low γ fail rate for CTV-1 (8%) albeit above the threshold of 5%. However, the peritumoral anatomy showed large deformations exceeding 7mm on the kV-CBCT. Due to deformations and shifts in the CTV, the tumor coverage (V99%) dropped to 67%. After treatment adaptation, renewed large deformations were detected towards the end of the treatment course resulting in a high γ fail rate (, patient D, plan II). The treatment was not adapted again since only a small number of fractions were left. Nevertheless, the mean dose to the tumor and affected lymph nodes increased by 2% and 3%, respectively, explaining the γ high fail rate.
Finally, case E showed a high γ fail rate (22%) for an atelectasis in the right lung that had formed at the start of the treatment, consequently shifting the tumor outside the CTV. The changes in anatomy of more than 7 mm and the compromised CTV coverage (, patient E, plan I), led to the design of a new treatment plan. After plan adaptation the γ fail rate of PDM dropped drastically confirmed by the absence of visual changes on kV-CBCT. This treatment was not flagged again by the γ evaluation after the first adaptation.
In general, in all cases flagged with PDM the change in atelectasis also shifted the tumor drastically sometimes moving the tumor partially out of the high dose area (case D and E). Furthermore, we found that in two cases more than one adaptation was necessary over the course of treatment because atelectasis which had disappeared returned (case B and C).
Discussion
Image-guided radiotherapy and VMAT has facilitated the delivery of high precision radiotherapy. kV-CBCT images are acquired during several treatment fractions to ensure correct patient positioning and dose delivery. Currently, it is common practice for radiation oncologists and technicians to visually inspect the CBCT images to identify possible anatomical changes that would influence the dose in such a way that treatment adaptation is necessary. This visual qualitative inspection of CBCT scans is time-consuming and prone to variation in interpretation. At MAASTRO clinic we have implemented a fully automatically 3D PDM at certain time points and discrepancies between the planned dose and PDM exceeding certain γ fail rate levels are flagged. The main advantage of such a method is that a quantitative analysis is presented and potential problems are flagged based on user independent criteria, designed to automatically flag clinical relevant dose delivery changes during treatment. The quantitative analysis of the dose distributions, the DVHs and the automated flagging procedure reduce the time that has to be spent on checking and analyzing the CBCT images. This procedure has facilitated the decision-making and individual treatment adaptation for the demonstrated cases. Furthermore, we have seen that dose changes detected with the γ evaluation do not always correlate with clear changes in the DVH. Recent reports of 2D planar EPID dosimetry and changes in DVHs show a weak or no correlation [Citation9,Citation10] while others have reported otherwise and have shown a correlation between patient setup changes and changes in the DVH [Citation11]. For the correlation between 3D PDM and DVHs no results were reported yet. The process of re-planning including re-delineation is still a time-consuming procedure in daily clinical practice. One of the major disadvantages of kV-CBCT is that tumor re-delineation is difficult based on these images [Citation12]. The difference in image quality between the kV-CBCT and CT is an issue. This difference can be reduced by optimizing the reconstruction and acquisition methods of the kV-CBCT improving the image quality, closer to the CT image quality [Citation13]. Furthermore, the re-delineation process could be supported by using deformable image registration and contour propagation. However, considerable limitations have been reported [Citation14] when large deformations are present.
Nevertheless, it remains vital to analyze at least in a quantitative way the effect of anatomical changes. We have illustrated in the presented cases that the reduction or development of atelectasis can shift the tumor drastically, easily by more than 5 mm, which may move the tumor out of the high dose volume. This phenomenon was observed in two of the presented cases where full clarification was gathered from the new planning FDG-PET/CT. PDM and kV-CBCT are therefore complementary in the decision making for re-planning or other adaptive strategies. Adapting treatments based on single fraction information may not always be necessary, therefore observing dose delivery trends in a treatment are of importance for decision making [Citation5].
Several alternative adaptive strategies have been proposed by others, e.g. using an in-room CT to re-calculate the dose on a weekly basis or when image guidance indicated a re-calculation of the dose [Citation15], using deformable registration to propagate contours for online and offline re-planning [Citation14,Citation16]. Another adaptive approach consists of pre-calculating multiple plans and selecting the best fitting plan of the day [Citation17]. Our PDM automated flagging was introduced in daily clinical practice and time-consuming re-planning was only performed after a detailed analysis by a radiation oncologist but only for the flagged instances. The abovementioned alternative adaptive strategies still rely on human-intervention, to decide whether or not to adapt except for the multiple pre-calculated plan approach. In this approach the best suited plan of the day is selected based on the image(s) just prior to treatment. Our method could be added to this procedure in order to validate the treatment delivery and improve plan selection. With the in-room CT imaging a similar automated analysis is possible as in our method, which could improve efficiency of this method. However, the in-room CT analysis does not take into account the actual linac delivery at the moment of treatment like PDM does. The main advantage of using an in-room CT is that the images may be used to identify apparent shifts of the tumor. Several large shifts of the tumor have been observed in our study, which were difficult to see in the kV-CBCT but were apparent in a new FDG-PET/CT. In general our method is complementary to most adaptive strategies and can be used to either reduce decision time or validate results of the treatment adaptation, and technology such as propagation of contours would contribute significantly towards improve PDM flagging accuracy.
We have used 3D PDM for treatment adaptation. Others [Citation18] have reported on 2D PDM to catch dose errors and intervene with the treatment. These interventions were found to be necessary in only a small amount of cases; 17 of 4337 patients from which seven were classified as patient anatomy changes. They extended their 2D PDM back-projection method to 3D PDM and included verification of VMAT treatments [Citation3]. However, they have reported accuracy issues with their back-projection algorithm for lung cancer patients because their method did not account correctly for tissue inhomogeneity which was resolved by using an in-aqua solution [Citation19]. Our 3D PDM method uses a forward dose calculation using the geometry of the day (kV-CBCT) [Citation4]. The difference between these studies and ours is that they use the PDMs mainly as a patient-specific quality assurance tool and not for informed decision making for adaptive radiotherapy.
One of the main advantages of the PDM method is the immediate quantification of under/overdosage when no adaptation is applied. It can also play a role in informed decision-making when adapting the plan. Cases were flagged with PDMs and confirmed with the kV-CBCT analysis. However, in the future error flagging criteria and trend analyses need to be further developed for the detection of specific dose delivery discrepancies and improved decision-making. Furthermore, the sensitivity and specificity of the PDM method needs further investigation. We conclude that 3D PDM is a promising method to reveal dose discrepancies and changes over time for lung cancer patients and potentially for other cancer sites as well.
Declaration of interest: The authors report no conflicts of interest. The authors alone are responsible for the content and writing of the paper.
References
- Otto K. Volumetric modulated arc therapy: IMRT in a single gantry arc. Med Phys 2008;35:310–7.
- Zhu J, Chen L, Jin G, Luo G, Cao W, Liu X. A comparison of VMAT dosimetric verifications between fixed and rotating gantry positions. Phys Med Biol 2013;58:1315–22.
- Mans A, Remeijer P, Olaciregui-Ruiz I, Wendling M, Sonke J-J, Ben Mijnheer, et al. 3D Dosimetric verification of volumetric-modulated arc therapy by portal dosimetry. Radiother Oncol 2010;94:181–7.
- van Elmpt W, Petit S, De Ruysscher D, Lambin P, Dekker A. 3D dose delivery verification using repeated cone-beam imaging and EPID dosimetry for stereotactic body radiotherapy of non-small cell lung cancer. Radiother Oncol 2010;94:188–94.
- Persoon LCGG, Nijsten SMJJG, Wilbrink FJ, Podesta M, Snaith JAD, Lustberg T, et al. Interfractional trend analysis of dose differences based on 2D transit portal dosimetry. Phys Med Biol 2012;57:6445–58.
- Nijsten SMJJG, van Elmpt WJC, Jacobs M, Mijnheer BJ, Dekker ALAJ, Lambin P, et al. A global calibration model for a-Si EPIDs used for transit dosimetry. Med Phys 2007; 34:3872–84.
- Low DA, Dempsey JF. Evaluation of the gamma dose distribution comparison method. Med Phys 2003;30: 2455–64.
- Persoon LCGG, Podesta M, van Elmpt WJC, Nijsten SMJJG, Verhaegen F. A fast three-dimensional gamma evaluation using a GPU utilizing texture memory for on-the-fly interpolations. Med Phys 2011;38:4032–5.
- Nelms BE, Zhen H, Tomé WA. Per-beam, planar IMRT QA passing rates do not predict clinically relevant patient dose errors. Med Phys 2011;38:1037–44.
- Kruse JJ. On the insensitivity of single field planar dosimetry to IMRT inaccuracies. Med Phys 2010;37:2516–24.
- Nijsten SMJJG, van Elmpt WJC, Mijnheer BJ, Minken AWH, Persoon LCGG, Lambin P, et al. Prediction of DVH parameter changes due to setup errors for breast cancer treatment based on 2D portal dosimetry. Med Phys 2009;36:83–94.
- Njeh CF, Dong L, Orton CG. IGRT has limited clinical value due to lack of accurate tumor delineation. Med Phys 2013;40:040601.
- Elstrøm UV, Muren LP, Petersen JBB, Grau C. Evaluation of image quality for different kV cone-beam CT acquisition and reconstruction methods in the head and neck region. Acta Oncol 2011;50:908–17.
- Thor M, Petersen JBB, Bentzen L, Høyer M, Muren LP. Deformable image registration for contour propagation from CT to cone-beam CT scans in radiotherapy of prostate cancer. Acta Oncol 2011;50:918–25.
- Schwartz DL, Garden AS, Shah SJ, Chronowski G, Sejpal S, Rosenthal DI, et al. Adaptive radiotherapy for head and neck cancer – dosimetric results from a prospective clinical trial. Radiother Oncol 2013;106:80–4.
- Chao M, Xie Y, Xing L. Auto-propagation of contours for adaptive prostate radiation therapy. Phys Med Biol 2008; 53:4533–42.
- Gill S, Pham D, Dang K, Bressel M, Kron T, Siva S, et al. Plan of the day selection for online image-guided adaptive post-prostatectomy radiotherapy. Radiother Oncol 2013:107: 165–70.
- Mans A, Wendling M, McDermott LN, Sonke JJ, Tielenburg R, Vijlbrief R, et al. Catching errors with in vivo EPID dosimetry. Med Phys 2010;37:2638–44.
- Wendling M, McDermott LN, Mans A, Olaciregui-Ruiz I, Pecharromán-Gallego R, Sonke J-J, et al. In aqua vivo EPID dosimetry. Med Phys 2012;39:367–77.