Abstract
Background. The increasing complexity of radiotherapy (RT) has motivated research into three-dimensional (3D) dosimetry. In this study we investigate the use of 3D dosimetry with polymerizing gels and optical computed tomography (optical CT) as a verification tool for complex RT: dose painting and target tracking. Materials and Methods. For the dose painting studies, two dosimeters were irradiated with a seven-field intensity modulated radiotherapy (IMRT) plan with and without dose prescription based on a hypoxia image dataset of a head and neck patient. In the tracking experiments, two dosimeters were irradiated with a volumetric modulated arc therapy (VMAT) plan with and without clinically measured prostate motion and a third with both motion and target tracking. To assess the performance, 3D gamma analyses were performed between measured and calculated stationary dose distributions. Results. Gamma pass-rates of 95.3% and 97.3% were achieved for the standard and dose-painted IMRT plans. Gamma pass-rates of 91.4% and 54.4% were obtained for the stationary and moving dosimeter, respectively, while tracking increased the pass-rate for the moving dosimeter to 90.4%. Conclusions. This study has shown that the 3D dosimetry system can reproduce and thus verify complex dose distributions, also when influenced by motion.
The current clinical practice in radiotherapy (RT) is to deliver a uniform dose to a predefined static planning target volume that is believed to accommodate the tumor with a high probability given also its anticipated motion. To increase tumor local control rates while sparing healthy tissue, new radiotherapy methods are constantly being developed. One such example is the introduction of dose painting, where the uniform dose approach is replaced by a highly individualized and heterogeneous dose distribution that is designed to give additional dose to target subvolumes with high radio-resistance due to, e.g. hypoxia as quantified by functional imaging [Citation1–8]. However, such complex treatment methods can be compromised by tumor motion which has led to the development of real-time target tracking, where the static target approach is replaced by continuous re-alignment of the treatment field to follow the tumor motion [Citation9–17]. These emerging approaches put substantially higher demands on the dosimetric approaches than current treatment delivery methods due to their complexity in planning and delivery. This has motivated research into dosimetry methods that can measure dose distributions in three dimensions (3D) with high resolution [Citation18–20]. The use of 3D dosimetry as a dose verification tool has previously been investigated for gating, both with optical computed tomography (optical CT) in combination with radiochromic dosimeters as well as with magnetic resonance imaging (MRI) and polymerizing dosimeters [Citation21,Citation22]. In addition, target tracking of a respiratory-like motion has been measured with MRI and polymerizing dosimeters [Citation23]. Measurements of complex radiotherapy delivery with optical CT on polymerizing dosimeters have previously been suggested [Citation24,Citation25] and performed with intensity modulated radiotherapy (IMRT) [Citation26].
In this study we investigated the possibility of using 3D dosimetry with optical CT and polymerizing gel dosimeters as a verification tool for IMRT with the increased dosimetric complexity resulting from a dose painting prescription, as well as for volumetric-modulated arc therapy (VMAT) delivery with and without tracking of patient-measured target motion.
Material and methods
The dosimeters
A normoxic polyacrylamide gel, nPAG, and the commercially available BANG3-pro2 gel dosimeter (MGS Research Inc., CT, USA) were both used in this study. The BANG dosimeters were received in kits which were mixed according to instructions from the supplier.
The recipe of the nPAG dosimeter was based on that by Ceberg et al. [Citation21]. The dosimeter consisted of 5% (w/w) gelatin (porcine skin, type A, 300 bloom, electrophoresis grade, Sigma-Aldrich), 3% (w/w) acrylamide (≥ 99%, electrophoresis grade, Sigma-Aldrich), 3% (w/w) N,N’-methylenebisacrylamide (≥ 99.5%, electrophoresis grade, Sigma-Aldrich) and 10 mM tetrakis(hydroxymethyl)phosponium chloride, THP (˜80% in H2O, technical grade, Sigma-Aldrich). Both types of dosimeters were after manufacturing poured into cylindrical containers of approximately 15 cm height and 15 cm diameter.
Dose painting experiments
Two BANG dosimeters were irradiated with a seven-field IMRT plan; the first dosimeter with a uniform dose in the target volume and the second dosimeter with a similar plan, but modified to include target dose painting by contours based on positron emission tomography (PET) imaging with the 18F-fluoroazomycin arabinoside (FAZA) tracer [Citation27]. The measured dose distributions were subsequently compared to calculated dose distributions obtained from a treatment planning system (Eclipse, Varian, CA, USA).
Motion and target tracking experiments
Three nPAG dosimeters were irradiated with a VMAT prostate plan while placed on a three-axis motion stage. During irradiation, the first dosimeter was left stationary as a reference while the second dosimeter was subjected to motion, and the third dosimeter was subjected to both motion and dynamic multileaf collimator (DMLC) tracking [Citation12,Citation17]. Movement was based on a patient-measured prostate trajectory [Citation12], with a continuous drift in the cranial and anterior directions to a maximum displacement between 6 and 7 mm in both axes. Target tracking was performed with an electromagnetic transponder system (RayPilot, MicroPos AB, Sweden), where a transponder was placed on the motion stage next to the dosimeter [Citation9,Citation15]. The position of the transponder was then detected in 3D at 30 Hz in real time by antennas placed on a board below the motion-stage support. To investigate the dosimetric effect of movement and tracking with the 3D dosimetry system, the measured dose distributions of the three gels were subsequently compared to a stationary dose distribution calculated in a treatment planning system (Eclipse 10, Varian, CA, USA).
Dose read-out and data analysis
Optical dose read-out of the dosimeters was performed with the commercially available optical CT scanner, OCTOPUS IQ (MGS Research Inc., CT, USA) [Citation28]. Scanning was performed with 300 projections distributed over a 360° dosimeter rotation for the dose painting experiments, while a 180° rotation was used for the dosimeters used in the tracking studies. To obtain the optical response caused by irradiation, the dosimeters were scanned before and after irradiation, and the change in optical density caused by irradiation was calculated. The 3D distribution of the change in optical density was then reconstructed using an inverse Radon transformation [the iradon algorithm in MATLAB (Mathworks, MA, USA)] with a resolution of 1 × 1× 1 mm3. After reconstruction, the optical data were spatially matched with the calculated dose distribution by matching the surface of the dosimeter container from a pre-irradiation x-ray CT scan with the optical measurements.
Calibration of the measured dose distribution was performed by dividing the measured distribution and the calculated distribution into subvolumes of 10 × 10 × 10 mm3. Within each subvolume, a dose histogram of the calculated distribution and an optical response histogram of the measured distribution were both fitted to Gaussian functions. The center positions of the Gaussian fits for all subvolumes of the calculated dose distribution were then plotted versus the corresponding center positions of the measured dose distribution to create a correlation plot. As discussed in more detail in Supplementary Appendix 1, to be found online at http://informahealthcare.com/doi/abs/10.3109/0284186X.2013.813965, such plots provide a first test of the correlation between calculation and measurements and can furthermore be used to obtain a calibration function. Some subvolumes did not produce bell-shaped histograms, which resulted in very poor Gaussian fits. All fits with an R-squared value below 0.7 were therefore removed from the analysis together with fits where the uncertainty of the center position exceeded the maximum dose of the dosimeters. The remaining data points were fitted to a linear expression to obtain a calibration function, as detailed in Supplementary Appendix 1, to be found online at http://informahealthcare.com/doi/abs/10.3109/0284186X.2013.813965.
After the calibration, a straightforward voxel- to-voxel analysis was performed by calculating the percentage difference between the measured and the calculated dose distributions for each 1 × 1× 1 mm3 voxel. The spatial matching of the dose distributions was then fine tuned (on the few-millimeter level) by minimizing the standard deviation of the analysis when spatially shifting a dose distribution in order to compensate for possible setup errors and obtain a direct dosimetric comparison of the measured and calculated dose distributions. Changes in the standard deviation were observed with spatial shifts as low as 1 mm, i.e. the resolution limit of this study (data not shown). This optimization procedure could only be applied to similar distributions, i.e. it was not applied for the tracked dosimeter and the dosimeter with motion since they were not expected to fully match the calculated distribution. Therefore, the shift determined for the stationary distribution given the VMAT treatment was also applied for the dosimeter with motion and the tracked dosimeter.
To include both dosimetric and spatial accuracy, a gamma analysis was performed [Citation29]. Having adjusted the dose distribution for spatial mismatch, the gamma analysis accounted for local spatial differences and minimized the effect of noise. Comparison between the measured dose (reference distribution) and the calculated dose (evaluated distribution) were performed by calculating a 3%-global/3 mm 3D gamma map and a corresponding gamma pass-rate, i.e. the amount of gamma values below 1. The full dosimetric volume was included in the analysis without any filters applied; however, a 5% low-dose cutoff was used when calculating the gamma pass-rate.
Results
The calibrations showed that the dose response was linear for all dosimeters, with linear calibration fits resulting in R-squared values above 0.96. The effect of motion was clearly observed in the correlation plot of the dosimeter induced with motion without tracking, by a larger scattering of points. In addition, artifacts caused by oxygen inhibiting the dose response could be identified in the stationary and tracked measurements. Further details of the calibrations are described in depth in Supplementary Appendix 1, to be found online at http://informahealthcare.com/doi/abs/10.3109/0284186X.2013.813965.
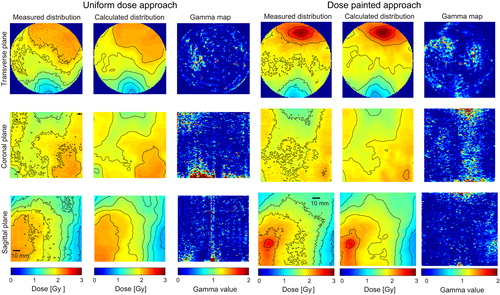
In the dose painting experiment, both the uniform and the dose painted distributions were reproduced well () with gamma pass-rates of 95.3% for the uniform dose approach and 97.3% for the dose painting approach. The mean difference of the voxel-to-voxel comparison was 0.6% and 0.2% with standard deviations of 2.0% and 1.7%, respectively.
Figure 1. Measurements of the uniform dose approach and the dose painting approach of the seven-field IMRT dose distribution together with the calculated dose distribution and gamma analysis between the measured and calculated distributions, viewed in the transverse plane, the coronal plane and the saggital plane. The dose distributions are shown with 10–90% isodose curves with 10% intervals.
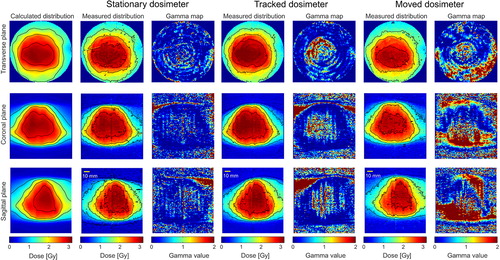
The stationary dosimeter and the tracked dosimeter of the VMAT plan both contained regions of failed gamma values in the upper part of the dosimeter along the dosimeter walls. These artifacts are attributed to oxygen inhibiting the optical response, and the upper 50 mm were therefore removed from the gamma pass-rate calculations for all three dosimeters. The stationary dosimeter and the tracked dosimeter then resulted in similar pass-rate of 91.4% and 90.4%, respectively, when compared to the calculated stationary dose distribution (). The mean percentage differences obtained from the voxel-to-voxel analysis were 0.2% and 0.9% with standard deviations of 3.4% and 2.8%, respectively. The dosimeter with motion but without tracking performed very poor when comparing with the stationary calculated dose distribution. The gamma pass-rate was 54.4% and the mean difference was 3.6% with a standard deviation of 8.1%.
Figure 2. Calculated stationary dose distribution followed by measurements and calculated gamma map of the stationary dosimeter, the tracked dosimeter and the dosimeter with motion induced. The dose distributions are shown with 30%, 50%, 70% and 90% isodose curves.
Discussion
Performance of 3D dosimetry has previously been studied, most extensively with the use of MRI for dose read-out [Citation21,Citation23,Citation30]. Optical CT has been shown to perform close to that of MRI as a dose read-out method [Citation28], and due to the limited access to MRI for dosimetry [Citation18], optical CT may therefore be preferable. In this study, dosimetric measurements of dose painting and target tracking were therefore performed to investigate the possibility of using 3D dosimetry with optical CT and polymerizing dosimeters as a verification tool for the complex RT delivery methods, dose painted IMRT and VMAT with target tracking. The measurements were in general in good agreement when compared to calculated dose distributions, with all but one resulting in gamma pass-rate above 90% and with the best result giving a pass-rate of over 97%. The latter was for the most complex dose distribution given in this study, the dose painted IMRT plan. The uniform dose approach of the treatment resulted in a 2% lower pass-rate and slightly higher mean difference and standard deviation, which is probably related to artifacts. Overall, the high pass-rates show that the current 3D dosimetry system can easily resolve complex dose distributions in modern radiotherapy including the increased complexity and dose gradients of upcoming methods such as dose painting. However, while the dosimetry system performed well here, there is an upper limit to how high dose gradients the scanning system can reproduce. This is due to irradiation-induced refractive index changes in the polymerizing gel dosimeter, as discussed in detail in Supplementary Appendix 1, to be found online at http://informahealthcare.com/doi/abs/10.3109/0284186X.2013.813965.
As expected, the dosimeter with induced motion resulted in a low gamma pass-rate of 54.3%. The maximum shift from the original position was about 6 mm in both the cranial and the anterior directions, which corresponds well with the skewed regions of failed gamma points in the gamma analysis as seen in the right column of . The low pass-rate shows that the smearing of the dose distribution due to small spatial shifts is easily observed with the current dosimetry system.
The stationary dosimeter and the tracked dosimeter of the VMAT plan scored equally well in the gamma analyses when compared to the calculated stationary distribution. This indicates the benefit of tracking when comparing with the dosimeter induced with motion but without tracking. However, the pass-rates were lower than that of the seven-field IMRT measurements. This, and the difference between the stationary dosimeter and tracked dosimeter, probably originates from a larger amount of artifacts present. The most pronounced are ring artifacts which are clearly observed as rings in the transversal plane and as vertical lines in the coronal and sagittal plane of the gamma maps for both the stationary and the tracked dosimeter (), but most pronounced for the latter. The artifacts presumably originate from setup errors during pre- and post-irradiation optical scanning and show the sensitivity of optical CT since setup errors are expected to be below a few millimeters.
The mean difference of the voxel-to-voxel comparison reveals the performance of the calibration procedure when assuming that the compared dose distributions are identical. The mean difference was below 0.9% when excluding the dosimeter induced with motion, indicating that the dosimetric calibration procedure proposed in this study performed well in the dose range included in the analysis. In addition, the calibration procedure proved itself a sensitive test of artifacts or mismatch between dose distributions, and with the proposed method, the calibration is performed within the dosimeter itself. The standard deviation was 3.4% or below which indicates the dosimetric precision of the measurements since the measured and calculated dose distributions were spatially overlapped.
Measurements with the same target motion but with a different tracking system and with the use of 2D ion chamber array dosimetry have been investigated previously [Citation12,Citation17]. Close to zero gamma fail-rates with tracking and very high fail-rates with motion but without tracking were observed in these studies. This is consistent with the measurements presented here if the gamma analysis of the tracked dosimeter and the dosimeter induced with motion are compared to the gamma analysis of the stationary dosimeter. This indicates that the quality of the 3D dosimetry system is at least comparable to ion-chamber-array measurements, with the added value of measurements in a full 3D volume with higher resolution. Similar conclusions have previously been obtained in a 2D comparison between gel dosimetry with an ion-chamber array during tracking with a respiratory-like target motion [Citation23]. In addition, the semi-3D dosimeter, Delta4® was compared to gel dosimetry in that study resulting in similar pass-rates at 3%/3 mm analysis; however, differences were observed when lowering the gamma pass criteria.
Conclusions
This study has shown that the OCTOPUS IQ optical CT system together with either nPAG or BANG gel dosimeters can with high resolution reproduce dose distributions, both with high gradients and with high complexity. Small changes in the delivered dose distribution due to movements were also clearly resolved. This indicates that the current 3D dosimetry system with polymerizing gel dosimeters and optical CT is a powerful tool for dosimetric verification of upcoming complex RT delivery methods.
Supplementary Appendix 1
Download PDF (1.2 MB)Acknowledgement
Supported by Varian Medical System and CIRRO – The Lundbeck Foundation Center for Interventional Research in Radiation Oncology and The Danish Council for Strategic Research. We gratefully thank Tomas Gustafsson, Roman Iustin, and Andreas Bergqvist (Micropos Medical AB) for modifications of the RayPilot system to allow integration with the tracking program. Thomas Schack Kinnari, Isak Wahlstedt and Jakob Fester (Aarhus University) as well as Henrik Svensson and Sofie Ceberg (Skåne University Hospital/Lund University) are acknowledged for their contribution to manufacturing of gel dosimeters.
Declaration of interest: The authors report no conflicts of interest. The authors alone are responsible for the content and writing of the paper.
References
- Bentzen SM. Theragnostic imaging for radiation oncology: Dose-painting by numbers. Lancet Oncol 2005;6:112–7.
- Tanderup K, Olsen DR, Grau C. Dose painting: Art or science. Radiother Oncol 2006;79:245–8.
- Aerts HJWL, Lambin P, De Ruysscher D. FDG for dose painting: A rational choice. Radiother Oncol 2010;97: 163–4.
- Korreman SS, Ulrich S, Bowen S, Deveau M, Bentzen SM, Jeraj R. Feasibility of dose painting using volumetric modulated arc optimization and delivery. Acta Oncol 2010;49:964–71.
- Madani I, Duprez F, Botenberg T, Van de Wiele C, Bonte K, Deron P, et al. Maximum tolerated dose in a phase I trial on adaptive dose painting by numbers for head and neck cancer. Radiother Oncol 2011;101:351–5.
- Meijer G, Steenhuijsen J, Bal M, De Jaeger K, Schuring D, Theuws J. Dose painting by contours versus dose painting by numbers for stage II/III lung cancer: Practical implications of using a broad or sharp brush. Radiother Oncol 2011;100:396–401.
- Horsman MR, Mortensen LS, Petersen JBB, Busk M, Overgaard J. Hypoxia imaging for improving radiotherapy outcome. Nat Rev Clin Oncol 2012;9:674–87.
- Toma-Dasu I, Uhrdin J, Antonovic L, Dasu A, Nuyts S, Dirix P, et al. Dose prescription and treatment planning based on FMISO-PET hypoxia. Acta Oncol 2012;51: 222–30.
- Kindbolm J, Ekelund-Olvenmark A-M, Syren H, Iustin R, Braide K, Frank-Lissbrant I, et al. High precision transponder localization using a novel electromagnetic positioning system in patients with localized prostate cancer. Radiother Oncol 2009;90:307–11.
- Falk M, af Rosenshöld PM, Keall P, Cattel H, Cho BC, Poulsen P, et al. Real-time dynamic MLC tracking for inversely optimized arc radiotherapy. Radiother Oncol 2010;94:218–23.
- Depuydt T, Verellen D, Haas O, Gevaert T, Linthout N, Duchateau M, et al. Geometric accuracy of a novel gimbals based radiation therapy tumor tracking system. Radiother Oncol 2011;98:365–72.
- Keall PJ, Sawant A, Cho B, Ruan D, Wu J, Poulsen P, et al. Electromagnetic-guided dynamic multileaf collimator tracking enables motion management for intensity-modulated arc therapy. Int J Radiat Oncol Biol Phys 2011;79:312–20.
- Fledelius W, Keall PJ, Cho B, Yang X, Morf D, Scheib S, et al. Tracking latency in image-based dynamic MLC tracking with direct image access. Acta Oncol 2011;50:952–9.
- Mohn S, Wasbø E. Simulation of respiratory motion during IMRT dose delivery. Acta Oncol 2011;50:935–43.
- Ravkilde T, Keall PJ, Højbjerre K, Fledelius W, Worm E, Poulsen PR. Geometric accuracy of dynamic MLC tracking with an implantable wired electromagnetic transponder. Acta Oncol 2011;50:944–51.
- Gendrin C, Furtado H, Weber C, Bloch C, Figl M, Pawiro SA, et al. Monitoring tumor motion by real time 2D/3D registration during radiotherapy. Radiother Oncol 2012;102:274–80.
- Poulsen PR, Fledelius W, Cho B, Keall P. Image-based dynamic multileaf collimator tracking of moving targets during intensity-modulated arc therapy. Int J Radiat Oncol Biol Phys 2012;83:265–71.
- Doran SJ. The history and principles of chemical dosimetry for 3-D radiation fields: Gels, polymers and plastics. Appl Radiat Isot 2009;67:393–8.
- Baldock C, De Deene Y, Doran S, Ibbott G, Jirasek A, Lepage M, et al. Polymer gel dosimetry. Phys Med Biol 2010;55:R1–63.
- Yates ES, Balling P, Petersen JBB, Christensen MN, Skyt PS, Bassler N, et al. Characterization of the optical properties and stability of Presage™ following irradiation with photons and carbon ions. Acta Oncol 2011;50: 829–34.
- Ceberg S, Karlsson A, Gustavsson H, Wittgren L, Bäck SÅJ. Verification of dynamic radiotherapy: The potential of 3D dosimetry under respiratory-like motion using polymer gel. Phys Med Biol 2008;53:N387–96.
- Brady SL, Brown WE, Clift CG, Yoo S, Oldham M. Investigation into the feasibility of using PRESAGE™/Optical-CT dosimetry for verification of gating treatments. Phys Med Biol 2010;55:2187–201.
- Ceberg S, Falk M, af Rosenschöld PM, Cattell H, Gustafsson H, Keall P, et al. Tumor-tracking radiotherapy of moving targets; verification using 3D polymer gel, 2D ion-chamber array and biplanar diode array. J Phys Conf Ser 2010; 250:012051.
- Xu Y, Wuu C-S, Maryanski MJ. Performance of a commercial optical CT scanner and polymer gel dosimeters for 3-D dose verification. Med Phys 2004;31:3024–33.
- Lopatiuk-Tirpak O, Langen KM, Meeks SL, Kupelian PA, Zeidan OA, Maryanski MJ. Performance evaluation of an improved optical computed tomography polymer gel dosimeter system for 3D dose verification of static and dynamic phantom deliveries. Med Phys 2008;35:3847–59.
- Wuu CS, Xu Y. Three-dimensional dose verification for intensity modulated radiation therapy using optical CT based polymer gel dosimetry. Med Phys 2006;33:1412–9.
- Mortensen LS, Johansen J, Kallehauge J, Primdahl H, Busk M, Lassen P, et al. FAZA PET/CT hypoxia imaging in patients with squamous cell carcinoma of the head and neck treated with radiotherapy: Results from the DAHANCA 24 trial. Radiother Oncol 2012;105:14–20.
- Svensson S, Skyt PS, Ceberg S, Doran S, Muren LP, Balling P, et al. Feasibility study using MRI and two optical CT scanners for readout of polymer gel and Presage™. J Phys Conf Ser 2013;444:012079.
- Low DA, Harms WB, Mutic S, Purdy JA. A technique for the quantitative evaluation of dose distributions. Med Phys 1998;25:656–61.
- Gustavsson H, Karlsson A, Bäck SA, Olsson LE, Haraldsson P, Engström P, et al. MAGIC-type polymer gel for three-dimensional dosimetry: Intensity-modulated radiation therapy verification. Med Phys 2003;30:1264–71.