Abstract
Background and purpose. Deformable image registration (DIR) is a key component of image-guided and adaptive strategies in radiotherapy. DIR based on image intensities alone is promising for online applications, but is challenged in regions with low intensity gradients. In this study we have investigated the performance of intensity- based DIR applied to contour propagation of the rectum and bladder, focusing on the consequences in terms of dose/volume parameters. Material and methods. The rectum and bladder volumes were delineated in the planning computed tomography (pCT) scan and in 8–9 repeat CTs (Vmanual) for nine prostate cancer patients. The volumes from the pCT were propagated onto the repeat CTs using intensity-based DIR (Vprop). Dose/volume parameters for Vmanual and Vprop were derived by dose re-calculations following rigid registration on prostate fiducials. Linear regression was used to identify qualitative and quantitative volumetric measures of the DIR performance being associated with the differences in dose/volume parameters. Results. The median differences in dose/volume parameters assessed for Vprop and Vmanual were modest, but individual differences ˜ 7 Gy were seen. The observed differences in dose/volume parameters showed strong correlations to the measures of the DIR performance as well as with the volume variations, most pronounced for the rectum (R2 = 0.63–0.85; p ≤ 0.05). Conclusion. Limitations in the intensity-based DIR algorithm resulted in large individual differences in dose/volume parameters between propagated and manually segmented volumes, which were correlated with volumetric measures of the DIR performance.
Deformable image registration (DIR) is a core component of image-guided and adaptive strategies in radiotherapy (RT) [Citation1,Citation2]. DIR algorithms based on image-intensities alone have considerable potential in particular for rapid online adaptive RT (ART) strategies but are challenged in regions with less sharp image intensity gradients [Citation3–7].
Online ART is being pursued also for tumour sites in the pelvic region, including both re-planning and plan selection strategies [Citation8–10]. The rectum and the bladder are key volumes of interest for these tumour sites, being the dose-limiting organs at risk, e.g. in RT of prostate cancer [Citation8,Citation10–13]. For hollow organs such as the rectum and the bladder the surface is a reasonable approximation of the organ [Citation3,Citation14]. DIR-based propagation of rectum and bladder contours therefore provides a method to assess the accuracy of the DIR [Citation4,Citation5]. Assessment of the accuracy of intensity-based DIR algorithms has usually involved either qualitative or quantitative measures of the contours propagated with DIR, to evaluate the geometric agreement between these contours vs the anatomy and/or manually delineated contours. In two previous investigations we found the performance of an intensity-based DIR algorithm, when applied to propagation of pelvic contours between treatment planning computed tomography (pCT) scans and either repeat CT or cone beam CT (CBCT) scans, to be less successful when large deformations were observed between pairs of registered images [Citation6,Citation7]. However, in order to thoroughly judge the performance of the DIR in terms of the clinical implications, also dose/volume parameters should be included in the evaluation.
In this study we have therefore investigated the precision of intensity-based DIR as applied to propagation of rectum and bladder contours in prostate RT, by assessing dose/volume-based measures and how these are related to qualitative and quantitative geometric measures of the DIR quality.
Material and methods
Image acquisition and deformable image registration (DIR)
This study included CT imaging data (one pCT and 8–9 repeat CT scans/patient acquired during the course of RT) from nine patients previously treated with intensity-modulated RT for prostate cancer at Haukeland University Hospital in Bergen, Norway between 2007 and 2008. The images were acquired in supine position from L4 to the pelvis (slice thickness: 2–3 mm, resolution: 512 × 512 pixels, in-slice resolution: 0.88 × 0.88 pixels) [Citation15]. For the purpose of this study a radiation oncologist delineated the rectum and bladder volumes in the pCT (VpCT) and all repeat CT scans (Vmanual) (78 repeat CT scans in total). Each of the repeat scans was registered to the pCT for the corresponding patient using intensity-based DIR following rigid bony anatomy-based registration (translations and rotations, 200–3000 Hounsfield Units window in SmartAdapt v.10.0, Varian Medical Systems, Palo Alto, Inc., CA, USA). Finally the DIR-based rectum and bladder contours were propagated onto the repeat CT scans (Vprop). The DIR algorithm used in these operations was a modified ‘demons’ algorithm constrained by the intensity differences in the specified field-of-view [Citation16,Citation17]; a more detailed description of this DIR algorithm can be found in two previous studies from our group [Citation6,Citation7].
Dose/volume-based evaluations
In order to perform dose/volume-based investigations of the DIR performance, each patient was simulated to be treated according to our current RT protocol for localised prostate cancer, 78 Gy delivered in 39 fractions using volumetric modulated arc therapy (RapidArc, Eclipse v.10.0, Varian Medical Systems). All plans were generated using 15 MV photons and 120-leaf multi-leaf collimators and all dose calculations were performed with the analytic anisotropic algorithm. The pCT was rigidly registered (translations only) to each of the repeat scans by means of intra-prostatic fiducial markers (2–3 fiducials/patient) followed by a new dose calculation maintaining the number of monitor units, according to our clinical image-guidance procedures [Citation18–20]. Based on these dose distributions several dose/ volume parameters were assessed for both Vmanual and Vprop: the mean dose (Dmean), the relative volume receiving more than 70 Gy (V70Gy) as well as the generalised equivalent uniform dose (gEUD) [Citation21] using k = 11 [Citation22] for the rectum and k = 8 [Citation23,Citation24] for the bladder as values for the volume-dependence parameter (k). For each studied dose/volume parameter, the parameters were averaged over the number of scans available for each patient. These treatment course averaged parameters were compared pair-wise between Vprop and Vmanual using a Wilcoxon signed-rank test with the hypothesis of no difference in the median value for corresponding parameters.
Dose/volume-based measures relative to volumetric measures
In order to relate the dose/volume parameters with previously applied evaluation methods, qualitative and quantitative measures were calculated. The qualitative measure was a clinical judgment of the Vprop volumes and was based on a slice-by-slice-scoring (of a radiation oncologist specialised in prostate cancer) assessing the number of slices with unacceptable deviations (shape and/or distance) relative to the anatomy [Citation6,Citation7]. The number of slices where unacceptable deviations were identified was finally scaled to the total cranio-caudal extension of each organ. The quantitative measures included a contour similarity measure, the Dice's similarity coefficient (DSC) [Citation25]:
The DSC ranges from zero to one and a higher value indicates a larger volume overlap between Vprop and Vmanual. In addition the quantitative measures included the actual volume variation, i.e. the relative volume deviation between Vmanual and VpCT (Vmanual/VpCT) as well as the corresponding deviation between Vprop and Vmanual (Vprop/Vmanual), the DIR quality related volume variations (these deviations were calculated as |Vmanual-VpCT|/VpCT and |Vprop-Vmanual|/Vmanual). Similarly to the assessment of the dose/volume parameters the qualitative and quantitative measures were averaged over the available scans for each patient, resulting in nine values for each investigated measure. The statistical test applied was a paired Wilcoxon signed-rank test with the hypothesis of no difference in the median values of these volumes/ratios.
The relationship between the dose/volume parameters and the qualitative and quantitative measures was explored using univariate linear regression analyses (UVA). Within these analyses the absolute differences in the previously described dose/volume parameters calculated between Vprop and Vmanual were used (Dmeandiff, V70Gydiff and gEUDdiff). In addition, one further dose/volume parameter was introduced: the absolute difference in relative volume calculated for each dose level (1 Gy sampling) between these volumes, averaged across the DVH (DVHdiff).
The statistical analyses were performed in MATLAB (MATLAB R2010, MathWorks Inc., MA, USA) and in STATA (STATA v.11, Stata-Corp LP, College Station, TX, USA). The p-value and when appropriate, the correlation coefficient (R2), are given for the suitable statistical test. A p-value below 0.05 was considered statistically significant.
Results
The propagated volumes (Vprop) tended to be larger than the manually outlined volumes (Vmanual), although the differences were not statistically significant (). The average DSC calculated between Vprop and Vmanual ranged from 0.72 to 0.85 for the rectum, and from 0.80 to 0.94 for the bladder (). Within the qualitative evaluations the average fraction of slices, relative to the number of slices of the total cranio-caudal organ extension, where the rectal Vprop deviated from the anatomy ranged from 0.02 to 0.43 while the corresponding average fraction for the bladder ranged from 0.04 to 0.43.
Table I. The Vmanual and the Vprop volumes [population median (range)]. The p-value refers to a Wilcoxon signed-rank test.
Table II. Patient averages (range), given for one of the quantitative measures (DSC) and the qualitative measure.
The dose/volume parameters calculated for Vmanual were overall slightly higher (population median: 0.2–0.7 Gy) compared to the corresponding parameters calculated for Vprop (); however, the differences were far from statistically significant. However, large individual variations were observed for all of the three dose/volume parameters, most pronounced for Dmean of the bladder (population range for the difference: −4.6, 6.3 Gy). The median (range) DVHdiff was 2.2(1.2–5.5)% for the rectum and 2.3(0.6–7.6)% for the bladder.
Table III. The investigated dose/volume-based measures [population median (range)] assessed for the Vmanual and the Vprop volumes.
On UVA significant correlations (p ≤ 0.05) with the dose/volume measures were found for all measures for the rectum and was most pronounced with DVHdiff (R2 = 0.70–0.85 for the four quantitative and qualitative measures; ). All four dose/volume measures were significantly correlated with the DSC (R2 = 0.45–0.79). For the bladder the strongest significant correlations with the dose/ volume measures were seen with |Vprop-Vmanual|/Vmanual (R2 = 0.62–0.83) and the qualitative measure (R2 = 0.46–0.74) and was most pronounced for gEUDdiff and DVHdiff (; ). The association between the DIR quality and the resulting DVHs are exemplified in .
Figure 1. The linear correlation between two of the dose/volume-based measures (Rectum: DVHdiff; Bladder: gEUDdiff) and the volume variations related to the DIR quality (|Vprop-Vmanual|/Vmanual) or the actual volume variation (|Vmanual-VpCT|/VpCT) for the rectum (left) and the bladder (right).
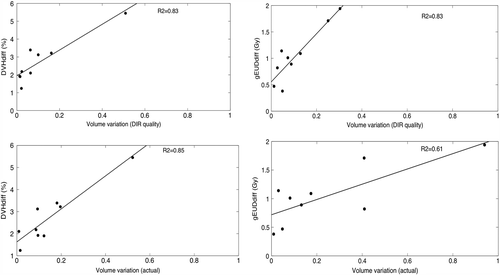
Figure 2. An illustration of the association between the quality of the DIR and the resulting differences in the DVH for the bladder. Referring to the upper right plot in , the two patients shown here are the patients with the largest (left), respectively the smallest (right) DIR quality related volume variations (|Vprop-Vmanual|/Vmanual = 0.30 and 0.01, respectively) and gEUDdiff (gEUDdiff = 1.94 and 0.47). For both patients, the scan shown is the scan with values of the DIR quality related volume variations closest to the median.
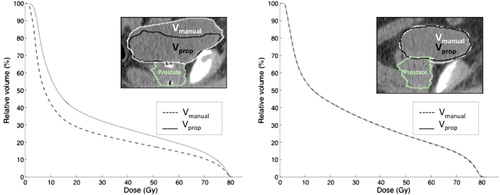
Table IV. Linear correlations (R2) between the dose/volume-based measures and the quantitative and qualitative measures. *p ≤ 0.05.
Discussion
In this study we have investigated the performance of intensity-based DIR as applied to contour propagation for the rectum and the bladder in the setting of prostate RT, focusing mainly on dose/volume endpoints and their correlations with qualitative and quantitative volumetric measures. For the investigated dose/volume parameters we observed a tendency that the doses received by the manually delineated volumes (Vmanual) were higher than the corresponding doses to the volumes propagated using DIR (Vprop). Further a trend of the Vmanual volumes being smaller than the Vprop volumes was observed. Much of the variation in the dose/volume measures was related to the volumetric measures describing the volume difference between Vprop and Vmanual.
Relatively modest differences in the median values for corresponding dose/volume parameters were found between Vprop and Vmanual, and these were not significantly different. We certainly acknowledge the limited number of patients included in the study, however, these findings were confirmed when repeating the analyses on a per scan level (assuming that the 78 CT scans could be considered as independent patients) where we similarly obtained small differences in the compared volumetric and dose/volume-based measures across the population. However, large individual variations were observed which were explored in the subsequent linear regression analyses. We observed significant (p ≤ 0.05) linear correlations between the majority of the dose/volume-based measures and the qualitative and quantitative volumetric measures. Strong correlations were observed with the volumetric measures describing the volume difference between the propagated and the manually delineated contours (Rectum: DSC and |Vprop-Vmanual|/Vmanual; Bladder: |Vprop-Vmanual|/Vmanual) and for the rectum the strongest correlations were also observed with the actual volume variation. The rectal gEUD and V70Gy were not significantly correlated with the measure describing the DIR quality related volume variations or with the actual volume variations. For the applied gEUD volume dependence parameters (Rectum: k = 11; Bladder: k = 8) the high-dose region was weighted stronger than intermediate doses [Citation21]. For the bladder significant correlations were less pronounced with Dmean. Among all investigated dose/volume parameters the largest individual differences were seen for this measure, which probably influenced on the subsequent correlation studies.
Comparing the correlations with the dose/volume-based measures between the assessed quantitative measures; equally strong correlations were observed using the volumetric difference between the propagated and the manually delineated volumes or the actual volume difference (relative to the pCT) for the rectum. Due to the low number of patients, a multi-variate analysis could not be performed. For the bladder the strongest correlations were found using the volumetric difference between the propagated and the manually delineated volumes. Larger actual volume variations were obtained for the bladder (range 0.59–1.94) compared to the rectum (range 0.48–1.18). A likely explanation of the considerable volume changes is that no preparation protocol was used for any of the included patients [Citation26,Citation27]. To some extent this limits our study at least in establishing any volume time trends. Still, the effectiveness of such protocols has been questioned [Citation11,Citation20]. Our work nevertheless showed that the investigated DIR algorithm was unable to track substantial (both smaller and larger) volume variations relative to the VpCT. This was most pronounced for the bladder with the Vmanual/VpCT being up to 44% larger than Vprop/VpCT. For intensity- based DIR algorithms this is a frequently recognised drawback, which is commonly explained by lack of image intensities to track organ volume elements [Citation3,Citation4,Citation6,Citation7,Citation14].
Previous performance evaluation of DIR as applied to contour propagation has usually involved volumetric measures evaluating the agreement with manually delineated contours using similarity measures and/or landmarks [Citation3,Citation6,Citation7,Citation14]. Some investigations have complemented such evaluations with a qualitative clinical judgement of the agreement between propagated contours and the anatomy [Citation3,Citation6,Citation7]. In both of our previous studies a trend in association between the DSC and the clinical scoring was observed for both the rectum [Citation6] and the bladder [Citation6,Citation7], with a high DSC value corresponding to a larger agreement with the anatomy compared to a low DSC value. In the current study significant correlations were found between these two measures and the majority of the applied dose/volume parameters for the rectum. For both the rectum and the bladder the strongest correlations with the dose/volume parameters were however obtained using the actual volume difference (rectum), the measure, different from the DSC, that described the volume difference between the manually delineated and the propagated volumes or with the qualitative measure (for both rectum and bladder).
In conclusion we have documented limitations in the intensity-based DIR algorithm that resulted in relatively large individual differences in dose/volume parameters between propagated and manually segmented volumes. These differences were significantly correlated with qualitative and quantitative measures of the DIR performance such as the volumetric difference between the manually delineated and the propagated volumes, with the strongest associations observed for the rectum.
Acknowledgements
This study has been supported by research grants from CIRRO-The Lundbeck Foundation Center for Interventional Research in Radiation Oncology, the Danish Cancer Society, FSS (The Danish Council for Independent Research) as well as the Danish Council for Strategic Research. The authors report no conflicts of interest. The authors alone are responsible for the content and writing of the paper.
References
- Yan D, Jaffray DA, Wong JW. A model to accumulate fractionated dose in a deforming organ. Int J Radiat Oncol Biol Phys 1999;44:665–75.
- Jaffray DA, Lindsay PE, Brock KK, Deasy JO, Tomé WA. Accurate accumulation of dose for improved understanding of radiation effects in normal tissue. Int J Radiat Oncol Biol Phys 2010;76(3 Suppl):135–9.
- Godley A, Ahunbay E, Peng C, Li XA. Automated registration of large deformations for adaptive radiation therapy of prostate cancer. Med Phys 2009;36:1433–41.
- Gao S, Zhang L, Wnag H, de Crevoisier R, Kuban DD, Mohan R, et al. A deformable image registration method to handle distended rectums in prostate cancer radiotherapy. Med Phys 2006;33:3304–12.
- Chao M, Xie Y, Xing L. Auto-propagation of contours for adaptive prostate radiation therapy. Phys Med Biol 2008; 53:4533–42.
- Thörnqvist S, Petersen JBB, Høyer M, Bentzen LN, Muren LP. Propagation of target and organ at risk contours in radiotherapy of prostate cancer using deformable image registration. Acta Oncol 2010;49:1023–32.
- Thor M, Petersen JB, Bentzen L, Høyer M, Muren LP. Deformable image registration for contour propagation from CT to cone-beam CT scans in radiotherapy of prostate cancer. Acta Oncol 2011;50:918–25.
- Crehange G, Miriolet C, Gauthier M, Martin E, Truc G, Peignaux-Casanovas K, et al. Clinical impact of margin reduction on late toxicity and short-term biochemical control for patients treated with daily on-line image guided IMRT for prostate cancer. Radiother Oncol 2012;103: 244–6.
- Maggiulli E, Fiorino C, Passoni P, Broggi S, Gianolini S, Salvetti C, et al. Characterisation of rectal motion during neo-adjuvant radiocheomtherapy for rectal cancer with image-guided tomotherapy: Implications for adaptive dose escalation strategies. Acta Oncol 2012;51:318–24.
- Nakamura N, Shikama N, Takahashi O, Sekiguchi K, Hama Y, Akahane K, et al. The relationship between the bladder volume and optimal treatment planning in definitive radiotherapy for localized prostate cancer. Acta Oncol 2012; 51:730–4.
- McNair HA, Wedlake L, McVey GP, Thomas K, Andrejev J, Dearnaley DP. Can diet combined with treatment scheduling achieve consistency of rectal filling in patients receiving radiotherapy to the prostate?Radiother Oncol 2011;101: 471–8.
- Hysing LB, Söhn M, Muren LP, Alber M. A coverage probability based method to estimate patient-specific small bowel planning volumes for use in radiotherapy. Radiother Oncol 2011;100:407–11.
- Anderson NS, Yu JB, Peschel RE, Decker RH. A significant decrease in rectal volume and diameter during prostate IMRT. Radiother Oncol 2011;98:197–91.
- Xie Y, Chao M, Lee P, Xing L. Feature-based rectal contour propagation from planning CT to cone beam CT. Med Phys 2008;35:4450–9.
- Muren LP, Wasbø E, Helle SI, Hysing LB, Karlsdottir A, Odland OH, et al. Intensity-modulated radiotherapy of pelvic lymph nodes in locally advanced prostate cancer: Planning procedures and early experiences. Int J Radiat Oncol Biol Phys 2008;71:1034–41.
- Thirion JP. Image matching as a diffusion process: An analogy with Maxwell's demons. Med Image Anal 1998;2:243–60.
- Wang H, Dong L, O’Daniel J, Mohan R, Garden AS, Ang KK, et al. Validation of an accelerated ‘demons’ algorithm for deformable image registration in radiation therapy. Phys Med Biol 2005;50:2887–905.
- Thörnqvist S, Bentzen L, Petersen JBB, Hysing LB, Muren LP. Plan robustness of simultaneous integrated boost radiotherapy of prostate and lymph nodes for different image-guidance and delivery techniques. Acta Oncol 2011; 50:926–34.
- Andersen ES, Muren LP, Sørensen TS, Noe KO, Thor M, Petersen JB, et al. Bladder dose accumulation based on a biomechanical deformable image registration algorithm in volumetric modulated arc therapy for prostate cancer. Phys Med Biol 2012;57:7089–100.
- Thor M, Andersen ES, Petersen JBB, Sørensen TS, Noe KØ, Tanderup K, et al. Evaluation of the dynamic adaptive radiation therapy software (DART) – an application for intensity-based deformable image registration and dose accumulation. Phys Med Biol (in revision)
- Niemierko A. A generalized concept of equivalent uniform dose (abstract). Med Phys 1999;26:1100.
- Michalski JM, Gay H, Jackson A, Tucker SL, Deasy JO. Radiation dose-volume effects in radiation-induced rectal injury. Int J Radiat Oncol Biol Phys 2010;76(3 Suppl): S123–9.
- Hysing LB, Skorpen TB, Alber M, Fjellsbø LB, Helle SI, Muren LP. Influence of organ motion on conformal vs. intensity-modulated pelvic radiotherapy for prostate cancer. Int J Radiat Oncol Biol Phys 2008;71:1496–503.
- Soukup M, Söhn M, Yan D, Liang J, Alber M. Study of robustness of IMPT and IMRT for prostate cancer against organ movement. Int J Radiat Oncol Biol Phys 2009; 75:941–9.
- Dice LR. Measures of the amount of ecologic association between species. Ecology 1945;297–302.
- Hatton JA, Greer PB, Tang C, Wright P, Capp A, Gupta S, et al. Does the planning dose-volume histogram represent treatment doses in image-guided prostate radiation therapy?Assessment with cone-beam computerised tomography scans. Radiother Oncol 2011;98:162–8.
- Maggio A, Fiorino C, Mangili P, Cozzarini C, de Cobelli F, Cattaneo GM, et al. Feasability of safe ultra-high (EQD(2)> 100 Gy) dose escalation on dominant intra-prostatic lesions (DILs) by Helical Tomotherapy. Acta Oncol 2011;50:25–34.