Abstract
Background. Estimation of computed tomography (CT) equivalent data, i.e. a substitute CT (s-CT), from magnetic resonance (MR) images is a prerequisite both for attenuation correction of positron emission tomography (PET) data acquired with a PET/MR scanner and for dose calculations in an MR-only radiotherapy workflow. It has previously been shown that it is possible to estimate Hounsfield numbers based on MR image intensities, using ultra short echo-time imaging and Gaussian mixture regression (GMR). In the present pilot study we investigate the possibility to also include spatial information in the GMR, with the aim to improve the quality of the s-CT. Material and methods. MR and CT data for nine patients were used in the present study. For each patient, GMR models were created from the other eight patients, including either both UTE image intensities and spatial information on a voxel by voxel level, or only UTE image intensities. The models were used to create s-CT images for each respective patient. Results. The inclusion of spatial information in the GMR model improved the accuracy of the estimated s-CT. The improvement was most pronounced in smaller, complicated anatomical regions as the inner ear and post-nasal cavities. Conclusions. This pilot study shows that inclusion of spatial information in GMR models to convert MR data to CT equivalent images is feasible. The accuracy of the s-CT is improved and the spatial information could make it possible to create a general model for the conversion applicable to the whole body.
Attenuation correction of positron emission tomography (PET) images in a PET/magnetic resonance (MR) scanner as well as an MR-only radiotherapy workflow requires estimation of the electron density based on MR images [Citation1,Citation2]. Different methods to accomplish this task have been described in the literature [Citation3]. One option is to use a registration approach where a representative CT is warped through deformable registration to fit the acquired MR data [Citation2,Citation4,Citation5]. Another approach is to segment the MR images and use bulk density assignments for the different classes [Citation6–11]. A third approach is to use a model directly associating the intensity in the MR images with the Hounsfield units of a computer tomography (CT) examination [Citation12–14]. In a previous publication we described a method to derive a substitute CT (s-CT) based on ultra-short echo-time (UTE) and gradient echo sequences [Citation12]. An evaluation of the method for attenuation correction of PET images in the head region has shown promising results but also highlighted areas where the method can be improved [Citation15], especially for the CT number estimation in the ear and nasal cavities. The s-CT method is based on Gaussian mixture regression (GMR) [Citation16] associating MR data and CT data for a training set of patients on a voxel level. In the publications [Citation12,Citation15,Citation17] we used only MR intensity data as input to the model. The Gaussian mixture regression method does, however, allow an arbitrary number of explanatory variables.
MR image intensity values are one class of variables that can be included in the model. These variables are spatially invariant which may allow the model to be transferred to other anatomical regions. Other variables, such as the location of a specific voxel, or the electron density in an atlas CT image registered to the acquired MR image are not spatially invariant but may contribute additional information to improve the prediction of the electron density. In particular spatial coordinates would allow the model to discriminate between tissues at different locations but with similar apparent MR properties such as air-soft tissue-bone interfaces in the ear and nasal cavities versus the surface of the patient or soft tissue-bone interfaces at the skull. While these tissues could in principle be distinguish based on T2* and T1 behaviour measured with dual echo and dual flip angle UTE techniques, their similar appearance and low SNR complicates the task considerably. Thus, including spatial information provides a more clinically feasible solution.
The use of spatial information has recently been investigated in combination with discriminant analysis for generation of water equivalent path length (WEPL) maps for ion therapy dose calculations [Citation18]. Earlier, combinations of atlas registration and local pattern recognition [Citation19] or segmentation and relative tissue position [Citation10,Citation11] have been used to take advantage of both voxel position and intensity to generate attenuation maps for PET.
Motivated by these findings, this pilot study investigates the potential of incorporating spatial information into the CT substitute GMR model. The possible benefits include improved estimation of the electron density in each voxel as well as a framework to seamlessly combine CT substitute GMR models developed for different anatomical sites.
Material and methods
GMR model with spatial information
In addition to the intensity-based variables included in our previous publications [Citation12,Citation17], four variables are introduced in the present work, namely the x, y and z coordinates with respect to the mean value of all voxel coordinates inside the head, and the shortest distance from each voxel to the external contour of the patient.
Due to the inclusion of spatial information into the Gaussian mixture model (GMM), tissues with the same image intensities will not necessarily belong to the same Gaussian component in the mixture. Rather, each component will represent a particular combination of tissue and location.
While the x, y, and z coordinates provides enough information to distinguish all spatial locations the distance to external contour reflects the roughly ellipsoidal geometry of the human head and its tissues (skin, skull, brain). Therefore the distance to contour should allow the GMR model to capture the crude spatial variations in tissue frequency while the Cartesian coordinates could help to reflect the smaller differences between medial and lateral, superior and inferior as well as anterior and posterior. A more detailed description of the algorithm can be found in the Supplementary Appendix (available online at http://www.informahealthcare.com/doi/abs/10.3109/0284186X.2013.819119).
Imaging
The project was approved by the local ethical committee. Imaging data from nine patients, treated with radiotherapy for intra-cranial lesions were used, including four UTE images acquired with a Siemens Espree 1.5 T scanner, using two different echo-times (0.07 ms and 3.76 ms) and two different nominal flip-angles (10° and 30°). The voxel size of the MR images was 1.33 mm × 1.33 mm × 1.33 mm. For each patient a treatment planning CT was available with a voxel size of 0.78 mm × 0.78 mm × 2.5 mm.
Preprocessing
The MR and CT datasets were registered using rigid mutual information registration and the CT was resampled to the same resolution as the MR images. For each patient an external contour mask was generated. Each MR image was further filtered with local mean and local standard deviation filters to generate two additional images, in the same fashion as in previous works [Citation12]. The geometric centre for the external contour mask was used to derive the relative x, y and z coordinates inside the head as well as the distance to surface variable.
Cross-validation of GMR
For each patient, the CT and MR data from all other patients where used to estimate the parameters in the GMM. The CT number in each voxel was then predicted using the acquired MR images, their filtered versions and the spatial variables in combination with the GMM. To reduce salt and pepper noise in the s-CT images a local median filter was applied for a 27-voxel neighbourhood around each voxel. This filter reduced the effective resolution of the CT substitute but does not introduce geometrical distortions into the CT substitute. The whole procedure was repeated for each patient in a leave-one-out cross-validation (LOOCV) procedure. The absolute deviations between corresponding voxels in the real CT and the estimated CT substitute were averaged for each patient. These averaged absolute deviations from all patients were average to form the total mean absolute prediction deviation (MAPD).
Results
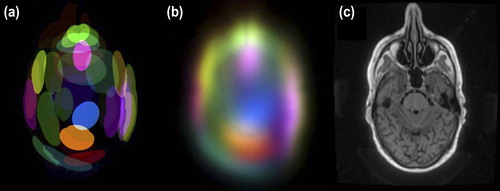
The spatial distribution of Gaussians is illustrated for a slice in . Several components are present in the vicinity of the nasal cavity to represent the different tissues there.
Figure 1. Spatial distribution of Gaussian components in the mixture. Each coloured shape represents a component. The sharp edges (a) indicate where the Mahalanobis distance from the centre of each component is one. The local densities of the different components are shown in (b) and the corresponding slice in (c).
The LOOCV MAPD for all patients was 130 HU with a standard deviation of 18 HU when spatial variables were included in the model and 140 HU with a standard deviation of 22 HU when they were not. The 95% confidence interval for the paired difference of the MAPD for the two models was [5.1 HU, 15.0 HU]. gives the MAPD as a function of the estimated CT number in the s-CT, and shows an improvement over the entire range of estimated CT numbers. The improvement is most pronounced in voxels that are estimated to have CT numbers around 400 HU and above, i.e. bone and bone-tissue interfaces.
Figure 2. Mean absolute prediction deviation in the CT substitute with respect to the Hounsfield number in the CT substitute.
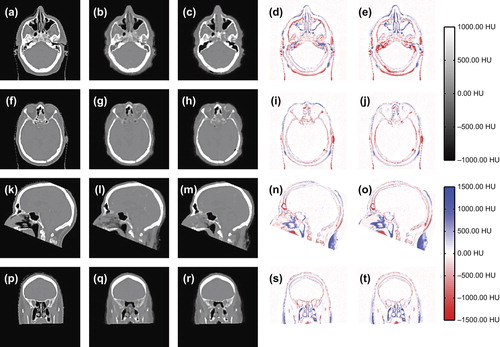
Differences in s-CTs from the two models are seen primarily at air-soft tissue interfaces as shown in .
Figure 3. CT images (a,f,k,p), CT substitutes derived from a model including spatial variables (b,g,l,q), CT substitutes derived from a model without spatial variables (c,h,m,r) and difference between CT substitute and CT for the model with (d,I,n,s) and without (e,j,o,t) spatial information.
Discussion
The quality of the s-CT was improved in smaller more complicated structures as the post-nasal cavities () and inner ear () when spatial information was included in the GMR model. This effect is also seen in as a slight improvement at a CT number of × 500 HU and a more pronounced improvement above 300 HU. No improvement was found for the larger anatomical volumes, such as the brain and the ventricles. The reason for the improvement is that the introduction of coordinates as explanatory variables disperses the Gaussians in the spatially, as shown in . Hence, the relation between the MR intensity and the CT number is allowed to vary with location.
When no spatial information is included in the model, the MR image intensities in a small neighbourhood of voxels surrounding each voxel determines the CT number in the s-CT for the same voxel. This was the case for the GMR model in the original work [Citation12,Citation17] that only used dual echo UTE and T2-weighted spin-echo image intensities to estimate the CT number in the s-CT. The resulting s-CT was found to be equivalent to a segmented CT in terms of CT number accuracy and precision for soft tissues and bone but to have a comparatively worse precision for air-soft tissue and bone-soft tissue interfaces. Consequently, a downside to this approach is that less frequent voxel types, such as the mix of bone and air in the ear cavities or the thin air pockets in the nasal cavities will be systematically assigned erroneous CT numbers due to the similarity in MR intensity to other more frequent voxel types such as the air-soft tissue interface at the surface of the patient and larger air pockets. This effect has been identified as a potential problem for attenuation correction in PET applications [Citation15]. The spatial variables included in the present work permits better discrimination of these problematic voxel types based on their location inside the patients head.
These findings are in agreement with earlier work by Hofmann et al. [Citation19] who showed that spatial information provided by atlas registration and local information provided by pattern recognition could be combined to produce attenuation correction maps for PET from MRI with good results in and around the nasal and ear cavities. It has also been shown [Citation10,Citation11] that segmentation based on intensity can be combined with prior information of relative tissue location to produce improved attenuation correction maps.
An important feature of the voxel-wise conversion from MR images to CT-equivalent s-CT images as presented previously without spatial variables [Citation12,Citation17] is the preservation of the geometrical integrity, i.e. there is no need for either rigid or deformable registration for the individual patient. The introduction of the spatial coordinates as explanatory variables do not compromise this important feature of the method, even though the coordinates are used on equal terms with the intensity-based variables in the GMR model. An interpretation is that coordinates are used to determine weighting factors for the Gaussians in a conditional intensity-only Gaussian mixture distribution for each individual voxel. The weighting factors are slowly varying in space (), and the resulting CT number in the estimated s-CT is therefore relatively insensitive to the exact location of the individual voxel.
The use of spatial coordinates as explanatory variables in the model may, besides the improvement in s-CT accuracy, also enable the use of a single GMR model covering the entire patient anatomy. The anatomy variability between patients in the head region is limited, which made it possible to apply the simplified coordinate definition used in the present work. However, the variability is much larger in other areas, such as thorax and pelvis. Therefore a generalisation of the method to derive a single GMR model for the entire anatomy could be based on an atlas solution. The purpose of the atlas would be to, for each individual voxel within the patient, provide a standardised atlas coordinate in analogy to the spatial information provided by an intensity-based atlas [Citation19] or a priori knowledge about relative tissue location [Citation10,Citation11]. For the same reasons as described above the use of an atlas solution to estimate standardised coordinates for each voxel for the individual patient, would not affect the spatial accuracy of the s-CT method.
The results from the present pilot study shows that it is possible to incorporate spatial information into a Gaussian mixture regression model used to estimate CT-equivalent images (s-CT) based on MR images. The spatial information increases the accuracy of the estimated s-CT without compromising the geometrical representation of the patient compared to when no spatial information is included. The introduced spatial adaptability of the GMR model suggests a possible framework for creating an s-CT model that could be applied bodywide.
Supplementary Appendix
Download PDF (1.5 MB)Declaration of interest: The authors report no conflicts of interest. The authors alone are responsible for the content and writing of the paper.
References
- Karlsson M, Karlsson M, Nyholm T, Amies C, Zackrisson B. Dedicated magnetic resonance imaging in the radiotherapy clinic. Int J Radiat Oncol Biol Phys 2009; 74:644–51.
- Hofmann M, Steinke F, Scheel V, Charpiat G, Farquhar J, Aschoff P, et al. MRI-based attenuation correction for PET/MRI: A novel approach combining pattern recognition and atlas registration. J Nucl Med 2008;49:1875–83.
- Bezrukov I, Mantlik F, Schmidt H, Schölkopf B, Pichler BJ. MR-Based PET attenuation correction for PET/MR imaging. Semin Nucl Med 2013;43:45–59.
- Dowling J, Lambert J, Parker J. An atlas-based electron density mapping method for magnetic resonance imaging (MRI)-alone treatment planning and adaptive MRI-based prostate radiation therapy. Int J Radiation Oncol Biol Phys 2012;83:e5–11.
- Kops ER, Herzog H. Template based attenuation correction for PET in MR-PET scanners. IEEE Nucl Sci Symp Conf Rec 2008. p. 3786–9.
- Jonsson J, Karlsson M, Karlsson M, Nyholm T. Treatment planning using MRI data: An analysis of the dose calculation accuracy for different treatment regions. Radiat Oncol 2010;5:1–8.
- Keereman V, Fierens Y. MRI-based attenuation correction for PET/MRI using ultrashort echo time sequences. J Nucl Med 2010;51:812–8.
- Catana C, Kouwe A Van Der. Toward implementing an MRI-based PET attenuation-correction method for neurologic studies on the MR-PET brain prototype. J Nucl Med 2010;51:1431–8.
- Berker Y, Franke J, Salomon A, Palmowski M, Donker HCW, Temur Y, et al. MRI-based attenuation correction for hybrid PET/MRI systems: A 4-class tissue segmentation technique using a combined ultrashort-echo-time/Dixon MRI sequence. J Nucl Med 2012;53:796–804.
- Kops ER, Wagenknecht G, Scheins J, Tellmann L, Herzog H. Attenuation correction in MR-PET scanners with segmented T1-weighted MR images. IEEE Nucl Sci Symp Conf Rec 2009. p. 2530–3.
- Wagenknecht G, Kops ER, Tellmann L, Herzog H. Knowledge-based segmentation of attenuation- relevant regions of the head in T1-weighted MR images for attenuation correction in MR/PET systems. IEEE Nucl Sci Symp Conf Rec 2009. p. 3338–43.
- Johansson A, Karlsson M, Nyholm T. CT substitute derived from MRI sequences with ultrashort echo time. Med Phys 2011;38:2708.
- Zaidi H, Montandon M, Slosman D. Magnetic resonance imaging-guided attenuation and scatter corrections in three-dimensional brain positron emission tomography. Med Phys 2003;30:937–48.
- Kapanen M, Tenhunen M. T1/T2*-weighted MRI provides clinically relevant pseudo-CT density data for the pelvic bones in MRI-only based radiotherapy treatment planning. Acta Oncol 2013;52:612–8.
- Larsson A, Johansson A, Axelsson J. Evaluation of an attenuation correction method for PET/MR imaging of the head based on substitute CT images. Magn Reson Mater Phy 2013;26:127–36.
- Sung HG. Gaussian mixture regression and classification. PhD thesis. Houston, Texas: Rice University; 2004.
- Johansson A, Karlsson M, Yu J, Asklund T, Nyholm T. Voxel-wise uncertainty in CT substitute derived from MRI. Med Phys 2012;39:3283–90.
- Rank CM, Tremmel C, Hünemohr N, Nagel AM, Jäkel O, Greilich S. MRI-based treatment plan simulation and adaptation for ion radiotherapy using a classification-based approach. Radiat Oncol 2013;8:51.
- Hofmann M, Steinke F, Scheel V, Charpiat G, Farquhar J, Aschoff P, et al. A novel approach combining pattern recognition and atlas registration. J Nucl Med 2008;49:1875–83.