Abstract
Background. The prostate gland is delineated as the clinical target volume (CTV) in treatment planning of prostate cancer. Therefore, an accurate delineation is a prerequisite for efficient treatment. Accurate automated prostate segmentation methods facilitate the delineation of the CTV without inter-observer variation. The purpose of this study is to present an automated three-dimensional (3D) segmentation of the prostate using an active appearance model. Material and methods. Axial T2-weighted magnetic resonance (MR) scans were used to build the active appearance model. The model was based on a principal component analysis of shape and texture features with a level-set representation of the prostate shape instead of the selection of landmarks in the traditional active appearance model. To achieve a better fit of the model to the target image, prior knowledge to predict how to correct the model and pose parameters was incorporated. The segmentation was performed as an iterative algorithm to minimize the squared difference between the target and the model image. Results. The model was trained using manual delineations from 30 patients and was validated using leave-one-out cross validation where the automated segmentations were compared with the manual reference delineations. The mean and median dice similarity coefficient was 0.84 and 0.86, respectively. Conclusion. This study demonstrated the feasibility for an automated prostate segmentation using an active appearance with results comparable to other studies.
Magnetic resonance (MR) is increasingly used for target delineation in treatment of prostate cancer using radiotherapy because of the superior soft-tissue visualization compared with computed tomography (CT). Studies by Hentschel et al. [Citation1] and Rasch et al. [Citation2] have investigated target delineation in CT and MR for treatment of prostate cancer. They found that using MR instead of CT can lead to a volume reduction of 35–40%, respectively, with a lower inter- and intra-observer variance [Citation1,Citation2]. The overestimation of the prostate volume can cause higher normal tissue toxicity and limit the radiation dose to the prostate.
The clinical practice for target delineation for planning radiotherapy of prostate cancer is today widely performed using a manual contouring of the prostate slice-by-slice using either the axial, coronal, sagittal view or a combination of the views. The manual work is a labor-intensive task and is prone to inter- and intra-observer variance. Therefore, several authors have described semi- or automated methods for prostate segmentation in MR. Some studies, e.g. [Citation3,Citation4] have used voxel-based segmentations yet while incorporating knowledge about the general prostate shape. However, most previous studies have focused on either atlas- or model-based methods. Atlas-based approaches in three dimensions (3D) have been studied [Citation5–7] while a model-based approach was presented by Pasquier et al. [Citation8] using a landmark-based shape model followed by a contour optimization to deform the model to the prostate. Statistical shape models were presented in [Citation9,Citation10]. Chandra et al. [Citation11] used a deformable model consisting of triangulated surface and image feature model trained specific to the patient's MR scan. Chowdhury et al. [Citation12] used linked statistical shape models using information from both MR and CT in a level-set shape representation.
A few methods use a combination of prostate shape and intensity information to model and segment the prostate. Ghose et al. [Citation13] used active appearance models (AAM) propagated by the approximation coefficients of Haar wavelet transform in 2D. Recently, Toth and Madabhushi [Citation14] used image-derived features in an AAM where the selection of landmarks were replaced with a level-set representation of the shape. The original AAM suggested by Cootes et al. [Citation15,Citation16] requires that landmarks at the border of the object are selected, which is prone to error and time-consuming. Therefore, recent work has focused on a re-formulation of the shape modeling in a level-set framework of multi-modality MR images of the lateral ventricles in the brain [Citation17] and segmentation of the vertebrae in CT [Citation18].
In this paper we propose a method that combines a level-set shape model and a texture model for prostate segmentation. The level-set representation eliminates the need for selecting corresponding landmarks in all MR scans. In addition prior knowledge learned in the training of the model is incorporated to adjust the model parameter and guide the 3D segmentation.
Material and methods
Materials
The data consisted of T2-weighted 1.5 Tesla MR scans (0.5469 × 0.5469 × 3 mm3) from 30 patients. The patients had all been diagnosed with local or locally advanced prostate cancer and referred to the Department of Oncology for radiotherapy and enrolled in a prior study investigating the feasibility using a Ni-Ti prostate stent described in [Citation19]. Each patient had a MR scan with a manual delineation of the prostate performed for the planning of the radiotherapy. The prostate size for the 30 patients calculated from the manual delineations was found to range from 17.42 cm3 to 92.94 cm3.
Active Appearance Model
The assumption behind AAM is that changes in the shape and the texture of a given object are correlated. The AAM presented here is a principal component analysis (PCA)-based statistical model where a shape and a texture model are combined. In this way, the statistical model describes both the object shape and the object texture with the same set of parameters. The elimination of the need to select landmarks on the prostate border was achieved using level-set in which the prostate shape was represented as a signed distance map. The methodology is derived from Hu and Collins [Citation17], Stephansen [Citation18], and Cootes and Taylor [Citation20]. For further details see the Supplementary Appendix (available online at http://informahealthcare.com/doi/abs/10.3109/0284186X.2013.822099). New images and shapes were synthesized using the AAM for the shape φ and the image intensities g by varying the appearance parameters c:
Where ![]() and ĝ are the mean shape and mean texture, respectively. Ps is the principal modes of shape variation, Ws is the weight matrix to account for difference in units between shape and texture. The shape and texture parameters were combined into the appearance parameters c. Pcs and Pcg represent the shape and texture part of the principal modes of appearance variation, respectively. The appearance parameters c values were constrained to the interval of ±3 standard deviations as in [Citation16].
and ĝ are the mean shape and mean texture, respectively. Ps is the principal modes of shape variation, Ws is the weight matrix to account for difference in units between shape and texture. The shape and texture parameters were combined into the appearance parameters c. Pcs and Pcg represent the shape and texture part of the principal modes of appearance variation, respectively. The appearance parameters c values were constrained to the interval of ±3 standard deviations as in [Citation16].
Appearance model-based segmentation
The aim of the segmentation is to find the model parameters of the AAM that generate a model image that closely corresponds to the target. The matching of the model image to the target image is an optimization problem where the appearance parameters were varied to minimize the squared difference between the images. The strategy was suggested by Cootes and Taylor [Citation20] in which the spatial pattern of the difference encodes knowledge about how to adjust the model parameters to estimate the prior knowledge before segmentation of the target image. For each step size tried in the segmentation, new parameter values were computed from the estimated adjustments and each of the AAM parameters were constrained to be within ±3 standard deviations to ensure that all possible shapes were generated.
Validation method
The validation of AAM was performed as a leave-one-out cross-validation of all 30 MR data sets. The automated segmentations were compared with the manual reference segmentations both by a visual comparison and by the similarity measures Dice similarity coefficient (DSC) [Citation21], the mean surface distance and the largest distance between the manual and the automated segmentation. The sensitivity and specificity were determined to provide an indication of a possible trend in under- or over-segmentation of the automated method compared with the manual reference delineations. The sensitivity and specificity were also determined based on the overlap (false-true positive and false-true negative) between the segmentations and a high value was therefore desirable. All measures were calculated for each image and then averaged to get one value and standard deviation for each similarity measure.
Results
The appearance model was trained and tested on 30 MR images of the prostate in a leave-one-out cross validation. shows the similarity measures from the automated segmentation compared with the manual reference delineation.
Table I. Results from the comparison of the automated segmentation and the manual reference delineation.
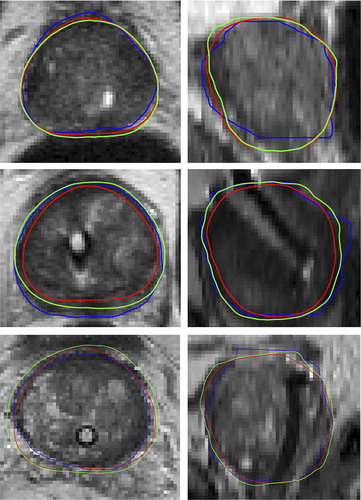
shows the automated prostate segmentation compared with the manual delineations and the average model. It can be seen that the automated segmentation appears more as a smoother contour but also tend to the smaller than the manual delineation.
Figure 1. Examples of the prostate segmentation in the axial plane (left) and the sagittal plane (right) from three patients. Blue: Manual reference segmentation, Green: Automated segmentation, Red: Average model. The DSC for the three segmentations was 0.94 (top), 0.79 (middle), 0.89 (bottom).
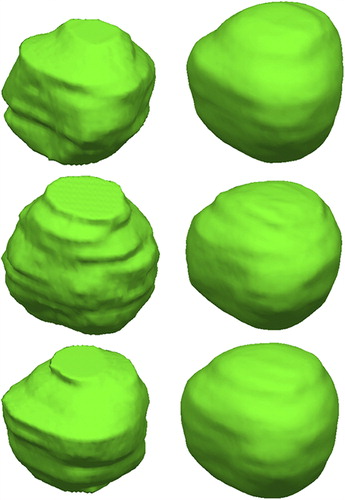
shows the 3D rendering of the manual (left) and the automated (right) segmentation. It can be seen that a segmentation based on slice-based delineation appeared layered while the 3D segmentation appeared smooth over the volume.
Figure 2. Examples of the prostate segmentation. Left: The reference manual segmentation. Right: Automated 3D segmentation.
Both the similarity measures and the visual comparison indicated that the outliers in the DSC occurred when the model failed to find the correct size of the prostate with the largest volume. This was supported by the sensitivity and specificity of the method indicating cases of under-segmentation.
Discussion
An automated prostate segmentation method has been presented for planning prostate cancer radiotherapy to potentially reduce the inter-observer variation in the manual delineation. The prostate segmentation was performed using MR as it is increasingly used for prostate delineation because of the superior soft-tissue visualization compared with CT. An accurate and fast automated segmentation of the prostate could be used to track the prostate before treatment and could decrease the time used for clinical target delineation in the planning of radiotherapy. This would require that a clinical validation of the automated method was performed.
The method was based on the AAM originally suggested by Cootes et al. [Citation15] and reformulated by Hu and Collins [Citation17] with a level-set representation of the shape by which the need for selecting landmarks is eliminated. Prior knowledge about how to guide the parameter optimization in the segmentation algorithm was incorporated in the training of the model. The iterative segmentation proposed by Cootes et al. [Citation15] to allow for pose changes during segmentation was extended to a 3D segmentation.
Other studies report similar results as obtained here with a mean and median DSC of 0.84 and 0.86, respectively. The range of mean DSC from the previous studies is 0.84–0.88 [Citation8–10,Citation13,Citation14] and the range for the median DSC is 0.85–0.86 [Citation5,Citation9]. The sensitivity of the study by Martin et al. [Citation10] was 0.86 compared with ours of 0.99. However, the numbers are difficult to compare as a different imaging protocol have been used. For example, Toth and Madabhushi [Citation14] used MR images acquired using an endorectal coil, which makes the prostate boundary easier to detect.
Outliers in the results are cases in which the algorithm fails to determine the correct scale, which is the case for the segmentation with the lowest DSC but the largest volume. Here the model fails to represent the structure, because it is not sufficiently represented in the training set. Visually, the method preformed best in the central part of the prostate, which could be explained by the generally better image support here.
There was a trend in the present study that using the automated segmentation method compared with the manual segmentation resulted in an under- segmentation of the prostate. The manual prostate delineations originally used as the clinical target volume were used for training the AAM and the validation in the lack of a true gold standard, which can explain some of the errors in the automated segmentation. The inter-observer variation of the manual delineations was not validated. The 3D rendering of the manual and the automated segmentation illustrates that a segmentation based on slice contours will appear layered in the sagittal and coronal plane. The 3D segmentation appears in contrast as a smooth segmentation in all image planes.
A fully automated 3D prostate segmentation using an AAM was developed and validated for 30 patients to reduce inter-observer variation in the target delineation. The performance of the method was comparable to other studies with a dice similarity coefficient of 0.84 and showed the feasibility for automated prostate segmentation in MR using active appearance models.
Supplementary Appendix and Figure A1
Download PDF (1.6 MB)Acknowledgments
Supported by CIRRO – The Lundbeck Foundation Center for Interventional Research in Radiation Oncology and The Danish Council for Strategic Research.
Declaration of interest: The authors report no conflicts of interest. The authors alone are responsible for the content and writing of the paper.
References
- Hentschel B, Oehler W, Strauß D, Ulrich A, Malich A. Definition of the CTV prostate in CT and MRI by using CT–MRI image fusion in IMRT planning for prostate cancer. Strahlenther Onkol 2011;187:1–8.
- Rasch C, Barillot I, Remeijer P, Touw A, Van Herk M, Lebesque J V. Definition of the prostate in CT and MRI: A multi-observer study. Radiat Oncol J 1999;43:57–66.
- Flores-Tapia D, Venugopal N, Thomas G, McCurdy B, Ryner L, Pistorius S. Real time MRI prostate segmentation based on wavelet multiscale products flow tracking. Engineering in Medicine and Biology Society (EMBC), 2010 Annual International Conference of the IEEE IEEE 2010:5034–7.
- Zwiggelaar R, Zhu Y, Williams S. Semi-automatic segmentation of the prostate. Pattern Recognit Image Anal 2003:1108–16.
- Klein S, Van der Heide UA, Lips IM, Van Vulpen M, Staring M, Pluim JPW. Automatic segmentation of the prostate in 3D MR images by atlas matching using localized mutual information. Med Phys 2008;35:1407–17.
- Langerak TR, Van der Heide UA, Kotte ANTJ, Viergever MA, Van Vulpen M, Pluim JPW. Label fusion in atlas-based segmentation using a selective and iterative method for performance level estimation (SIMPLE). IEEE Trans Med Imaging 2010;29:2000–8.
- Martin S, Daanen V, Troccaz J. Atlas-based prostate segmentation using an hybrid registration. Int J Comput Assist Radiol Surg 2008;3:485–92.
- Pasquier D, Lacornerie T, Vermandel M, Rousseau J, Lartigau E, Betrouni N. Automatic segmentation of pelvic structures from magnetic resonance images for prostate cancer radiotherapy. Int J Radiat Oncol Biol Phys 2007;68:592–600.
- Toth R, Bulman J, Patel AD, Bloch BN, Genega EM, Rofsky NM, et al. Integrating an adaptive region-based appearance model with a landmark-free statistical shape model: Application to prostate MRI segmentation. Proc SPIE Med Imag 2011:79622V–79622V-12.
- Martin S, Troccaz J, Daanen V. Automated segmentation of the prostate in 3D MR images using a probabilistic atlas and a spatially constrained deformable model. Med Phys 2010; 37:1579–90.
- Chandra S, Dowling J, Shen K, Raniga P, Pluim J, Greer P, et al. Patient specific prostate segmentation in 3D magnetic resonance images. IEEE Trans Med Imaging 2012;32:1955–64.
- Chowdhury N, Toth R, Chappelow J, Kim S, Motwani S, Punekar S, et al. Concurrent segmentation of the prostate on MRI and CT via linked statistical shape models for radiotherapy planning. Med Phys 2012;39:2214–28.
- Ghose S, Oliver A, Marti R, Lladó X, Freixenet J, Vilanova JC, et al. Prostate segmentation with texture enhanced active appearance model. 6th Int Conf Signal-Image Technol Internet-Based Syst (SITIS)2010:18–22.
- Toth R, Madabhushi A. Multifeature landmark-free active appearance models: application to prostate MRI segmentation. IEEE Trans Med Imaging 2012;31:1638–50.
- Cootes TF, Edwards GJ, Taylor CJ. Active appearance models. Computer Vision—ECCV’98 1998:484–98.
- Cootes TF, Edwards GJ, Taylor CJ. Active appearance models. IEEE Trans Patt Anal Mach Intell 2001;23:681–5.
- Hu S, Collins DL. Joint level-set shape modeling and appearance modeling for brain structure segmentation. NeuroImage 2007;36:672–83.
- Stephansen UL. Level-set appearance modeling for segmentation of anatomical structures in 3-D images. AAU - Master thesis; 2012.
- Carl J, Nielsen J, Holmberg M, Hojkjaer Larsen E, Fabrin K, Fisker RV. A new fiducial marker for image-guided radiotherapy of prostate cancer: Clinical experience. Acta Oncol 2008;47:1358–66.
- Cootes TF, Taylor CJ. Statistical models of appearance for computer vision. Imag Sci Biomed Engineer 2004;8.
- Dice L. Measures of the amount of ecologic association between species. J Ecol 1945;26:297–302.