
Abstract
Background. A mathematical framework is presented for simultaneously quantifying and evaluating the trade-off between tumor control and late complications for risk-based radiation therapy (RT) decision-support. To demonstrate this, we estimate life years lost (LYL) attributable to tumor recurrence, late cardiac toxicity and secondary cancers for standard-risk pediatric medulloblastoma (MB) patients and compare the effect of dose re-distribution on a common scale. Methods. Total LYL were derived, based on the LYL attributable to radiation-induced late complications and the LYL from not controlling the primary disease. We compared the estimated LYL for three different treatments in 10 patients: 1) standard 3D conformal RT; 2) proton therapy; 3) risk-adaptive photon treatment lowering the dose to part of the craniospinal (CS) target volume situated close to critical risk organs. Results. Late toxicity is important, with 0.75 LYL (95% CI 0.60–7.2 years) for standard uniform 24 Gy CS irradiation. However, recurrence risk dominates the total LYL with 14.2 years (95% CI 13.4–16.6 years). Compared to standard treatment, a risk-adapted strategy prescribing 12 Gy to the spinal volume encompassing the 1st–10th thoracic vertebrae (Th1–Th10), and 36 Gy to the remaining CS volume, estimated a LYL reduction of 0.90 years (95% CI -0.18–2.41 years). Proton therapy with 36 Gy to the whole CS volume was associated with significantly fewer LYL compared to the risk-adapted photon strategies, with a mean LYL difference of 0.50 years (95% CI 0.25–2.60 years). Conclusions. Optimization of RT prescription strategies considering both late complications and the risk of recurrence, an all-cause mortality dose painting approach, was demonstrated. The risk-adapted techniques compared favorably to the standard, and although in this context, the gain is small compared to estimated uncertainty, this study demonstrates a framework for all-cause mortality risk estimation, rather than evaluates direct clinical applicability of risk-adapted strategies.
Radiation therapy (RT) must balance the chance of cure against the risk of severe treatment complications. This trade-off varies between patients and typically depends on available treatment modalities. Yet, few quantitative and testable decision-support tools have been proposed to aid clinicians in the process of prioritizing risks across different endpoints. As pediatric patients are particularly sensitive to treatment-induced complications, there is a great need for such tools as most children will now be cured from their disease and become long-term survivors [Citation1]. Hence, the focus of pediatric RT research has recently shifted towards reducing treatment- related toxicity while maintaining a high rate of disease control. Quantifying the trade-off between tumor control and the risk of late complications involves comparing measures of primary disease survival with estimated risks of, e.g. developing secondary cancer or cardiac disease up to several decades later. Here, we propose using a life years lost (LYL) measure for common scale comparison of the risk of different late complications with that of disease recurrence. This measure accounts for the difference in time-to-event, severity of the given event and the presence of competing risks between the different endpoints.
For homogenous targets, a highly conformal and uniform radiation dose distribution is optimal in terms of tumor control [Citation2]. An overall better treatment could, however, result from a slight reduction in tumor control probability (TCP) if, in return, this would considerably reduce the incidence of severe late toxicity. Using the LYL measure, we set up a mathematical framework to investigate if limiting the prescribed radiation dose to a part of the target volume associated with a high dose of incidental radiation to critical organs at risk could reduce the risk of late complications sufficiently to outweigh the potential increase in recurrence risk. Prescription of non-uniform doses to the target based on heterogeneity in tumor radio-responsiveness has already been the subject of numerous studies [Citation3,Citation4]. This proof-of-principle study is, to our knowledge, the first attempt at defining an optimal, non-uniform dose based on the risk of normal tissue complications in the presence of an (assumed) homogeneous risk of local tumor recurrence within the RT target volume. A decision-support tool is developed and applied to a group of 10 pediatric medulloblastoma (MB) patients for a set of risk-adapted treatment strategies. Specifically, we aim to evaluate if the LYL can be reduced with a non-uniform dose prescription and to estimate the uncertainty of the total LYL estimates.
Material and methods
Concept methodology – Estimating the LYL attributable to the primary disease and late complications
The methodology for estimating the LYL attributable to late complications of RT has been described in detail elsewhere [Citation5], although some of the dose-response models have been updated (Supplementary material Appendix 1, to be found online at http://informahealthcare.com/doi/as/10.3109/0284186X.2013.858824). Late complications considered in this analysis were secondary breast, lung, stomach and thyroid cancer as well as heart failure and myocardial infarction.
A tumor control dose-response model is used to estimate the five-year overall survival (OS) as a function of radiation dose. This must be combined with a survival function after disease relapse/progression in order to estimate disease-specific survival (DSS) after treatment as a function of dose.
In the following, we derive an expression for DSS as a function of time. The probability of relapsing at an attained age a is the product of the probability of being failure free up to time a (here denoted as freedom from progression [FFP(a)] and the dose-dependent hazard of relapse at time a, hrelapse (a);
The risk of dying within a narrow time interval (t, t + Δt) from a relapse occurring at time a is defined as
where Srelapse is the survival probability after relapse. We parameterize this survival function as an exponential, Srelapse(t) = exp(−λS.t) fitted to data on the survival after relapse [Citation6]. Here λS is the assumedly constant hazard of dying after a relapse and t is the time passed since relapse. The disease-specific risk of dying in the time interval (t, t + Δt) after a recurrence at time a is then
We then integrate over all possible relapse times, a, ranging from time of treatment (age at exposure, e) to time of observation, t, to find the total risk of dying from a relapse in the narrow time interval (t, t + Δt).
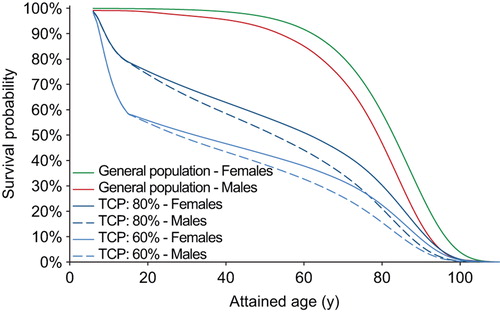
We correct for the (very small) non-cancer related competing risks by multiplying the calculated DSS with the age- and sex-matched survival in the US general population to yield the OS shown in .
Figure 1. Impact of the estimated tumor control probability (TCP) on the survival curve. The TCP affects the LYL of late complications because these are competing risks – a poor long-term survival means less risk of experiencing a late event. This example shows the difference in estimated overall survival for males and females for a TCP of either 80% or 60%.
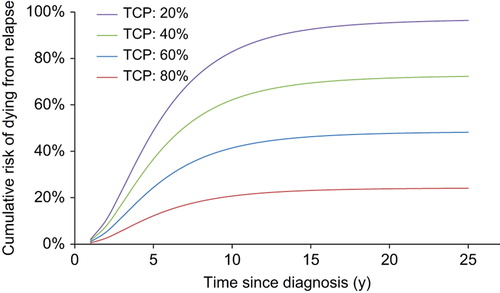
We calculated the disease-specific risk of dying up to 10 years after treatment, as most relapse-related deaths will have occurred by then, cf. . That means that until t = e + 10 years we use Equation 4 to calculate the DSS. More than 10 years after treatment, the OS is described by a survival function with long-term follow-up of a cohort of patients relevant to the disease in question, preferably including death due to late recurrence and other potential causes of death, normalized to fit the TCP-based OS function at 10 years.
Figure 2. The estimated risk of dying from failure to control the primary disease using our presented mathematical framework is shown to increase until about 10 years after diagnosis. The graphs compare four different levels of tumor control probability represented by the five-year freedom from progression.
The LYL attributable to the primary disease (denoted LYLrelapse) is then estimated for the first 10 years after diagnosis. The LE after having relapsed (LErelapse) is derived from the survival curve after relapse, Srelapse(t). The LYL from a relapse occurring at attained age a is the probability of having a relapse, multiplied by the difference in LE for someone with a relapse of the disease in question compared to that of an age- and sex-matched person in the general population (LEgen.pop):
where ![]() and the LEgen.pop is taken from life tables of the US general population. The total LYL attributable to the primary disease is then obtained by integrating over all ages, a, up to 10 years after treatment.
and the LEgen.pop is taken from life tables of the US general population. The total LYL attributable to the primary disease is then obtained by integrating over all ages, a, up to 10 years after treatment.
Application to standard-risk medulloblastoma
To apply the above methodology for pediatric MB we need a time-dependent tumor control dose- response model, a survival function after relapse, dose-response models for radiation-induced late complications and long-term survival data for MB patients.
A tumor control dose-response model estimating the five-year FFP for standard-risk MB patients which considers multiple prescription levels and modes of failure was derived and explained in detail elsewhere [Citation7]. In order to generalize this TCP model to inhomogeneous dose distributions, we here assumed that:
The risk of relapse per unit volume is assumed constant within each of the two target volumes (primary and elective volume). However, it should be noted that while the risk is assumed constant within each of the two targets, it is allowed to vary between the targets and the risk of relapse for a given dose will be expected to be highest in the boost volume, which was also seen in the dose-response curves in [Citation7].
The relapse risk in all volume elements (i.e. voxels) are independent of each other.
The formulation suggested by Kim and Tomé [Citation8] for calculating an overall TCP based on estimates of several sub-regions was applied:
where Dji is the dose to the i:th voxel of the j:th target volume and vji is the fractional volume of that voxel. R is the number of sub-regions of the target and kR is the number of voxels within a sub-region. The assumption of independence is used to define the total TCP as the product of the control probability in all voxels and sub-regions. The dose-response relations for the different sub-regions were derived as logistic functions with the logarithm of dose as a covariate, as presented in Bentzen and Tucker [Citation9]
where Dji represents the dose received by the voxels in vji which is the i:th fractional volume in the j:th sub-region of the target. In this case there are two sub-regions (R = 2), the elective volume and the boost volume, for which their individual dose-volume histograms are made up of kR volume elements. γj50 and Dj50 describe the logistic dose-response curve for each sub-region, P0 is tumor control with no radiation. The TCP estimates calculated from Equation 7 corresponds to the FFP up to five years after treatment.
The survival probability for relapsing MB patients (Srelapse) treated with high-dose chemotherapy or standard salvage therapy was obtained by fitting an exponential model to data from a previously published study [Citation6] and the long-term survival was taken from the survival curve presented for survivors of CNS malignancies in the CCSS [Citation10].
Patient material and treatment planning strategies
Treatment plans with different prescription strategies were simulated on computed tomography scans of 10 pediatric MB patients aged 4–15 years treated at Rigshospitalet, Copenhagen between 2007 and 2009. In MB treatment, the risk of treatment-related side-effects has been reduced somewhat through the introduction of a lowered craniospinal (CS) treatment dose to 24 Gy for standard-risk patients, compared to the previous 36 Gy. Good disease control rates are achieved for the standard-risk group with this lower CS dose with five- year event-free survival (EFS) ranging from about 75–85% [Citation11,Citation12]. To investigate the possibility of risk-based decision-support, treatment plans were generated using 3D conformal radiation therapy (3D CRT) where the following treatment strategies were explored:
Homogeneous dose distribution of 24 Gy using 3D CRT (current standard):
Lowering the prescribed dose to the part of the CS target encompassing the 1st–10th thoracic vertebrae (Th1–Th10) using 3D CRT; the rationale being that this region would include the most critical structures (heart, lungs, breasts);
Lowering the prescribed dose to the entire spinal canal using 3D CRT, which would include all risk organs related to the late complications considered in this analysis;
Homogeneous dose distribution using proton therapy.
All dose levels considered in this analysis assume a standard fractionation of 1.8 Gy/fx or the closest value that fits with the respective total dose. For all strategies, the cranial target was planned with two lateral opposing fields. For strategy 1) and 3) a single spinal field from the posterior direction was planned and for strategy 2) we used two separate spinal fields. Four fields from the latero-posterior direction (two opposed and two oblique) were used to plan the posterior fossa (PF) boost, except for proton therapy where only one posterior field was used. Details for the planning of the spot-scanned proton therapy plans are described elsewhere [Citation13]. Secondary neutron doses were estimated for the proton plans according to the same method as in the previous report although here we used the recommended values of the relative biologic effectiveness of neutrons from ICRP publication 92 [Citation14].
Treatment plans were simulated with the prescribed dose varying between 0 and 36 Gy in 3 Gy increments, resulting in 13 different plans for each patient. Similarly to the Th1–Th10 or spinal canal, we also varied the dose to the remaining part of the CS target volume. This to investigate whether a potential drop in TCP from lowering the dose to part of the target could be compensated for by increasing the dose to the remaining target volume. The dose to the PF boost volume was kept constant at 54 Gy for all scenarios. All in all, 13 × 13 treatment plans were simulated for each of the 10 patients and for each of the prescription strategies and analyzed according to estimated TCP and the number of LYL, attributable to the primary disease and late complications.
Statistical analysis
The major source of uncertainty in the LYL estimates lies in the dose-response parameters, both for the TCP model and for the late complications. To assess the uncertainty in the final LYL estimates, a Monte Carlo sampling method was used, sampling over the uncertainty in all of the dose-response parameters. For the TCP model, 2000 samples were drawn randomly from beta distributions representing the mean and 95% binomial confidence intervals (CIs) of the five-year EFS values of each study included in the model [Citation7]. For each sample, a unique dose-response curve was derived and used to estimate the TCP. Similarly, 2000 samples were drawn from log-normal distributions representing the mean and 95% CIs of the dose-response parameters for late complications. This provides us with statistical uncertainty estimates based on the input parameter uncertainties. What is not considered in this uncertainty, however, are potential systematic errors, e.g. breakdown of the assumptions for the TCP model or that the true functional form of the risk-estimation curves are different from the ones applied here.
For each randomly drawn set of model parameters, the LYL attributable to the disease and the late complications were calculated for the whole patient population and all the treatment prescriptions studied. The final estimates of LYL and 95% CI for each patient were taken as the median and 2.5–97.5 percentile of the resulting LYL distributions. Similarly, the differences in LYL between treatment strategies were found by calculating the LYL differences for each randomly drawn sample and extracting the difference estimate with 95% CI for each patient in the same way, i.e. by a paired comparison. To avoid potentially underestimating the variance due to the small number of patients, a bootstrapping procedure was applied where the median and 95% CI was derived for 200 000 samples of the 10 patients randomly drawn with replacement. For each sample, the estimates were weighted by the inverse variance between patients and the final difference in LYL with 95% CI was taken as the median and 2.5–97.5 percentile of all randomly drawn bootstrap samples.
Results
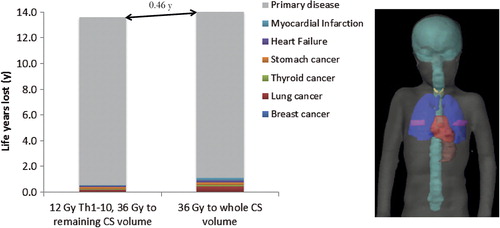
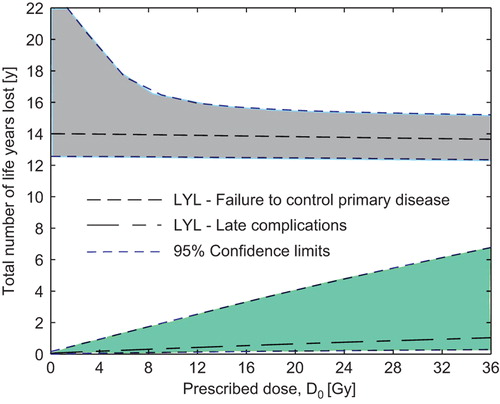
compares the estimated number of LYL between uniform whole CS irradiation to 36 Gy and a risk-adapted strategy of lowering the dose to the Th1–Th10 to 12 Gy. Clearly, the LYL attributable to the primary disease dominate the resulting LE. However, reducing the dose to the Th1–Th10 target to 12 Gy lowers the estimated number of total LYL by substantially decreasing the risk of late complications while the accompanying drop in TCP is estimated to be small.
Figure 3. Number of life years lost (LYL) attributable to various late complications and failure to control the primary disease for two different prescription strategies. Even though the primary disease dominates the LYL there is an estimated gain if lowering the dose to the Th1–Th10 part of the craniospinal target. In the right hand panel, the anatomical position of the heart, lungs, thyroid, mammary glands and stomach are shown in relation to the craniospinal target (in cyan).
For CS doses of zero, 18, 24 and 36 Gy the average estimated TCP values, and 95% CIs based on 2000 Monte Carlo samples of the dose-response parameters, representing five-year FFP were 76% (0–81%), 78% (73–81%), 79% (76–82%) and 80% (77–84%), respectively, while maintaining a 54 Gy PF dose. The estimated five-year FFP with zero Gy to the Th1–Th10 target or to the entire spinal canal while maitaining 24 Gy to the rest of the CS volume was 78% (63–81%) or 78% (8–81%), respectively. Resulting from the median dose-response relationship for the CS elective volume being quite shallow, although with very large uncertainty as reflected by the wide CIs.
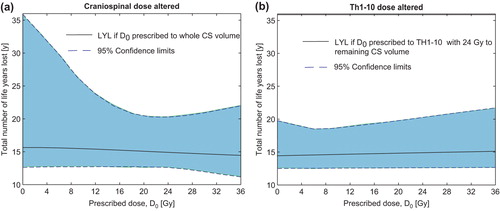
Reducing the dose to the whole CS target yields a net increase in the estimated number of LYL, whereas reducing the dose to the Th1–Th10 sub-target only causes a small drop in TCP that is compensated for by a reduced risk of late complications, cf. . It should be noted that the 95% CIs are quite large, especially for low doses to the CS volume which stems from considerable uncertainty in the TCP model at low doses.
Figure 4. Estimated total number of life years lost if altering the prescription dose to (a) the whole craniospinal target volume or (b) Th1–Th10. Here (b) corresponds to treatment strategy 2 in the text. Confidence limits are based on Monte Carlo sampling of the dose-response parameters for late complications and tumor control.
The effect of altered dose prescriptions on the combined uncertainty in LYL can be seen in and . The total LYL is dominated by failure to control the primary disease ( and ).
Figure 5. Separation of the life years lost (LYL) attributable to late complications and failure to control the primary disease. Here, the dose to the spinal canal is altered (treatment strategy 3) while a dose of 24 Gy is maintained to the remaining CS volume. Confidence limits are based on Monte Carlo sampling of the dose-response parameters for late complications and tumor control. Note that failure to control the primary tumor dominates the total LYL for these patients.
The prescription dose yielding the minimum number of LYL was achieved by zero Gy to the Th1–Th10 while prescribing the full dose of 36 Gy to the remaining CS volume. This is a result of the shallow TCP dose-response curve where the increase in LYL attributable to lower tumor control is outweighed by the decrease in LYL from late complications. If prescribing zero Gy to either the Th1–Th10 or the spinal canal the LYL attributable to disease control failure were 13.5 years (95% CI 11.8–19.5 years) and 13.7 years (95% CI 12.2–32.8 years), respectively. The high upper limits of these CIs reflect the large uncertainty in TCP estimates at low doses.
shows the estimated difference with 95% CIs in LYL between the standard uniform 24 Gy treatment and five specific risk-adapted strategies.
Figure 6. Differences in total life years lost (LYL) between the standard uniform 24 Gy treatment and risk-adapted strategies. For all risk-adaptive strategies, 36 Gy is prescribed to the remaining craniospinal volume. Accompanying illustrations of the different treatment strategies are shown in dose color-wash. A positive LYL difference means fewer LYL with the risk-adapted approach. The vertical bars show the 95% confidence intervals of the LYL differences.
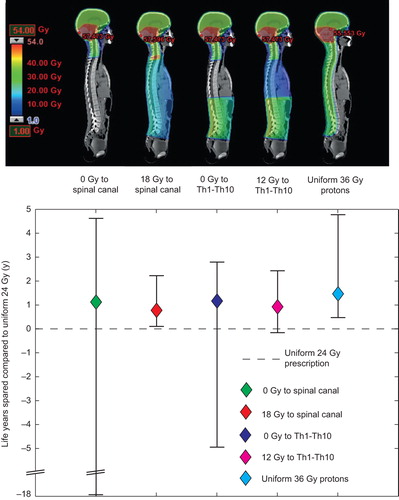
Prescribing 12 and 18 Gy to the Th1–Th10 and spinal canal respectively results in slightly less life years spared when compared to prescribing zero Gy. However, the 12–18 Gy prescriptions have considerably less uncertainty, especially in the unfavorable end of the CI. A homogeneous dose of 36 Gy with protons yields an estimated LYL from the primary disease of 13.3 years (95% CI 10.8–14.7 years) and 0.12 years (95% CI 0.04–0.57 years) from late complications. In a paired statistical comparison, there was significantly more life years spared with proton therapy compared to the risk-adapted photon strategies. The mean differences were 0.50 years (95% CI 0.25–2.60 years) between the 12 Gy to the Th1–Th10 strategy and proton therapy and 0.68 years (95% CI 0.36–2.57 years) between the 18 Gy to the spinal canal strategy and proton therapy.
Discussion
A method for comparing TCP estimates and late complication risks on a common scale was developed and applied to assess risk-adaptive prescription strategies for pediatric MB patients. A common scale measure of complication risk and TCP has two advantages: 1) it allows direct quantification of the therapeutic ratio between different treatment strategies; and 2) it provides an understanding of the relative importance of each endpoint. Morbidity and mortality is a known issue for childhood cancer patients. Our data reflects this, but also emphasizes that lack of tumor control is by far the dominant cause of LYL and, consequently, strategies to decrease the risk of late complications should be carefully weighed against the potential loss in TCP.
We presented a dose prescription optimization exercise to show that a homogeneous dose to the target may not be the optimal choice, even for a homogeneous tumor recurrence risk, when also considering the effect on healthy tissues. This is, to our knowledge, the first attempt at presenting a non-uniform dose prescription strategy based on risk of toxicity rather than intra-tumor heterogeneity. This adds a dimension to the famous demonstration by Brahme et al. that a homogeneous tumor is best irradiated with a homogeneous dose [Citation2]. The prescription strategies explored here focused on lowering the dose to the thoracic region. Considering also non-lethal endpoints such as neurocognitive decline from cranial irradiation would be an interesting extension, but is beyond the scope of this study. Admittedly, the uncertainties in our model estimates are considerable, so the present study should be seen as a proof-of-principle study rather than an attempt to derive alternative prescription strategies for clinical use.
The uncertainty in the estimated TCP is lowest around CS doses of 24–36 Gy since this is where most clinical experience is concentrated. Consequently, the uncertainty in LYL attributable to recurrence risk is also lowest around these doses. There have been attempts to further lower the CS dose to 18 Gy, although the patient numbers were very limited [Citation15–17]. The results of the ongoing ACNS 0331 trial which randomizes MB patients between 23.4 and 18 Gy CS irradiation should provide further insight into this. The uncertainty in LYL attributable to late complications, however, is roughly proportional to dose, which is a result of all but one risk model involving a linear dose-effect relationship (Supplementary material Appendix 1, to be found online at http://informahealthcare.com/doi/abs/10.3109/0284186X.2013.858824).
Since proton therapy is estimated to reduce the risk of cardiac complications and secondary cancers without compromising target coverage this should be the preferred treatment option for these patients, although the availability of CS proton therapy is currently sparse. Proton therapy given with 36 Gy to the whole CS volume was in this work estimated to result in significantly fewer LYL compared to any of the photon therapy strategies including the risk-adapted ones.
The very large uncertainty in the low dose range reflects the limitations in the current clinical evidence at these doses and is similarly reflected in the respective LYL estimates. The risk-adapted strategies with very low prescribed doses should therefore at present be considered unsuitable for clinical implementation. The purpose of this model is rather to show proof-of-principle and to provide clinical decision support, as is done by highlighting the fact that the LYL attributable to the primary disease considerably outweigh the estimated LYL from late complications in standard-risk MB patients.
There are a few studies of infant MB patients treated without elective craniospinal RT that suggest only slightly worse tumor control compared to older children treated to full dose CS irradiation [Citation18,Citation19]. This may suggest a shallow elective volume dose-response curve, but the potential bias in comparing infants with no RT to the elective volume to older children with elective RT should be kept in mind and the interpretation should be cautious.
When interpreting the results of this proof- of-concept analysis it is important to consider the uncertainties and assumptions involved, especially in the TCP model. The assumptions require validation, preferably in a large MB cohort with detailed pattern of failure information. Whether the risk of relapse is in fact uniformly distributed within the CS target volume cannot, currently, be deduced from reported pattern of failure data [Citation11,Citation12]. Verifying or rejecting this assumption should ideally be made from careful analysis of the pattern of recurrence in a clinical series. If such data became available, it would provide an important refinement of the model and would likely bring the approach closer to clinical utility.
Non-lethal endpoints such as neurocognitive decline, hypothyroidism, hearing loss and endocrine toxicity could also be incorporated into the model to estimate quality-adjusted life years lost (QALYLs), however, this is far from trivial and may vary considerably between patients and type of primary cancer. Although such an extension is beyond the scope of this study it is very interesting and could be added to the modeling framework presented here.
Mortality data from the CCSS cohort show that, with a mean age of eight years at diagnosis, MB patients that are five-year survivors have an estimated LE of 47 years [Citation20]. Using our parametric TCP-based survival functions the estimated LE of an eight-year-old MB patient (average between males and females), conditional upon being a five-year survivor, is 49 years. This shows that fitting the post 10-year survival curve to the last point of the parametric survival function gives long-term survival estimates that agree with published data.
Since MB has recently been characterized as comprising of four distinct molecular subgroups [Citation21], different strategies for altering the RT dose should likely be applied to the different subgroups. As a step towards further personalizing treatment, the analysis performed in this study could be repeated for each individual subgroup, if or when detailed outcome data from recent MB trials, stratified on molecular biomarkers, become available.
Implementing this LYL model directly into treatment planning software would allow for direct risk-based optimization with the aim of minimizing the total number of LYL. The feasibility of implementing a cost-function based on a scalar measure such as LYL would of course need to be properly investigated with regards to further requirements from optimization-theory. While the potential benefit in terms of LYL uncovered in this study may not be of sufficient magnitude to warrant such a strategy, the principle of simultaneous optimization of TCP and normal tissue complications on a common scale is very attractive. Hodgkin's lymphoma patients may, e.g. benefit more from this approach, because of their excellent prognosis, good salvage options, and considerable risk of severe late complications [Citation22].
For the parts of the CS volume not located close to critical healthy tissues considered in this study (e.g. the brain), the optimal treatment, according to the model, would be to prescribe as much dose as possible. This is a serious limitation of the current analysis, namely that non-lethal endpoints such as cognitive decline or endocrine complications are not considered. Adding such complications to the decision-support tool would more closely resemble the clinical situation.
In conclusion, we have shown how endpoints related to controlling the primary disease and late complications can be evaluated on a common scale, thereby providing an opportunity for simultaneous optimization of tumor control and normal tissue toxicity. The mathematical framework developed here can be applied to other cancer sites given the availability of input data. This results in an optimal, heterogeneous dose distribution, corresponding to an all-cause mortality driven dose painting.
Supplementary material Appendix 1
Download PDF (2.4 MB)Declaration of interest: The authors report no conflicts of interest. The authors alone are responsible for the content and writing of the paper.
Work supported by a grant from the Danish Child Cancer Foundation to Patrik Brodin. Søren Bentzen acknowledges support from the National Cancer Institute grant no. 2P30 CA 014520-34.
References
- Lannering B, Sandstrom PE, Holm S, Lundgren J, Pfeifer S, Samuelsson U, et al. Classification, incidence and survival analyses of children with CNS tumours diagnosed in Sweden 1984–2005. Acta Paediatr 2009;98:1620–7.
- Brahme A, Agren AK. Optimal dose distribution for eradication of heterogeneous tumours. Acta Oncol 1987; 26:377–85.
- Chang JH, Lim JD, Lee ST, Gong SJ, Anderson NJ, Scott AM, et al. Intensity modulated radiation therapy dose painting for localized prostate cancer using 11-C-choline positron emission tomography scans. Int J Radiat Oncol Biol Phys 2012;83:e691–6.
- Berwouts D, Olteanu LA, Duprez F, Vercauteren T, De Gersem W, De Neve W, et al. Three-phase adaptive dose-painting-by-numbers for head-and-neck cancer: Initial results of the phase I clinical trial. Radiother Oncol 2013;107:310–6.
- Brodin NP, Vogelius IR, Maraldo MV, Munck af Rosenschöld P, Aznar MC, Kiil-Berthelsen A, et al. Life years lost – comparing potentially fatal late complications after radiotherapy for pediatric medulloblastoma on a common scale. Cancer 2012;118:5432–40.
- Gururangan S, Krauser J, Watral MA, Driscoll T, Larrier N, Reardon DA, et al. Efficacy of high-dose chemotherapy or standard salvage therapy in patients with recurrent medulloblastoma. Neuro Oncol 2008;10:745–51.
- Brodin NP, Vogelius IR, Bjork-Eriksson T, Munck af Rosenschöld P, Bentzen SM. Modeling freedom from progression for standard-risk medulloblastoma: A mathematical tumor control model with multiple modes of failure. Int J Radiat Oncol Biol Phys 2013;87:422–9.
- Kim Y, Tome WA. Risk-adaptive optimization: Selective boosting of high-risk tumor subvolumes. Int J Radiat Oncol Biol Phys 2006;66:1528–42.
- Bentzen SM, Tucker SL. Quantifying the position and steepness of radiation dose-response curves. Int J Radiat Biol 1997;71:531–42.
- Armstrong GT, Liu Q, Yasui Y, Huang S, Ness KK, Leisenring W, et al. Long-term outcomes among adult survivors of childhood central nervous system malignancies in the Childhood Cancer Survivor Study. J Natl Cancer Inst 2009;101:946–58.
- Lannering B, Rutkowski S, Doz F, Pizer B, Gustafsson G, Navajas A, et al. Hyperfractionated versus conventional radiotherapy followed by chemotherapy in standard-risk medulloblastoma: Results from the randomized multicenter HIT-SIOP PNET 4 trial. J Clin Oncol 2012;30:3187–93.
- Packer RJ, Gajjar A, Vezina G, Rorke-Adams L, Burger PC, Robertson PL, et al. Phase III study of craniospinal radiation therapy followed by adjuvant chemotherapy for newly diagnosed average-risk medulloblastoma. J Clin Oncol 2006;24:4202–8.
- Brodin NP, Munck af Rosenschöld P, Aznar MC, Kiil-Berthelsen A, Vogelius IR, Nilsson P, et al. Radiobiological risk estimates of adverse events and secondary cancer for proton and photon radiation therapy of pediatric medulloblastoma. Acta Oncol 2011;50:806–16.
- ICRP. Relative biological effectiveness (RBE), quality factor (Q), and radiation weighting factor (w(R)). ICRP Publication 92. Ann ICRP 2003;33.
- Goldwein JW, Radcliffe J, Johnson J, Moshang T, Packer RJ, Sutton LN, et al. Updated results of a pilot study of low dose craniospinal irradiation plus chemotherapy for children under five with cerebellar primitive neuroectodermal tumors (medulloblastoma). Int J Radiat Oncol Biol Phys 1996;34:899–904.
- Jakacki RI, Feldman H, Jamison C, Boaz JC, Luerssen TG, Timmerman R. A pilot study of preirradiation chemotherapy and 1800 cGy craniospinal irradiation in young children with medulloblastoma. Int J Radiat Oncol Biol Phys 2004; 60:531–6.
- Yasuda K, Taguchi H, Sawamura Y, Ikeda J, Aoyama H, Fujieda K, et al. Low-dose craniospinal irradiation and ifosfamide, cisplatin and etoposide for non-metastatic embryonal tumors in the central nervous system. Jpn J Clin Oncol 2008;38:486–92.
- Rutkowski S, Bode U, Deinlein F, Ottensmeier H, Warmuth-Metz M, Soerensen N, et al. Treatment of early childhood medulloblastoma by postoperative chemotherapy alone. N Engl J Med 2005;352:978–86.
- Ashley DM, Merchant TE, Strother D, Zhou T, Duffner P, Burger PC, et al. Induction chemotherapy and conformal radiation therapy for very young children with nonmetastatic medulloblastoma: Children’s Oncology Group study P9934. J Clin Oncol 2012;30:3181–6.
- Yeh JM, Nekhlyudov L, Goldie SJ, Mertens AC, Diller L. A model-based estimate of cumulative excess mortality in survivors of childhood cancer. Ann Intern Med 2010; 152:409–8.
- Northcott PA, Korshunov A, Witt H, Hielscher T, Eberhart CG, Mack S, et al. Medulloblastoma comprises four distinct molecular variants. J Clin Oncol 2011;29:1408–14.
- Aleman BM, van Leeuwen FE. Are we improving the long-term burden of Hodgkin’s lymphoma patients with modern treatment?. Hematol Oncol Clin North Am 2007;21: 961–75.