
Abstract
Background. Assessment of target dose conformity in multi-dose-level treatment plans is challenging due to inevitable over/underdosage at the border zone between dose levels. Here, we evaluate different target dose prescription planning aims and approaches to evaluate the relative merit of such plans. A quality volume histogram (QVH) tool for history-based evaluation is proposed.
Material and methods. Twenty head and neck cancer dose-painting plans with five prescription levels were evaluated, as well as clinically delivered simultaneous integrated boost (SIB) plans from 2010 and 2012. The QVH tool was used for target dose comparison between groups of plans, and to identify and improve a suboptimal dose-painting plan.
Results. Comparison of 2010 and 2012 treatment plans with the QVH tool demonstrated that 2012 plans have decreased underdosed volume at the expense of increased overdosed volume relative to the 2010 plans. This shift had not been detected previously. One suboptimal dose-painting plan was compared to the ‘normal zone’ of the QVH tool and could be improved by re-optimization.
Conclusion. The QVH tool provides a method to assess target dose conformity in dose-painting and multi-dose-level plans. The tool can be useful for quality assurance of multi-center trials, and for visualizing the development of treatment planning in routine clinical practice.
Advances in intensity-modulated radiation therapy (IMRT) have dramatically enhanced our capabilities for planning and delivering a prescribed non-uniform radiation dose distribution within the target volume, so-called dose-painting [Citation1]. The dose-painting hypothesis states that if target sub-volumes (TSV) with a larger than average risk of local failure can be reliably identified by molecular imaging or through an empirical analysis of the pattern of failure, then increasing the dose to those TSVs should improve the tumor control probability. Dose-painting for head and neck cancer (H&N) has previously been reported as feasible in terms of treatment planning, delivery and robustness [Citation2,Citation3]. While the ultimate test of the dose-painting hypothesis must come from controlled clinical trials, pursuing this novel paradigm requires improved tools for planning, evaluation and verification of treatment plans.
Dose-painting by contours (DPBC) treatment plans are challenging in terms of dose prescription and evaluation. The prescription dose contains multiple abutting dose-levels with resulting infinitely steep dose gradients between them. External photon beams have finite dose gradients, and thus overdosage of the lower dose-level and/or underdosage of the higher dose-level is inevitable in the border zones. It is not obvious that each TSV in this setting can realistically be covered by, say, 95–107% of prescribed dose as an acceptance criterion. Consequently, there is a need for methods to report plan dose quality for these techniques, and while such concepts are under development, they have not yet reached a stage where they are sufficiently established to enter routine clinical practice. This is defined as ‘level 3 reporting’ in ICRU report 83 [Citation4].
In the published literature on dose-painting, the quality value (Q) is often used to compare the optimized plan dose with the prescribed dose in the target volume. Q is simply the ratio between plan dose and prescribed dose, defined for each voxel, and is conveniently displayed as a cumulative quality volume histogram (QVH). The ideal QVH is a step function at Q = 1. Bowen et al. proposed using Q0.95-1.05 as a measure of QVH steepness, defined as the fraction of the target volume where the plan dose is within ± 5% of prescribed dose [Citation5]. The quality factor (QF) introduced by the Ghent group [Citation3], includes all points on the QVH in the evaluation, describing the mean of the absolute deviation from Q = 1 among all voxels in the target volume. One can also use a standard statistical measure, the root-mean-squared deviation (from the ideal step function QVH), the advantage being its widespread use in similar applications and its immediate statistical interpretation. Yet another option is comparison by gamma evaluation [Citation6]. A limitation of all these methods is that they do not distinguish between under- and overdosage, hence the need for further evaluation tools.
In this study we investigate different approaches for prescribing and evaluating target dose conformity in DPBC and other multi-dose-level treatment plans. The main aim is to present a two-dimensional (2D) tool for target dose evaluation that is applicable for any numbers of prescription dose levels, and evaluate its potential clinical utility.
Material and methods
Treatment planning
All treatment plans in this study were volumetric-modulated arc therapy (VMAT) plans for locally advanced squamous cell carcinoma of the head and neck. Delineated targets were low-risk elective clinical target volume (CTV3), high-risk elective clinical target volume (CTV2), clinical target volume (CTV1), gross tumor volume (GTV) and FDG-avid volume (GTV-PET) [Citation7]. A 4 mm uniform margin was added to form the corresponding planning target volumes (PTV3, PTV2, PTV1, PTV-solid and PTV-PET). The PTVs are specific, i.e. all inner PTVs were subtracted. Thirteen delivered hypopharyngeal simultaneous integrated boost (SIB) plans from 2010 and 13 similar plans from 2012 were retrospectively analyzed to demonstrate the potential of the presented evaluation tool. The prescription doses in these plans were 50 Gy to PTV3, 60 Gy to PTV2 and 66/68 Gy to PTV1, PTV-solid and PTV-PET, delivered in 33/34 fractions. In addition to the clinically delivered plans, DPBC plans were made for 20 H&N patients (treated in 2009 and included in a previous study [Citation8]). The prescription doses in these plans were chosen to match those of an investigational dose redistribution strategy, based on the observed pattern of failure in a large clinical series [Citation8]: 52.8 Gy to PTV3, 60 Gy to PTV2, 69.7 Gy to PTV1, 73.1 Gy to PTV-solid and 79.7 Gy to PTV-PET (34 fractions). For each of the 20 patients, two plans were generated, using different dose prescription approaches as explained below. The SIB plans from 2010 were created in Eclipse (Varian) version 8.9, while Eclipse version 10.0 was used for the SIB plans from 2012 and the DPBC plans. All plans were calculated with the Analytical Anisotropic Algorithm (AAA).
Defining the prescribed dose at multiple dose levels
Two approaches for prescribing dose in DPBC plans were studied: 1) 95% prescription – 95% of a given prescription dose should cover at least 95% of the corresponding TSV; 2) Mean prescription – The mean dose in each TSV should correspond to the prescription dose.
The 95% prescription is used in clinical practice in many centers. The mean prescription may be attractive if a dose prescription function is derived from a map of estimated risk of local failure [Citation7]. The two prescription approaches cannot be expected to result in similar plans. Here, we compare mean dose (Dmean) and dose covering 95% of each TSV (D95%) in DPBC plans for the 20 H&N patients, for each of the two prescription approaches.
Target dose evaluation
The quality value, Q, was used in the evaluation of plan target dose:
where Dplan is the plan dose and Dprescription is the prescription dose for each voxel of coordinates ![]() = (x,y,z) contained in the total target volume (PTV-tot). The Q-values of PTV-tot were displayed in a cumulative quality volume histogram (QVH). The QVH is a generalization of the dose-volume histogram (DVH) to accommodate several prescription levels in a single histogram. The ideal QVH is a step function with Q = 1 in all voxels. To describe the achieved QVH of a plan, four different scalar measures were used: 1) Q0.95-1.05, proposed by Bowen et al. [Citation5], defined as the fraction of PTV-tot receiving 95–105% of prescribed dose; 2) Q0.95-1.07, defined as the fraction of PTV-tot receiving 95–107% of prescribed dose, corresponding to the current standard acceptance criterion for target dose distribution, as of ICRU 62 [Citation9]; 3) the QF proposed by the Ghent group [Citation3]:
= (x,y,z) contained in the total target volume (PTV-tot). The Q-values of PTV-tot were displayed in a cumulative quality volume histogram (QVH). The QVH is a generalization of the dose-volume histogram (DVH) to accommodate several prescription levels in a single histogram. The ideal QVH is a step function with Q = 1 in all voxels. To describe the achieved QVH of a plan, four different scalar measures were used: 1) Q0.95-1.05, proposed by Bowen et al. [Citation5], defined as the fraction of PTV-tot receiving 95–105% of prescribed dose; 2) Q0.95-1.07, defined as the fraction of PTV-tot receiving 95–107% of prescribed dose, corresponding to the current standard acceptance criterion for target dose distribution, as of ICRU 62 [Citation9]; 3) the QF proposed by the Ghent group [Citation3]:
where n is the number of voxels in PTV-tot; and 4) the root-mean-squared deviation from Q = 1, QRMS, which is the standard statistical measure of the deviation between values predicted by an estimator and the values actually observed:
Statistical comparison of plan metrics were carried out using the Wilcoxon signed rank test/rank sum test, as relevant.
A novel 2D QVH tool is presented to allow distinction between under- and overdosage, and to show the area on the QVH where a ‘normal’ treatment plan of a specific kind should be expected to lie, the so-called ‘normal zone’. A worse target dose conformity than normal would give a plan QVH deviating from the normal zone, as the shape of the curve would be shallower. The normal zones of different groups of plans can be compared visually by the tool, e.g. plans from different centers in a phase III study, to detect differences in distribution of under- and overdosage. The normal zone area is based on experience of previous similar plans, preferably plans where target coverage has not been compromised. The normal zone is statistically defined for each Q-value by expanding the median relative volume, Vm, among the plan QVHs with ± 1.45* interquartile range (IQR). In case of normal distribution, this range equals Vm ± 1.96σ and includes 95% of the QVHs. The QVH tool was created using Matlab R2009b (Mathworks, Inc.).
Two applications of the QVH tool are presented: 1) Showing how the QVH tool can be used to identify and subsequently improve a single suboptimal plan; and 2) Using the QVH tool to compare the target dose conformity of hypopharyngeal cancer SIB plans; 13 plans from 2010 and 13 plans from 2012, planned according to the same institutional guidelines.
Furthermore, we present a quality color wash tool to visualize the distribution of under- and overdosage in the patient CT-slices, equivalent to reviewing physical dose in the patient CT-slices. The 3D distribution of Q is shown in a color scale ranging from underdosage (blue) to overdosage (red). The quality color wash tool was generated by exporting the treatment plan from the treatment planning system (TPS) into the Computational Environment for Radiotherapy Research (CERR) software [Citation10]. The plan dose matrix was saved in Matlab and divided by a prescription dose matrix to yield a matrix of Q values, which in turn was imported into CERR for visualization.
The quality color wash tool visualizes the geographical distribution of under- and overdosage in DPBC plans.
Results
shows the plan metrics of the DPBC plans of different prescription approaches. As expected, the mean doses (Dmean) were significantly higher in the 95% prescription plans than in the mean prescription plans (p < 0.001 for all TSVs except PTV-PET, which was used for plan normalization). Dmean deviated more from the prescription dose in the 95% prescription plans, but the target coverage of 95% of the prescription dose was better achieved, as can be expected. A target dose profile of one of the DPBC plans is shown in . In , the QF and QRMS, which both evaluate all points on the QVH, suggest that the mean prescription plans have higher target dose conformity. Q0.95-1.05 and Q0.95-1.07 evaluate different specific points on the QVH: Q0.95-1.05 suggests that the mean prescription plans have higher dose conformity, while Q0.95-1.07 suggests the opposite, although this difference was only borderline significant. Note that the ideal value is 0 for QF and QRMS and 1 for Q0.95-1.05 and Q0.95-1.07.
Figure 1. Dose profile over the target volumes in a DPBC plan, showing the steep gradients of the prescribed dose (52.8 Gy to PTV3, 60 Gy to PTV2, 69.7 Gy to PTV1, 73.1 Gy to PTV-solid and 79.7 Gy to PTV-PET) and the smoother gradients of the achieved plan dose.
Table I. Prescription doses, mean doses and doses covering 95% of the target volume.
Table II. Comparison of the dose-painting plans of different prescription approaches by means of four different scalar measures.
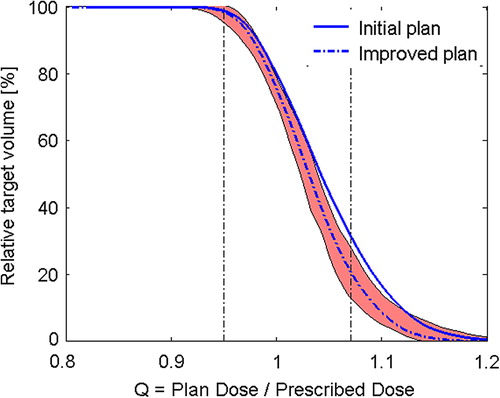
The QVH of one outlying DPBC plan was compared to the ‘normal zone’ of the QVH tool, defined as the median Q values ± 1.45*IQR of the 20 DPBC plans with the 95% prescription approach. The outlying plan was re-optimized and improved (). The QRMS for this plan decreased from 0.071 to 0.057.
Figure 2. The QVH of a suboptimal plan (solid line), shown in relation to the ‘normal zone’ of the QVH tool. The plan was re-optimized and could be improved (dotted line).
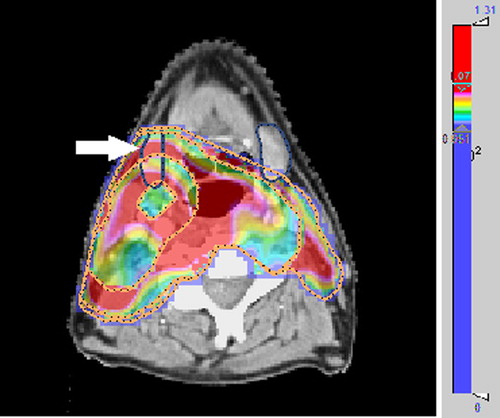
The distribution of under- and overdosage of the DPBC plans was displayed on the patient CT-sets by the quality color wash tool. shows an example, where an unnecessarily wide overdosage region occurs in the position of the right submandibularis.
Figure 3. A suboptimal dose-painting plan shown in quality color wash. Values of Q > 107% (overdosage) appear in red and Q < 95% (underdosage) appear in blue. The high degree of overdosage occurs, inter alia, in the position of the right submandibularis (dark blue contour).
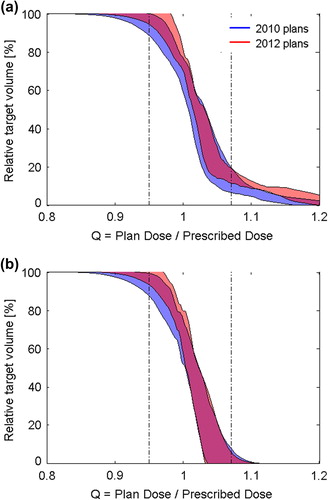
shows the result of using the QVH tool to compare the 2010 to the 2012 hypopharyngeal plans. A shift in planning priorities over time was identified. The 2012 plans had increased overdosage, while the underdosage had been decreased (). The difference between the 2010 and 2012 plans caused a significant difference in mean QRMS: 0.055 (2010 plans) and 0.068 (2012 plans), p = 1.5*10−4. The shift had a very different appearance when dose was reported with a 4 mm optimization margin between the specific PTVs, which is sometimes used to accommodate the dose gradient between the dose prescription levels in the plan optimization process (). When dose was reported with optimization margins present, there was no longer a significant difference in mean QRMS between 2010 and 2012: 0.037 (2010 plans) and 0.031 (2012 plans), p = 0.14.
Figure 4. Comparison by means of the QVH tool between 2010 and 2012 hypopharyngeal treatment plans. The dose is reported for specific PTVs without (a) and with (b) optimization margins between them.
Discussion
Treatment plans with multi-dose-level prescription give rise to complex dose distributions and are challenging to evaluate for clinical acceptance. Similarly, it is challenging to unequivocally describe the dose prescription strategy and to document conformity to dose prescription guidelines with multiple prescription levels. This is illustrated by the difference between target dose conformity of hypopharyngeal plans from 2010 and 2012 using the same clinical guidelines, the same treatment modality, generated and delivered in the same institution ().
As the number of TSVs increases, the use of structure-specific dose metrics becomes less useful. In the most extreme case, dose-painting by numbers [Citation1], each voxel has its own prescription dose. The ICRU report 62 recommends a 95% dose coverage of 95% of the TSV and a max dose of 107% in single-dose-level 3D-conformal plans [Citation9]. In report 83, recommendations for IMRT plans are discussed, and the 95–107% dose coverage is questioned, as inhomogeneous target doses might be favorable in some cases. Also, it is pointed out that if the prescription approach is changed, the effect on the treatment plans must be carefully evaluated [Citation4]. As dose-painting radiation treatment is a novel concept not mentioned in current recommendations, this points to a need for studies focusing on the prescription and evaluation of such plans.
The 95% prescription approach led to TSV mean doses which were considerably higher than the prescription doses for all TSVs in the DPBC plans, except at the highest dose level (). The difference between the two prescription approaches illustrates that before multi-center dose-painting trials can be initiated, a consensus must be reached on the interpretation of the prescription function and how to use it in the clinic.
Q provided a basis for plan-specific evaluation of target dose. Q can be used for plans with arbitrarily numbers of TSVs. The steepness of the QVHs was evaluated using four different scalar measures. None of them distinguish between under- and overdosage, but are nevertheless useful in statistical tests of significance between groups of plans. Q0.95-1.05 and Q0.95-1.07 may give rise to different plan rankings, as they only evaluate specific points on the QVH curve. The QF and QRMS, both evaluating all points on the curve, give rise to equivalent results (). There is no ground truth on the ‘best’ scalar measure to use, but our personal preference is QRMS, as the root-mean-squared deviation is a generally recognized statistic with a wide range of applications.
The 2D QVH tool was proposed as a method to visualize more details of the target dose conformity in dose-painting and other multi-dose-level treatment plans. The definition of the ‘normal zone’ has the advantage that the plot remains visually clear when the number of plans or dose levels increase. Hence, compared to looking at the individual DVHs, the QVH tool is better suited for comparing a large number of plans or detecting small difference between plans. The target DVHs for all plans of this study are shown as Supplementary Appendix, available online at http://informahealthcare.com/doi/abs/10.3109/0284186X.2014.906747.
In it was demonstrated how the QVH tool can be used to visualize the poorer target dose conformity of a suboptimal plan. As the tool gives information on the distribution between under- and overdosage, it could be established that this plan was overdosed, and this information was used to re-optimize and improve the plan. Note that the QVH tool is visual and can help in the clinical assessment of target dose acceptance, but gives no quantitative measure of when a plan should be re-optimized. Previously, Appenzoller et al. developed a tool to assess the OAR sparing achievable with modern IMRT techniques based on a set of previously accepted dose plans [Citation11]. The current work is based on the same idea of using previous plan performance as a ‘gold standard’ for what is normally achievable. Each patient's anatomy, however, determines whether a particular plan is in reality suboptimal.
Geometrical locations of the under- and overdosed areas on the CT-set can be displayed with the quality color wash tool, adding further information to the clinical evaluation for plan acceptance. shows one example of the utility of the tool, where some of the overdosage of TSVs occurs in the unfortunate position of the right submandibularis. This kind of spatial information is of importance for plan acceptance and for the re-optimization process. As for any other visual evaluation of the dose distribution, a conclusion on when a plan is ‘suboptimal’ is subjective.
Firm confirmation of the usefulness of the presented tools would ultimately require its application in a treatment planning system and the choice of dose planners and physicians to use the functionality in the planning or plan approval stage.
We showed that the QVH tool can be used to compare the target dose conformity between groups of plans, in this case the development in treatment planning over time (). It should be stressed that the observed shift is not a result of a deliberate change in plan priorities or institutional guidelines, neither for target dose prescription nor dose to organs at risk. The conclusion of , with optimization margins present, is most likely that target dose conformity has improved from 2010 to 2012, in contrast to , which shows that planning priorities have drifted towards more overdosed plans. The mean QRMS has deteriorated for the plans between 2010 and 2012 (from 0.055 to 0.068, p = 1.5*10−4), which could not be seen with optimization margins present (no significant difference).
Inadequate quality assurance in multi-center clinical trials may prevent the detection of a clinically relevant effect [Citation12]. The present results demonstrate that quality assurance of multi-dose-level plans is challenging in two ways; first, the exact meaning of the dose prescription must be established, and second, the target dose conformity must be monitored and documented. The observed change in target dose conformity in our center () emphasizes that monitoring of the dose planning process itself is necessary, besides ensuring that the planned dose equals the delivered dose. Our QVH tool can be used to monitor the target dose in the planning process during a trial as well as checking protocol compliance after a trial has ended.
In conclusion, two methods for target dose evaluation in dose-painting treatment plans were proposed as a complement to the existing scalar measures: the QVH tool and the quality color wash. We studied the difference between two prescription approaches and showed that monitoring of treatment planning performance with the QVH tool may reveal shifts in target dose conformity that are not based on conscious changes nor changes in guidelines.
Supplementary Appendix
Download PDF (646.6 KB)Declaration of interest: The authors report no conflicts of interest. The authors alone are responsible for the content and writing of the paper.
This study was supported by a research grant from Rigshospitalet Research Committee. Supported in part by grant no. P30 CA 134274-04 from the NCI. Parts of the results were presented at the 2nd ESTRO Forum Meeting (18–23 April, 2013).
References
- Bentzen SM. Theragnostic imaging for radiation oncology: Dose-painting by numbers. Lancet Oncol 2005;6:112–7.
- Korreman S, Ulrich S, Bowen S, Deveau M, Bentzen SM, Jeraj R. Feasiblity of dose painting using volumetric modulated arc optimization and delivery. Acta Oncol 2010; 49:964–71.
- Duprez F, De Neve W, De Gersem W, Coghe M, Madani I. Adaptive dose painting by numbers for head-and-neck cancer. Int J Radiat Oncol Biol Phys 2011;80:1045–55.
- International Commission on Radiation Units and Measurements. 3. Special considerations regarding absorbed-dose and dose-volume prescribing and reporting in IMRT. J ICRU 2010;10:27–40.
- Bowen SR, Flynn RT, Bentzen SM, Jeraj R. On the sensitivity of IMRT dose optimization to the mathematical form of a biological imaging-based prescription function. Phys Med Biol 2009;54:1483–501.
- Low DA, Harms WB, Mutic S, Purdy JA. A technique for the quantitative evaluation of dose distributions. Med Phys 1998;25:656–61.
- Due AK, Korreman S, Bentzen SM, Tomé W, Bender E, Aznar M. Methodologies for localizing loco-regional hypopharyngeal carcinoma recurrences in relation to FDG-PET positive and clinical radiation therapy target volumes. Acta Oncol 2010;49:984–90.
- Vogelius IR, Håkansson K, Due AK, Aznar MC, Berthelsen AK, Kristensen CA. Failure-probability driven dose painting. Med Phys 2013;40:081717.
- International Commission on Radiation Units and Measurements. ICRU Report 62: Prescribing, recording, and reporting photon beam therapy (Supplement to ICRU report 50). Bethesda: ICRU; 1999.
- Deasy JO, Blanco AI, Clark VH. CERR: A computational environment for radiotherapy research. Med Phys 2003; 30:979–85.
- Appenzoller LM, Michalski JM, Thorstad WL, Mutic S, Moore KL. Predicting dose-volume histograms for organs-at-risk in IMRT planning. Med Phys 2012;39: 7446–61.
- Peters LJ, O’Sullivan B, Giralt J, Fitzgerald TJ, Trotti A, Bernier J. Critical impact of radiotherapy protocol compliance and quality in the treatment of advanced head and neck cancer: Results from TROG 02.02. J Clin Oncol 2010; 28:2996–3001.